Windermere offices throughout the Western U.S. have been busy raising money and making donations to non-profit organizations in their local communities that provide services to low-income and homeless families. And their efforts are paying off; so far this year we’ve raised over $1.5 million, bringing the total raised by the Windermere Foundation to $39.5 million since 1989.
Here are just a few examples of how our offices are giving back to their communities:
Fort Collins, Colorado
The Windermere Real Estate office in Fort Collins held its 5th Annual Windermere Foundation Tailgate Party on Friday, September 20. The family-friendly event featured food, drinks, a bouncy house obstacle course, corn hole, face painting, and live music. Over $1,800 was raised for the Windermere Foundation during this event. All proceeds from the tailgate “party with a purpose” benefitted Partners Mentoring Youth and Crossroads Safehouse.
Centralia, Washington
The Windermere office in Centralia, WA sponsored the “Down Home: A Toledo Shindig” event held at Bonanza BBQ on September 14 to benefit Toledo School District students in need. Local businesses and residents came together to donate auction items, food, and volunteer their time. Windermere Centralia office managing broker Paula Burrows, Dan Gorton owner of Bonanza BBQ, and others from the community formed a committee and spearheaded the organization of the fundraising event, seeing a need in the community that was not being met. The Gortons provided the venue and the BBQ. Other sponsors provided additional food items, entertainment, and big-ticket items for the auction. The event raised $34,000 for a fund to help provide basic needs for students in the school district, things that low-income families couldn’t otherwise afford.
Photo Courtesy of Josie Ray Photography
Spokane, Washington
The Windermere office in Spokane, WA held their annual Windermere Shoes and Socks Event at their local Big 5 sporting goods store on August 24. Windermere agents and family members volunteered their time to help 132 children select a pair of shoes and socks. An additional 250 pairs of socks were also donated by Liberty Lake Rotary. In total, the Windermere office donated over $5,400 to provide shoes and socks to local children in need.
Windermere offices are proud to host events in their communities, like the ones mentioned above. These generous donations to the Windermere Foundation further our mission to support low-income and homeless families in the areas where we live and work. If you’d like to help support programs in your community, please click the Donate button.
The following analysis of select counties of the Utah real estate market is provided by Windermere Real Estate Chief Economist Matthew Gardner. We hope that this information may assist you with making better-informed real estate decisions. For further information about the housing market in your area, please don’t hesitate to contact your Windermere Agent.
ECONOMIC OVERVIEW
Utah’s non-agricultural employment rose by 42,100 jobs over the past 12 months, representing a solid growth rate of 2.8%. For perspective, the U.S growth rate is 1.4%. Year to date, Utah has added an average of 3,350 jobs per month, which is down from 4,200 per month last year. I expect we will continue to see modest slowing in employment gains as we move forward given the maturity of the economic cycle. Although the trend is slowing, I anticipate the state will see job growth around 2.8% in 2019. My early forecast for 2020 suggests that Utah will see employment growth of 2.6%.
In August, the state unemployment rate was 2.8%, below the 3.1% level of a year ago.
HOME SALES
In the third quarter of 2019, 10,562 homes sold, representing a solid increase of 8.2% compared to the same period in 2018 and 4.3% higher than in the second quarter of this year.
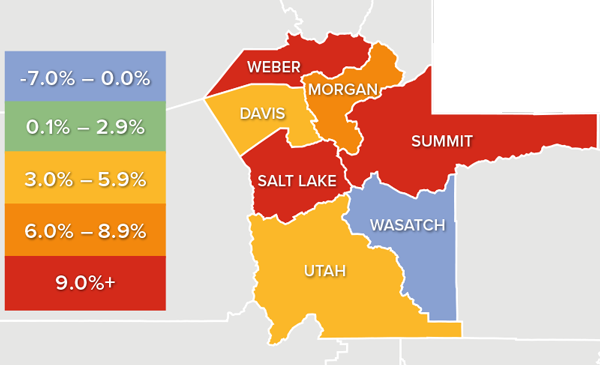
Total sales activity rose in all but the very small Morgan County. Year-over-year, sales rose by double digits in three counties, with impressive increases in Summit and Utah counties.
The number of homes for sale in the third quarter was only 2.6% higher than in the same period a year ago but was 11% higher than the second quarter of this year. There continues to be significantly more choice in the market, which is good news for home buyers.
Pending sales in the third quarter were up 13% compared to a year ago, but were 7% lower than in the second quarter, suggesting that closings in the final quarter of this year may drop from current levels.
HOME PRICES
The average home price in the region continued to rise in the third quarter, with a year-over-year increase of 9% to an average of $401,638. Sale prices were 2.5% higher than in the second quarter of this year.
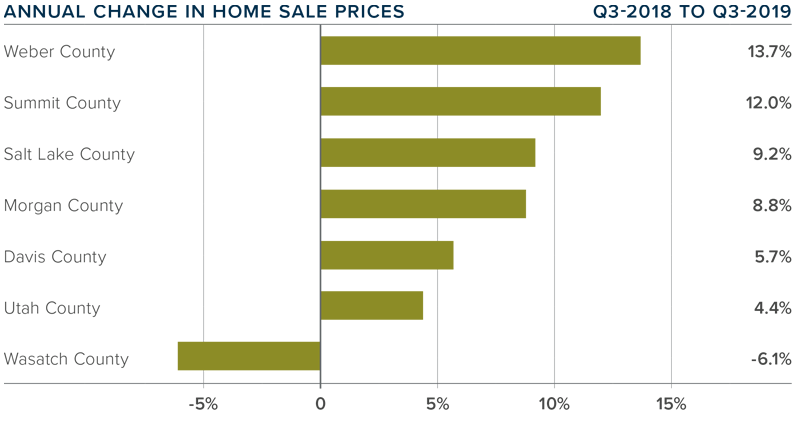
All but Wasatch County saw price increases compared to the same period a year ago. The contraction of price in Summit County was significant, but, because it is a small and very expensive area, I am not overly concerned this represents a pervasive trend.
Appreciation was again strongest in Weber County, where sale prices were up by 13.7% to $298,333. As the most affordable market in the area, this is not surprising.
The takeaway here is that home prices continue to appreciate at significant rates. I still expect to see some moderation in price growth as we move through the year and into 2020, but Utah will clearly continue to outperform the nation as a whole.
DAYS ON MARKET
The average number of days it took to sell a home in the counties covered by this report rose eight days compared to the third quarter of 2018.
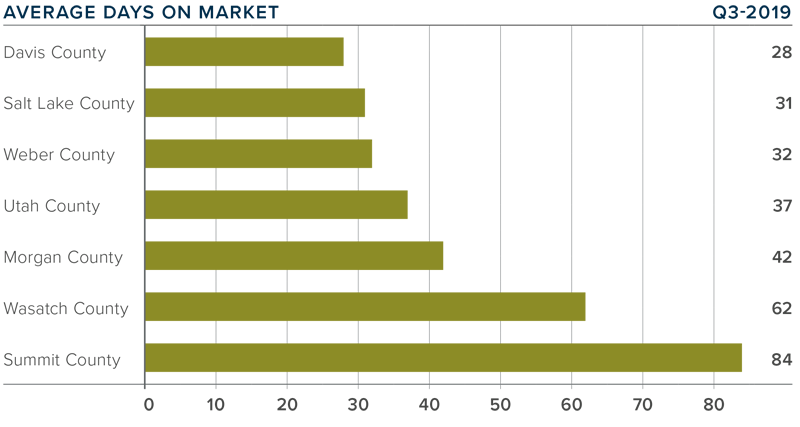
Homes sold fastest in Davis, Salt Lake, and Weber counties, and slowest in the expensive Summit County. All counties saw days-on-market rise compared to the third quarter of 2018.
During the third quarter of this year, it took an average of 45 days to sell a home in the region, down from 53 days in the second quarter.
The Utah economy is still outperforming almost all other states and this will continue to drive housing demand.
CONCLUSIONS
This speedometer reflects the state of the region’s real estate market using housing inventory, price gains, home sales, interest rates, and larger economic factors.
For the third quarter of 2019, I have moved the needle a little more in favor of sellers. Although the area has seen a modest increase in the number of homes for sale and days-on-market, prices, pending sales, and closed sales are higher, which certainly favors sellers.
ABOUT MATTHEW GARDNER
As Chief Economist for Windermere Real Estate, Matthew Gardner is responsible for analyzing and interpreting economic data and its impact on the real estate market on both a local and national level. Matthew has over 30 years of professional experience both in the U.S. and U.K.
In addition to his day-to-day responsibilities, Matthew sits on the Washington State Governors Council of Economic Advisors; chairs the Board of Trustees at the Washington Center for Real Estate Research at the University of Washington; and is an Advisory Board Member at the Runstad Center for Real Estate Studies at the University of Washington where he also lectures in real estate economics.
The following analysis of the Eastern Washington real estate market is provided by Windermere Real Estate Chief Economist Matthew Gardner. We hope that this information may assist you with making better-informed real estate decisions. For further information about the housing market in your area, please don’t hesitate to contact your Windermere agent.
ECONOMIC OVERVIEW
Washington State employment has softened slightly to an annual growth rate of 2%, which is still a respectable number compared to other West Coast states and the country as a whole. In all, I expect that Washington will continue to add jobs at a reasonable rate, but it’s clear that businesses are starting to feel the effects of the trade war with China and this is impacting hiring practices. My most recent economic forecast suggests that statewide job growth in 2019 will rise by 2.2%, with a total of 88,400 new jobs created.
The state unemployment rate last quarter was 4.6%, marginally higher that the 4.4% level of a year ago. The Eastern Washington market added 14,588 total jobs over the past 12 months, representing an annual growth rate of 3.1%. That said, and even as the region added jobs, the unemployment rate rose to 5.6% from 4.7% a year ago. This does not worry me though, as the county data is not seasonally adjusted, and the areas covered by this report tend to see unemployment rates rise as we approach the winter months.
HOME SALES
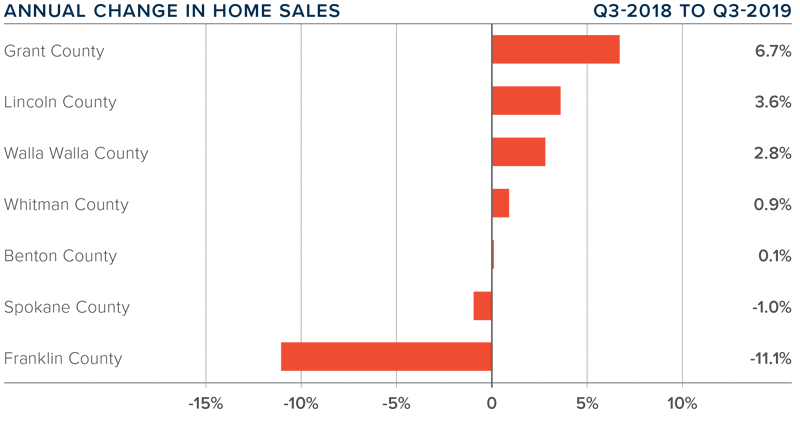
Home sales throughout Eastern Washington were down by a modest .5% compared to the same quarter in 2018, with a total of 4,176 closed sales.
Pending home sales in the region were 16% higher than second quarter, suggesting that fourth quarter closings will likely be higher.
The drop in home sales was driven by Franklin and Spokane counties, while all other counties covered in this report saw sales rise.
The average number of homes for sale in the quarter was 16.6% lower than a year ago, suggesting that the market remains very tight. I do not anticipate a significant increase in listings until next spring.
HOME PRICES
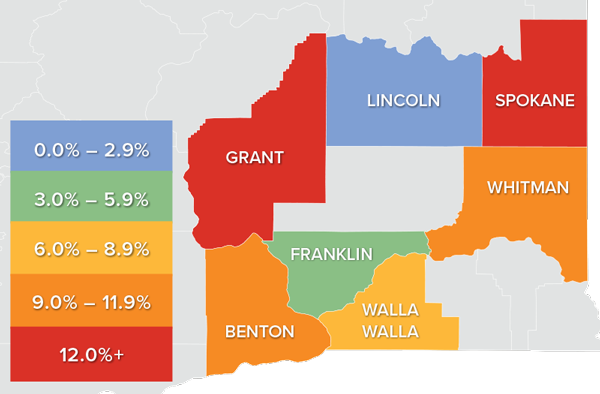
Year-over-year, the average home price in Eastern Washington rose by a significant 12.1% to $303,658. Prices were also 3.4% higher than in the second quarter.
As mentioned in the previous section, low inventory levels are pervasive and are likely the most significant hurdle to many home buyers. Low inventory continues to put upward pressure on prices.
Prices rose in all counties contained in this report, with Benton, Whitman, Grant, and Spokane counties showing double-digit price gains.
The takeaway is that average home-price growth in Eastern Washington remains well above the long-term average.
DAYS ON MARKET
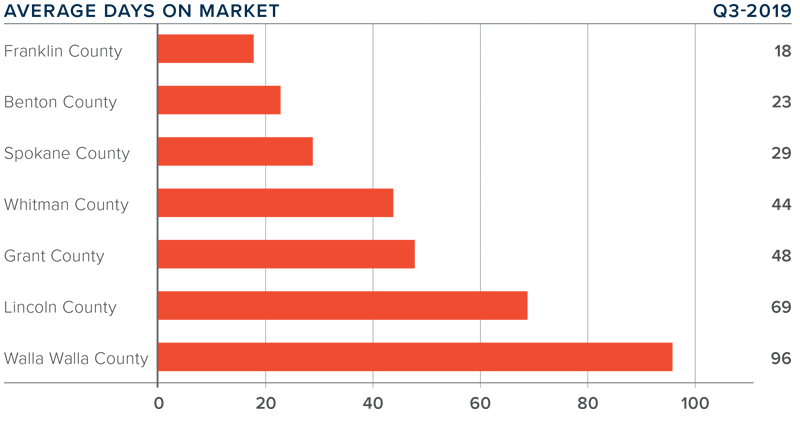
The average time it took to sell a home in Eastern Washington in the third quarter of 2019 was 47 days.
During the third quarter, it took the same number of days to sell a home in Eastern Washington as it did a year ago.
The regional market was split: it took longer to sell homes in Lincoln and Walla Walla counties, but days on market dropped in Grant, Spokane, Benton, Whitman, and Franklin counties.
It took five fewer days to sell a home in the third quarter than it did in the second quarter of this year.
CONCLUSIONS
This speedometer reflects the state of the region’s real estate market using housing inventory, price gains, home sales, interest rates, and larger economic factors.
Home sales are up and so are prices, which certainly favors sellers. However, mortgage rates remain remarkably competitive and this is allowing buyers to afford more house for their money. Inventory levels are still well below what I would like to see and, therefore, the Eastern Washington housing market remains very tight. As such, I am moving the needle just a little more in favor of home sellers.
ABOUT MATTHEW GARDNER
As Chief Economist for Windermere Real Estate, Matthew Gardner is responsible for analyzing and interpreting economic data and its impact on the real estate market on both a local and national level. Matthew has over 30 years of professional experience both in the U.S. and U.K.
In addition to his day-to-day responsibilities, Matthew sits on the Washington State Governors Council of Economic Advisors; chairs the Board of Trustees at the Washington Center for Real Estate Research at the University of Washington; and is an Advisory Board Member at the Runstad Center for Real Estate Studies at the University of Washington where he also lectures in real estate economics.
The following analysis of the Metro Denver & Northern Colorado real estate market is provided by Windermere Real Estate Chief Economist Matthew Gardner. We hope that this information may assist you with making better-informed real estate decisions. For further information about the housing market in your area, please don’t hesitate to contact your Windermere real estate agent.
ECONOMIC OVERVIEW
Colorado’s economy picked up, adding 64,900 new non-agricultural jobs over the past 12 months — a growth rate of 2.4%. Over the past three months, the state added an impressive 28,300 new jobs.
In August, the state unemployment rate was 2.8%, down from 3.4% a year ago. Unemployment rates in all the counties contained in this report were lower than a year ago. It is fair to say that all markets are now at full employment.
HOME SALES
In the third quarter of 2019, 17,562 homes sold. This is an increase of 5.1% compared to the third quarter of 2018 but 1.6% lower than the second quarter (which can be attributed to seasonality). Pending sales — a sign of future closings —rose 9.7%, suggesting that closings in the final quarter of 2019 are likely to show further improvement.
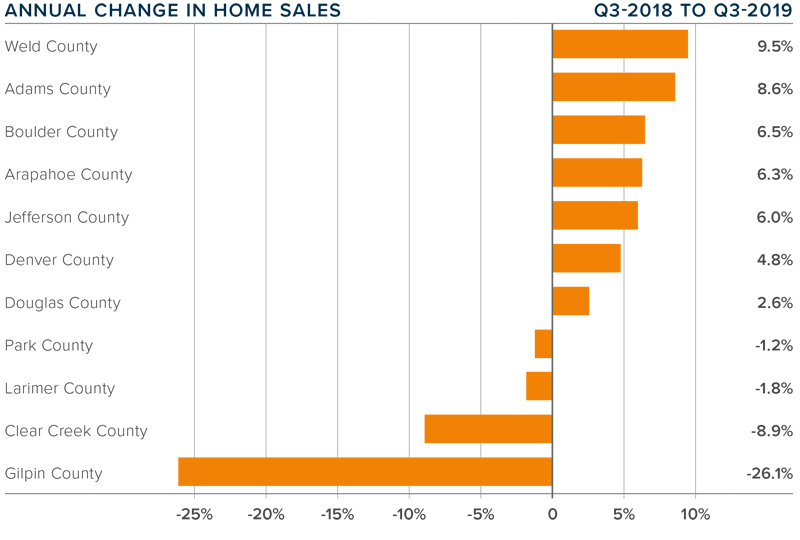
Seven counties contained in this report saw sales growth, while four saw sales activity drop. I am not concerned about this because all the markets that experienced slowing are relatively small and, therefore, subject to significant swings.
I was pleased to see an ongoing increase in the number of homes for sale (+16.9%), which means home buyers have more choice and feel less urgency.
Inventory levels are moving higher, and demand for housing appears to be quite strong. As I predicted last quarter, home sales rose in the third quarter compared to a year ago.
HOME PRICES
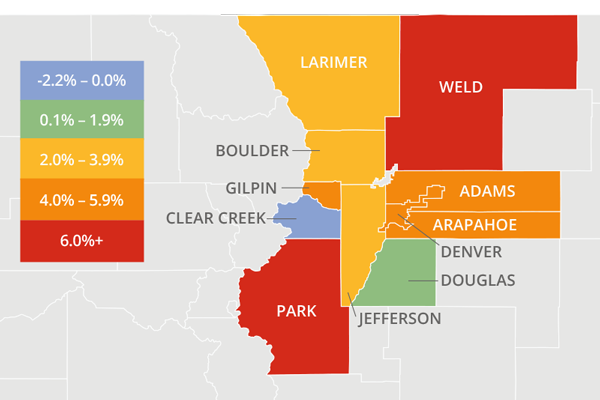
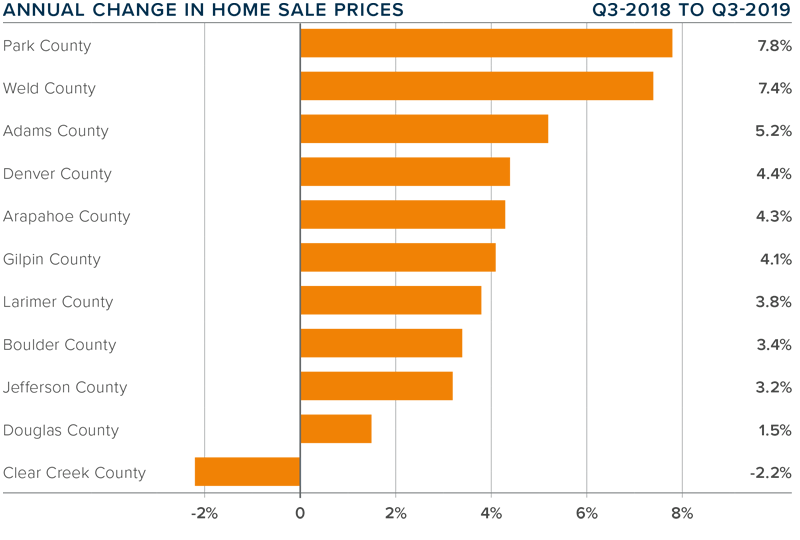
Home prices continue to trend higher, with the average home price in the region rising 3.8% year-over-year to $477,776.
Interest rates are at very competitive levels and are likely to remain below 4% for the balance of the year. As a result, prices will continue to rise but at a more modest pace.
Appreciation was again strongest in Park County, where prices rose 7.8%. We also saw strong growth in Weld County, which rose 7.4%. Home prices dropped in Clear Creek County, but, as mentioned earlier, this is a small market so I don’t believe this is indicative of an ongoing trend.
Affordability remains an issue in many Colorado markets and this will act as a modest headwind to ongoing price growth.
DAYS ON MARKET
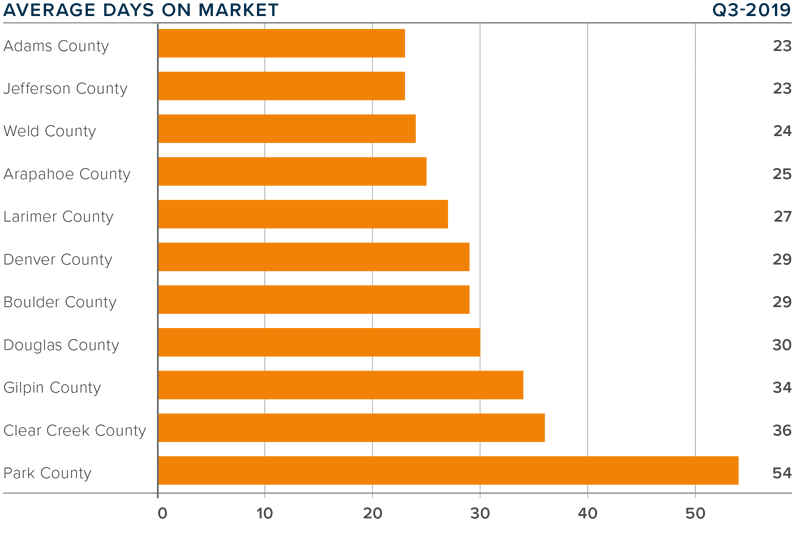
The average number of days it took to sell a home in the markets contained in this report rose seven days compared to the third quarter of 2018.
The amount of time it took to sell a home rose in all counties compared to the third quarter of 2018.
It took an average of 30 days to sell a home in the region — an increase of 1 day compared to the second quarter of this year.
The Colorado housing market is still performing well, and the modest increase in the length of time it took to sell a home is a function of greater choice in homes for sale and buyers taking a little longer to choose a home.
CONCLUSIONS
This speedometer reflects the state of the region’s real estate market using housing inventory, price gains, home sales, interest rates, and larger economic factors.
For the third quarter of 2019, I continue the trend I started last summer and have moved the needle a little more in favor of buyers. I continue to closely monitor listing activity to see if we get any major bumps above the traditional increase because that may further slow home price growth. However, the trend for 2019 will continue to be a move toward a more balanced market.
ABOUT MATTHEW GARDNER
As Chief Economist for Windermere Real Estate, Matthew Gardner is responsible for analyzing and interpreting economic data and its impact on the real estate market on both a local and national level. Matthew has over 30 years of professional experience both in the U.S. and U.K.
In addition to his day-to-day responsibilities, Matthew sits on the Washington State Governors Council of Economic Advisors; chairs the Board of Trustees at the Washington Center for Real Estate Research at the University of Washington; and is an Advisory Board Member at the Runstad Center for Real Estate Studies at the University of Washington where he also lectures in real estate economics.
The following analysis of the Southern California real estate market is provided by Windermere Real Estate Chief Economist Matthew Gardner. We hope that this information may assist you with making better-informed real estate decisions. For further information about the housing market in your area, please don’t hesitate to contact your Windermere agent.
ECONOMIC OVERVIEW
The counties covered by this report — Los Angeles, San Diego, San Bernardino, Orange, and Riverside — saw total employment rise by 21,700 jobs (+0.2%) year-over-year, reversing the drop in total employment in the second quarter. Job growth was a mixed bag among the counties though. There was growth in San Diego, Riverside, and San Bernardino counties but modest drops in Los Angeles and Orange counties.
Over the past year, the unemployment rate in Southern California dropped from 4.4% to 4.2%, with total unemployment down year-over-year by 21,700 persons. In all, this was a pretty good report and demonstrates a return to normalized growth rates after the state re benchmarking, which led the second quarter numbers to appear worse than they really were.
HOME SALES
There were 49,214 home sales in the third quarter. This was an increase of 3.5% from the same period in 2018 but 1.6% lower than in the second quarter of this year.
Pending home sales (an indicator of future closings) rose 10.3% compared to a year ago, suggesting that total sales in the fourth quarter are likely to be an improvement over current levels.
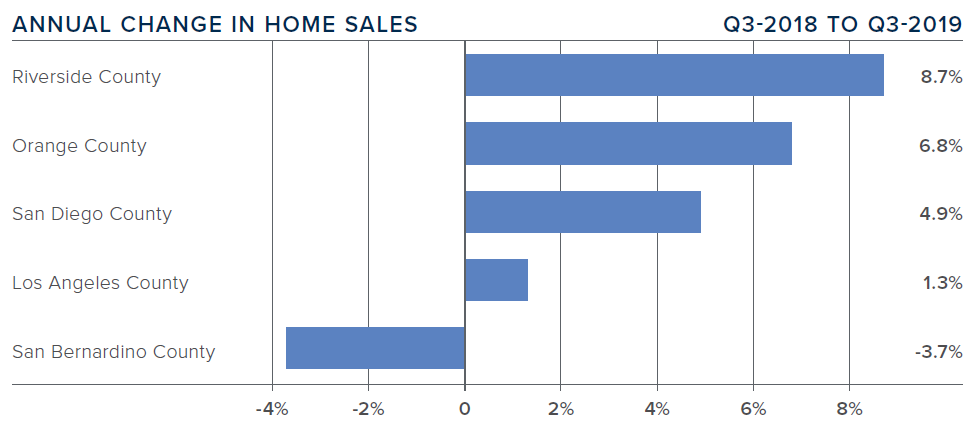
Third-quarter home sales rose in all counties other than San Bernardino. There was also a significant growth in the relatively affordable Riverside County (+8.7%).
There was an average of 39,208 active listings in the third quarter — down 5.9% from a year ago and 2.4% lower than in the second quarter of the year. The market is tighter than I would like but there is clearly demand from buyers.
HOME PRICES
Year-over-year, average home prices in the region were modestly higher (+1.2%). Compared to the second quarter of this year, they were a mere 0.5% higher.
Affordability concerns, combined with slowing job growth, suggest that price growth is likely to continue to taper in many Southern California markets.
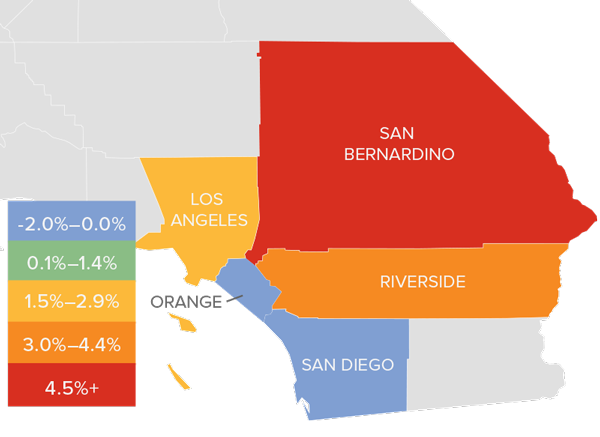
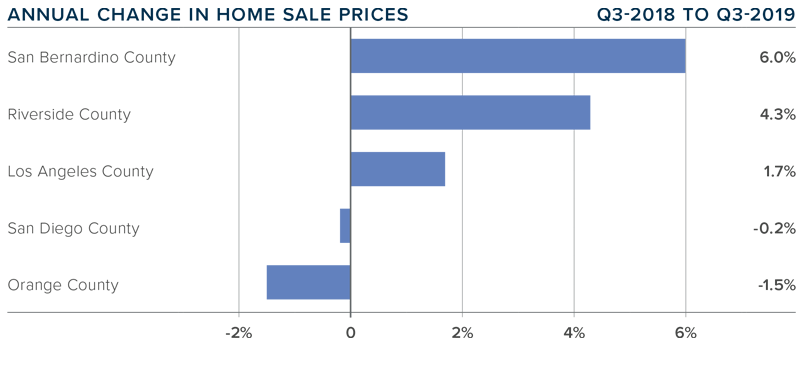
Continuing the trend we saw in the second quarter of this year, price growth in the third quarter was mixed. Sale prices were higher in three counties but modestly lower in two. San Bernardino County took over the number one spot for price growth (+6%). Riverside County also saw significant price gains. Sale prices dropped in San Diego and Orange counties, but this is not of great concern at the present time.
On a year-over-year basis, I still expect home prices to continue rising, but this is primarily due to very low mortgage rates.
DAYS ON MARKET
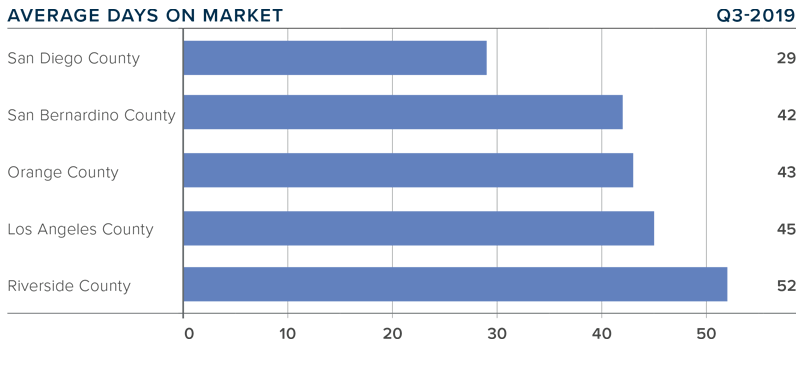
The average time it took to sell a home in the region was 42 days, which is 4 days more than a year ago, but 2 days less than last quarter.
All markets saw the time it took to sell a house increase compared to the third quarter of 2018.
Homes in San Diego County continue to sell at a faster rate than other markets in the region. In the second quarter, it took an average of 29 days to sell a home. This is only 2 more days than it took a year ago.
Market time is increasing, which may concern some, but it is simply a move back to a more balanced market.
CONCLUSIONS
The speedometer reflects the state of the region’s real estate market using housing inventory, price gains, home sales, interest rates, and larger economic factors.
Inventory levels and affordability concerns in many markets continue to have a slowing effect on price growth. However, pending sales are higher which suggests that the market is still buoyant, thanks in part to competitive mortgage rates.
Given the drop in the number of homes for sale, I have moved the needle a little more toward sellers.
ABOUT MATTHEW GARDNER
As Chief Economist for Windermere Real Estate, Matthew Gardner is responsible for analyzing and interpreting economic data and its impact on the real estate market on both a local and national level. Matthew has over 30 years of professional experience both in the U.S. and U.K.
In addition to his day-to-day responsibilities, Matthew sits on the Washington State Governors Council of Economic Advisors; chairs the Board of Trustees at the Washington Center for Real Estate Research at the University of Washington; and is an Advisory Board Member at the Runstad Center for Real Estate Studies at the University of Washington where he also lectures in real estate economics.
Owning a home comes with its rewards — it’s an investment, a cozy haven to kick-up your feet after a long day of work, and a welcoming place to bring family and friends together. Although all of this makes homeownership fulfilling, owning a home also opens the door for unexpected (but necessary) expenses.
If you’ve suddenly been hit with a home improvement project that’s pinching your budget, like a roofing issue or heater malfunction, a personal loan might be an option to help cover the cost.
What is a personal loan?
A personal loan is an installment loan that’s typically issued by a bank, credit union or online lender. According to the Federal Reserve, the average interest rate on a two-year personal loan is 10.22% but varies depending on your credit score and other criteria. Some lenders offer repayment terms anywhere from 12 months to five years.
A benefit of using a personal loan for emergency home improvement projects is that the approval process is generally quick so you can address urgent home repairs sooner. Some online lenders can run a credit check, approve your application and send funds your way with a couple of days. The approval process for banks and credit unions, on the other hand, can take anywhere from a couple of days to a couple of weeks, if the lender needs additional information.
How to find a personal loan
If you’ve decided that a personal loan makes sense to fund your next home project, make sure you’re aware of these next steps.
1. Assess your budget
The last thing you need is taking out a personal loan only to realize after the fact that you can’t afford to repay it. Calculate how much you realistically need for your home improvement project, giving yourself a reasonable buffer for unforeseen repair expenses (e.g. permit fees, price changes for a specific material, etc.)
Then, tally your monthly income and financial obligations to ensure you still have enough cash on hand to keep the lights on and make monthly installments toward your loan. Using a spreadsheet or budgeting app can help you track these numbers easily.
2. Know your credit score
Generally, you need a good credit score to get approved for a personal loan. Your credit score is one of the key factors that lenders use to determine whether your application is approved, and a higher credit score results in a lower interest rate offer.
Check your credit score with the three credit bureaus to ensure there isn’t an error or suspicious activity that might inadvertently lower your credit score. For a free credit report, go to AnnualCreditReport.com to see where your credit stands before moving forward in the process.
3. Compare rates and terms
When you’ve confirmed that you have a good credit score that can get you competitive interest rates, it’s tempting to accept a loan from the first lender that approves you. But like other major purchases, it’s important to shop around.
Compare interest rates, annual percentage rates (APR), and term durations available, and read the fine print for any conditions or fees that might offset any benefits.
To start, try reaching out to your existing financial institution first to see what they can offer; sometimes credit unions, in particular, offer rate incentives for loyal members. Also, consider using a personal loan aggregator website to compare offers from multiple online lenders at once (just do your due diligence to ensure the site is legitimate).
4. Submit an application
If you’re ready to submit an application, you can either complete a form online or apply in-person, depending on your lender. Although all lenders require different information to process a loan application, some common information to prepare ahead of time include:
Personal information
Income
Employment information
Reason for the loan
Amount you want to borrow
To minimize any delays on your end, it’s helpful to prepare copies of verification documents, such as a driver’s license, proof of address like a utility statement, information about your home and pay stubs. Your prospective lender will likely reach out to you if they need any other information to make a decision.
Although it’s always best to have emergency savings set aside for a sudden home improvement project, turning to a personal loan is a useful option when you’re pressed for funds and time. As urgent as your project might feel, however, always take the time to do your research to ensure you’re making the right move for your situation.
The following analysis of the Western Washington real estate market is provided by Windermere Real Estate Chief Economist, Matthew Gardner. We hope that this information may assist you with making better-informed real estate decisions. For further information about the housing market in your area, please don’t hesitate to contact your Windermere agent.
ECONOMIC OVERVIEW
Washington State employment has softened slightly to an annual growth rate of 2%, which is still a respectable number compared to other West Coast states and the country as a whole. In all, I expect that Washington will continue to add jobs at a reasonable rate though it is clear that businesses are starting to feel the effects of the trade war with China and this is impacting hiring practices. The state unemployment rate was 4.6%, marginally higher than the 4.4% level of a year ago. My most recent economic forecast suggests that statewide job growth in 2019 will rise by 2.2%, with a total of 88,400 new jobs created.
HOME SALES
There were 22,685 home sales during the third quarter of 2019, representing a slight increase of 0.8% from the same period in 2018 and essentially at the same level as in the second quarter.
Listing activity — which rose substantially from the middle of last year — appears to have settled down. This is likely to slow sales as there is less choice in the market.
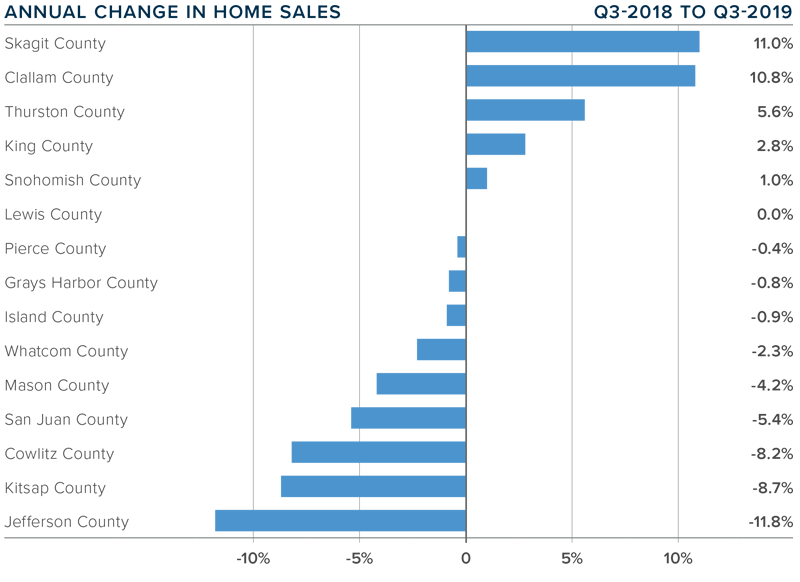
Compared to the third quarter of 2018, sales rose in five counties, remained static in one, and dropped in nine. The greatest growth was in Skagit and Clallam counties. Jefferson, Kitsap, and Cowlitz counties experienced significant declines.
The average number of homes for sale rose 11% between the second and third quarters. However, inventory is 14% lower than in the same quarter of 2018. In fact, no county contained in this report had more homes for sale in the third quarter than a year ago.
HOME PRICES
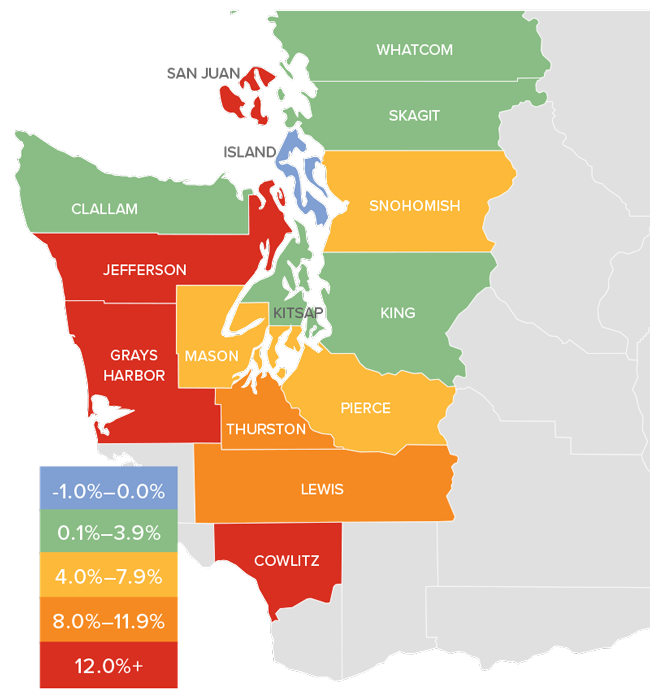
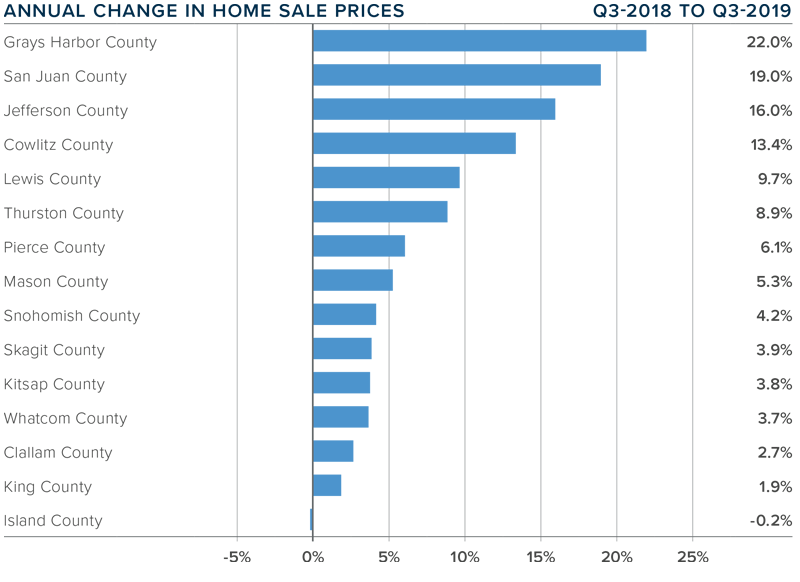
Home price growth in Western Washington notched a little higher in the third quarter, with average prices 4.2% higher than a year ago. The average sales price in Western Washington was $523,016. It is worth noting, though, that prices were down 3.3% compared to the second quarter of this year.
Home prices were higher in every county except Island, though the decline there was very small.
When compared to the same period a year ago, price growth was strongest in Grays Harbor County, where home prices were up 22%. San Juan, Jefferson, and Cowlitz counties also saw double-digit price increases.
Affordability issues are driving buyers further out which is resulting in above-average price growth in outlying markets. I expect home prices to continue appreciating as we move through 2020, but the pace of growth will continue to slow.
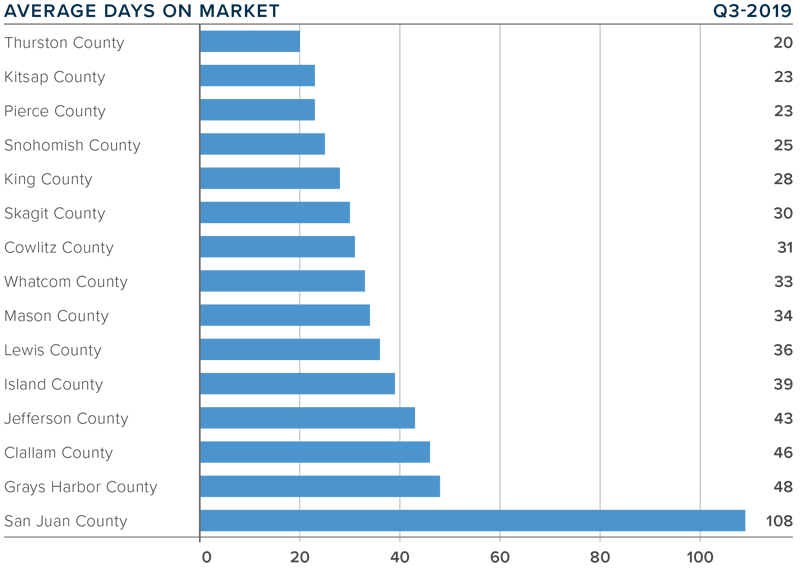
DAYS ON MARKET
The average number of days it took to sell a home dropped one day when compared to the third quarter of 2018.
Thurston County was the tightest market in Western Washington, with homes taking an average of only 20 days to sell. There were six counties where the length of time it took to sell a home dropped compared to the same period a year ago. Market time rose in six counties, while two counties were unchanged.
Across the entire region, it took an average of 38 days to sell a home in the third quarter. This was down 3 days compared to the second quarter of this year.
Market time remains below the long-term average across the region and this trend is likely to continue until more inventory comes to market, which I do not expect will happen until next spring.
CONCLUSIONS
This speedometer reflects the state of the region’s real estate market using housing inventory, price gains, home sales, interest rates, and larger economic factors. I am leaving the needle in the same position as the first and second quarters, as demand appears to still be strong.
The market continues to benefit from low mortgage rates. The average 30-year fixed rates is currently around 3.6% and is unlikely to rise significantly anytime soon. Even as borrowing costs remain very competitive, it’s clear buyers are not necessarily jumping at any home that comes on the market. Although it’s still a sellers’ market, buyers have become increasingly price-conscious which is reflected in slowing home price growth.
ABOUT MATTHEW GARDNER
As Chief Economist for Windermere Real Estate, Matthew Gardner is responsible for analyzing and interpreting economic data and its impact on the real estate market on both a local and national level. Matthew has over 30 years of professional experience both in the U.S. and U.K.
In addition to his day-to-day responsibilities, Matthew sits on the Washington State Governors Council of Economic Advisors; chairs the Board of Trustees at the Washington Center for Real Estate Research at the University of Washington; and is an Advisory Board Member at the Runstad Center for Real Estate Studies at the University of Washington where he also lectures in real estate economics.
Appraisals are used as a reliable, independent valuation of a tract of land and the structure on it, whether it’s a house or a skyscraper. Designed to protect buyers, sellers, and lending institutions, appraisals are an important part of the buying/selling process.
Below, you will find information about the appraisal process, what goes into them, their benefits and some tips on how to help make an appraisal go smoothly and efficiently.
Your Beginner’s Guide to Home Appraisals
Appraised Value vs. Market Value
The appraiser’s value is determined by using a combination of factors such as comparative market analyses and their inspection of the property to determine if the listing price is typical for the area.
Market value, on the other hand, is what a buyer is willing to pay for a home or what homes of comparable value are selling for.
If you are in the process of setting the price of your home, you can gain some peace-of-mind by consulting an independent appraiser. Show them comparative values for your neighborhood, relevant documents, and give them a tour of your home, just as you would show it to a prospective buyer.
What information goes into an appraisal?
Professional appraisers consult a range of information sources, including multiple listing services, county tax assessor records, county courthouse records, and appraisal data records, in addition to talking to local real estate professionals.
They also conduct an inspection. Typically, an appraiser’s inspection focuses on:
The condition of the property and home, inside and out.
The home’s layout and features.
Home updates.
Overall quality of construction.
Estimate of the home’s square footage (the gross living area “GLA”; garages and unfinished basements are estimated separately).
Permanent fixtures (for example, in-ground pools, as opposed to above-ground pools).
After the inspection, the appraiser of a typical single-family home will create their report including their professional opinion on what the price of the home should be.
You might hear the lender ask for two reports, the “Sales Comparison Approach” and the “Cost Approach.” These two approaches use different methodologies to find the appropriate value of the home, and help the lender confirm the home’s price.
Who pays and how long does it take?
The buyer usually pays for the appraisal unless they have negotiated otherwise. Depending on the lender, the appraisal may be paid in advance or incorporated into the application fee; some are due on delivery and some are billed at closing. Typical costs range from $275-$600, but this can vary from region to region.
An inspection usually takes anywhere from 15 minutes to several hours, depending on the size and complexity of your property. In addition, the appraiser spends time pulling up county records for the values of the houses around you. A full report is sent to your loan officer, real estate agent, and/or lender in about a week.
If you are the seller, you won’t get a copy of an appraisal ordered by a buyer. Under the Equal Credit Opportunity Act, however, the buyer has the right to get a copy of the appraisal if they request it. Typically, the requested appraisal is provided at closing.
What if the appraisal is too low?
A low appraisal can present a problem when there’s a large difference between what you’ve agreed to pay and the appraisal price.
Usually, the seller’s agents and the buyer’s agent will respond by looking for recent sold and pending listings of comparable homes. Sometimes this can influence the appraisal. If the final appraisal is well below what you have agreed to pay, you can re-negotiate the contract or cancel it.
Where do you find a qualified appraiser?
Your bank or lending institution will find and hire an appraiser; Federal regulatory guidelines do not allow borrowers to order and provide an appraisal to a bank for lending purposes. If you want an appraisal for your own personal reasons and not to secure a mortgage or buy a homeowner’s insurance policy, you can do the hiring yourself. You can contact your lending institution and they can recommend qualified appraisers and you can choose one yourself or you can call your local Windermere Real Estate agent and they can make a recommendation for you. Once you have the name of some appraisers you can verify their status on the Federal Appraisal Subcommittee website.
Tips for Hassle-Free Appraisals:
To ensure the appraisal process is smooth and efficient, provide your appraiser with the information and documents he or she needs to get the job done. The documents you will need include:
A brief explanation of why you’re getting an appraisal
The date you’d like your appraisal to be completed
A copy of your deed, survey, purchase agreement, or other papers that pertain to the property
A sketch of the property with the property’s dimensions. These are usually available online from the county assessors.
If you have a mortgage, provide the information about your lender, the year you got your mortgage, the amount, the type of mortgage (FHA, VA, etc.), your interest rate, and any additional financing you have.
A copy of your current real estate tax bill, statement of special assessments, balance owing and on what (for example, sewer, water)
Tell your appraiser if your property is listed for sale and if so, your asking price and listing agency.
If it’s a multiple offer situation, provide the appraiser with the other offers to prove the demand for the home.
Any personal property that is included in the sale, like appliances and other fixtures.
If you’re selling an income-producing property, a breakdown of income and expenses for the last year or two and a copy of leases.
A copy of the original house plans and specifications.
A list of recent improvements and their costs.
Any other information you feel may be relevant.
By doing your homework, compiling the information your appraiser needs, and providing it at the beginning of the process, you can minimize unnecessary delays. To connect with an experienced Windermere Real Estate agent, get started by clicking the button below.
Podcasts are a growing medium as listeners search for new sources of entertainment and information. In 2018 there were about 550,000 podcasts, in 2019 there are more than 750,000. Listeners are growing too, an estimated 20 million more people in the U.S. are listening to podcasts this year as compared to2018.
This growth in audio entertainment inspired us to pull together a few of our favorite real estate podcasts. Whether you’re interested in investing in real estate, looking to make a move to a new home, or just want to know what’s happening in the market, here are our recommendations:
For Investors:
The Millennial Real Estate Investor
Find your niches in Real Estate with Dan Mackin and Ben Welch, who host experts with stories about their investing successes and challenges. Learn from the experienced guests on this show the many ways to get into investing and succeed at it.
Listen to Millennial Real Estate Investor wherever you get your podcasts (Icon linked):
Cash Flow Connection
If you’re drawn to the commercial side of real estate, Cash Flow Connections with host, Hunter Thompson, is an informative podcast that interviews leading investors, sponsors and managers. Learn about all the aspects of commercial real estate from all viewpoints to find the right fit for you.
Windermere’s Chief Economist, Matthew Gardner, was just interviewed about the state of the real estate market, and what to expect in the next recession (hint: it won’t be driven by housing). You can listen to that episode here.
Listen to Cash Flow Connection wherever you get your podcasts:
For Those About to Move
Windermere Home and Wealth
Host Brian Bushlach interviews business owners, local guides, and Windermere agents in each episode about different areas throughout the Western U.S. and what they have to offer to those who live or visit there. Learn about what’s attracting newcomers to the area, and what the local real estate market looks like. This podcast is sure to stir your wanderlust.
Listen to Windermere Home and Wealth wherever you get your podcasts:
Finding Home with 106.1 KISS FM
Join first-time home buyers, and radio personalities, Anthony and Carla Marie from 106.1 KISS FM, as they walk through the home buying journey with their Windermere agents. This podcast is both entertaining and informative as they ask the questions you’ve always wanted answers to. With their knowledgeable real estate agents by their sides, they’re taking you along as they get approved, look for houses, and even put an offer on a home.
Listen to Finding Home on iHeartRadio:
Stay Informed
Housing Developments
Hosted by National Association of Home Builders CEO Jerry Howard and Chief Lobbyist Jim Tobin, this podcast covers updates in the housing market and building industry across the nation. Learn from experts in the field about recent laws and the news of the industry.
Listen to Housing Developments wherever you get your podcasts:
Real Estate News with Kathy Fettke
This podcast is aimed at real estate investors who want to stay curren on the latest real estate news. Presented in bite sized episodes, listeners can learn about laws, regulations, and economic events that affect real estate and their local market.
As the days shorten, you can mitigate many mid-winter headaches with some preemptive prep. Proper weatherizing can help protect your home from preventable damage, save money on energy costs, and, most importantly, keep you and your loved ones safe and warm throughout the winter season. Here is a useful checklist to manage your weatherization project. Setting aside some time on a couple of weekend days should be more than enough to knock this out:
Cracks & Leaks
Examine your entire house for any cracks and leaks, from your roof to your baseboards, to your basement and foundation. With unpredictable winter weather, these cracks and leaks are how the outside gets in, causing cold drafts and water damage.
Luckily, most cracks don’t require a professional to handle it. Depending on your house type and age, it’s likely you’ll be able to do it yourself with supplies from your local hardware store.
Windows & Doors:
Gaps and breaks in windows and doors is another way to let the winter in your home, and they can let heat escape, raising your heat bill throughout the season.
Make sure seals are tight and no leaks exist. If you have storm windows, make sure you put them on before the cold season begins. Additionally, add weather-strips and or a door sweep to prevent drafts and keep the heat in.
Rain Gutters:
Clean your rain gutters of any debris. In colder climates, the buildup will cause gutters to freeze with ice, crack and then leak.
Once you have removed the residue from the drains, test them by running hose water to make sure cracks and leaks have not already formed. Even in warmer locales, the buildup can put undue stress on your roof and home.
Pipes:
Protecting your pipes from freezing should be your number one priority this winter. A burst pipe can quickly become a disaster in any home.
Remember to turn off your exterior water source and take in your hose. Internally, wrapping your pipes is a recommended precaution to take.
Heating System:
Annual checks are vital in avoiding dangers such as house fires. Replace filters if you use a furnace and clear out any vents and ducts that carry heat through them. If you have baseboard heat, wipe them of dust and remove any debris that might catch fire.
Fireplace & Wood Burning Stoves:
Make sure to have chimneys and air vents cleaned early in the season if you are planning on warming your home with a wood-burning source. When your fireplace is not in use make sure to close the damper, some resources estimate an open damper can increase energy consumption by as much as 30%, increasing your bill about $200.
Outside:
Bring your patio furniture inside or cover it for the winter. Don’t forget other, smaller items such as your tools, including the hose and planting pots. Clear out any piles around the side of your house, checking for cracks and holes in your home and foundation as you go so to avoid providing shelter for unwelcome guests over the cold season.
If your property has large trees check for loose branches and call someone to trim back any limbs that may fall in your yard, on your roof or even damage a window.
Emergency Kit:
Lastly, make sure your emergency kit is up to date with provisions, batteries, fresh water, food for animals, entertainment for kids – especially if you live in an area prone to power outages.

 Facebook
 X
X
 Pinterest
 Copy Link


 Windermere offices are proud to host events in their communities, like the ones mentioned above. These generous donations to the Windermere Foundation further our mission to support low-income and homeless families in the areas where we live and work. If you’d like to help support programs in your community, please click the Donate button.

 This speedometer reflects the state of the region’s real estate market using housing inventory, price gains, home sales, interest rates, and larger economic factors.
 As Chief Economist for Windermere Real Estate, Matthew Gardner is responsible for analyzing and interpreting economic data and its impact on the real estate market on both a local and national level. Matthew has over 30 years of professional experience both in the U.S. and U.K.
 Year-over-year, the average home price in Eastern Washington rose by a significant 12.1% to $303,658. Prices were also 3.4% higher than in the second quarter.
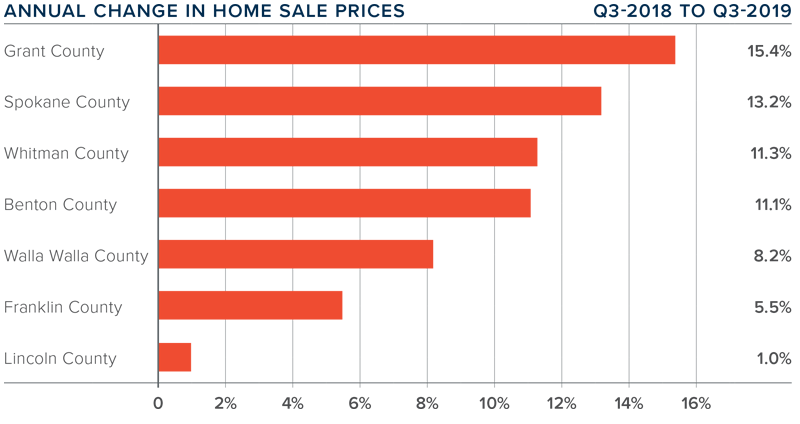
 This speedometer reflects the state of the region’s real estate market using housing inventory, price gains, home sales, interest rates, and larger economic factors.
 As Chief Economist for Windermere Real Estate, Matthew Gardner is responsible for analyzing and interpreting economic data and its impact on the real estate market on both a local and national level. Matthew has over 30 years of professional experience both in the U.S. and U.K.
 This speedometer reflects the state of the region’s real estate market using housing inventory, price gains, home sales, interest rates, and larger economic factors.
 The speedometer reflects the state of the region’s real estate market using housing inventory, price gains, home sales, interest rates, and larger economic factors.

 This speedometer reflects the state of the region’s real estate market using housing inventory, price gains, home sales, interest rates, and larger economic factors. I am leaving the needle in the same position as the first and second quarters, as demand appears to still be strong.


")


