
 Facebook
 X
X
 Pinterest
 Copy Link
Q3 2023 Idaho Real Estate Market Update

The following analysis of select counties of the Idaho real estate market is provided by Windermere Real Estate. We hope that this information may assist you with making better-informed real estate decisions. For further information about the housing market in your area, please don’t hesitate to contact your Windermere Real Estate agent.
Regional Economic Overview
The annual pace of employment growth in the state continues to slow. However, the addition of 22,400 new jobs since the third quarter of 2022 represents an impressive 2.7% growth rate and is well above the national rate of 2.1%. While I expect the pace of job growth to continue to cool, jobs will still be added for the balance of the year. My current forecast calls for statewide employment to increase 2.5% in 2023 and 1.3% in 2024.
With the exception of Lewiston, where employment levels were static, all of Idaho’s metro areas had solid year-over-year nonfarm job gains. Idaho Falls saw the greatest increase at 4.2%, followed by Pocatello (+3.3%), Coeur d’Alene (+3%), Boise (+2.7%), and Twin Falls (2.6%).
The state unemployment rate was a healthy 3%, which was marginally above 2.8% in the third quarter of 2022. Regionally, the lowest jobless rate was in Idaho Falls at 2.7%. Boise’s unemployment rate was 3.5%. The highest rate was in Coeur d’Alene, where 4.5% of the workforce was actively looking for work.
Idaho Home Sales
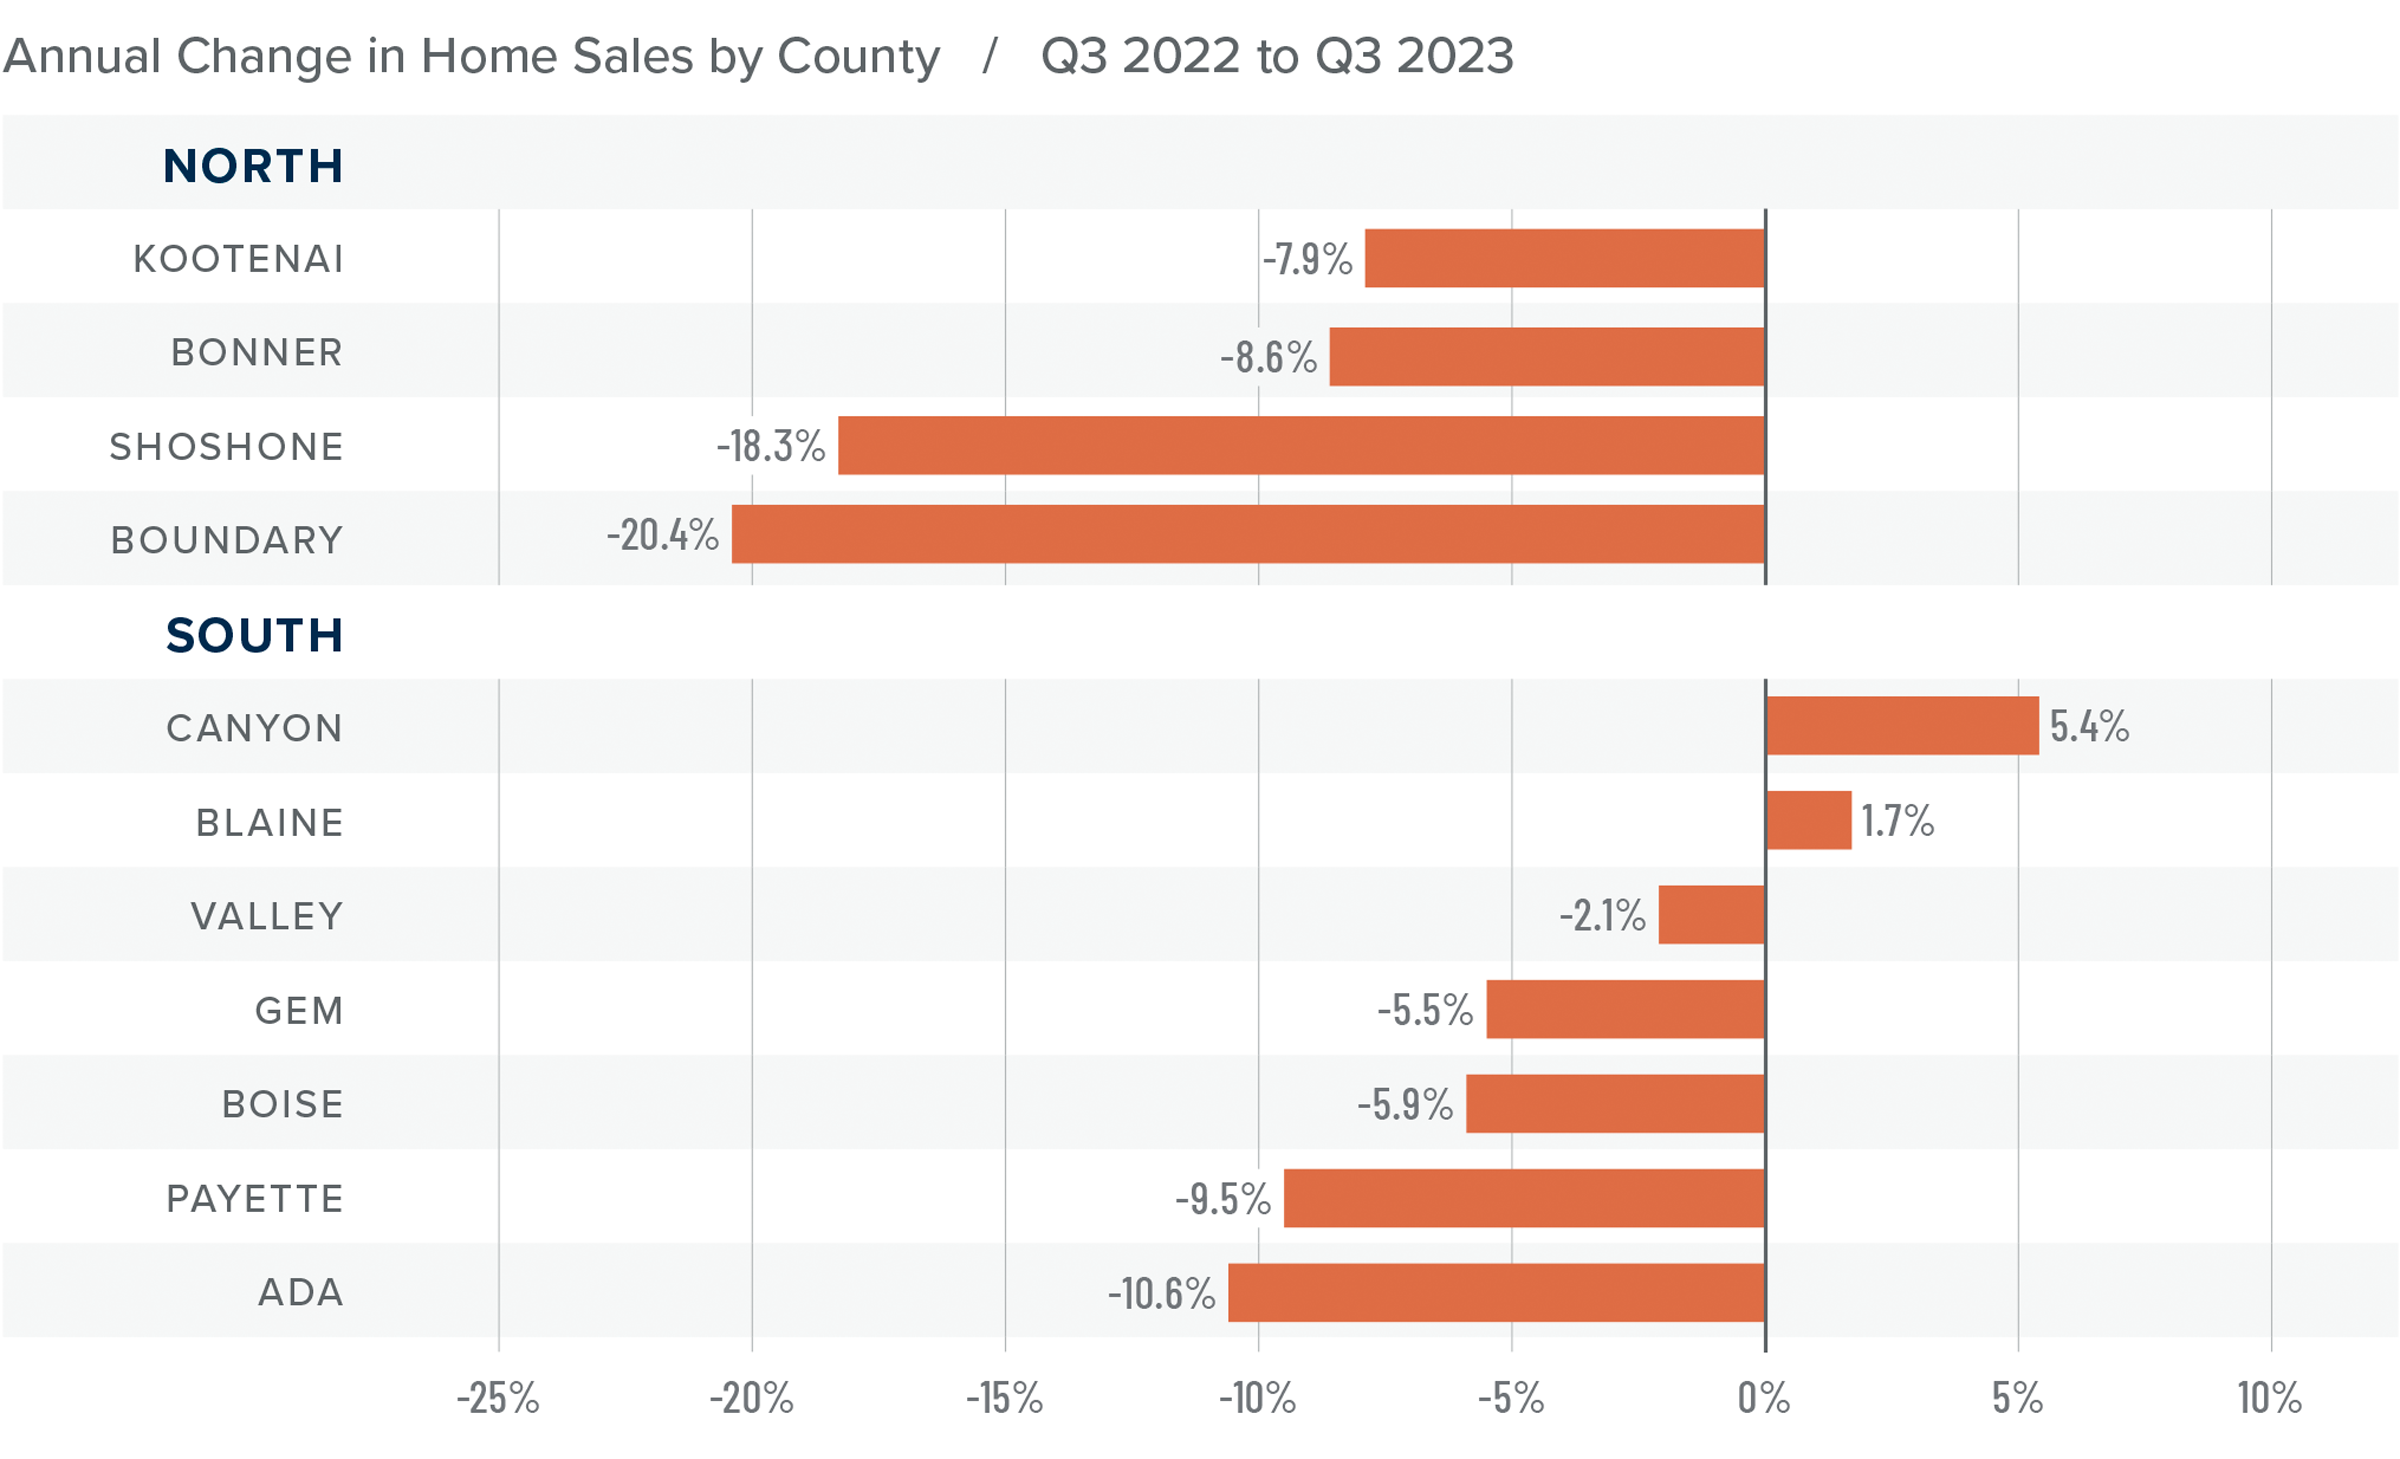
❱ In the third quarter of 2023, 4,945 homes sold, which was a drop of 6.2% from the third quarter of 2022 and 2.7% lower than in the second quarter of this year.
❱ Listing activity was up 11.3% from the second quarter of the year, which appears to have resulted in rising sales in most market areas.
❱ Relative to the same quarter in 2022, sales fell in all the northern counties covered by this report and in every county other than Canyon and Blaine in the Southern Idaho markets. However, compared to the second quarter of this year, sales rose in all markets other than Boundary County in Northern Idaho and Canyon, Gem, and Ada counties in the southern part of the state.
❱ Pending sales in the third quarter were lower than in the second quarter of 2023, suggesting that sales may slow in the final quarter of the year.
Idaho Home Prices
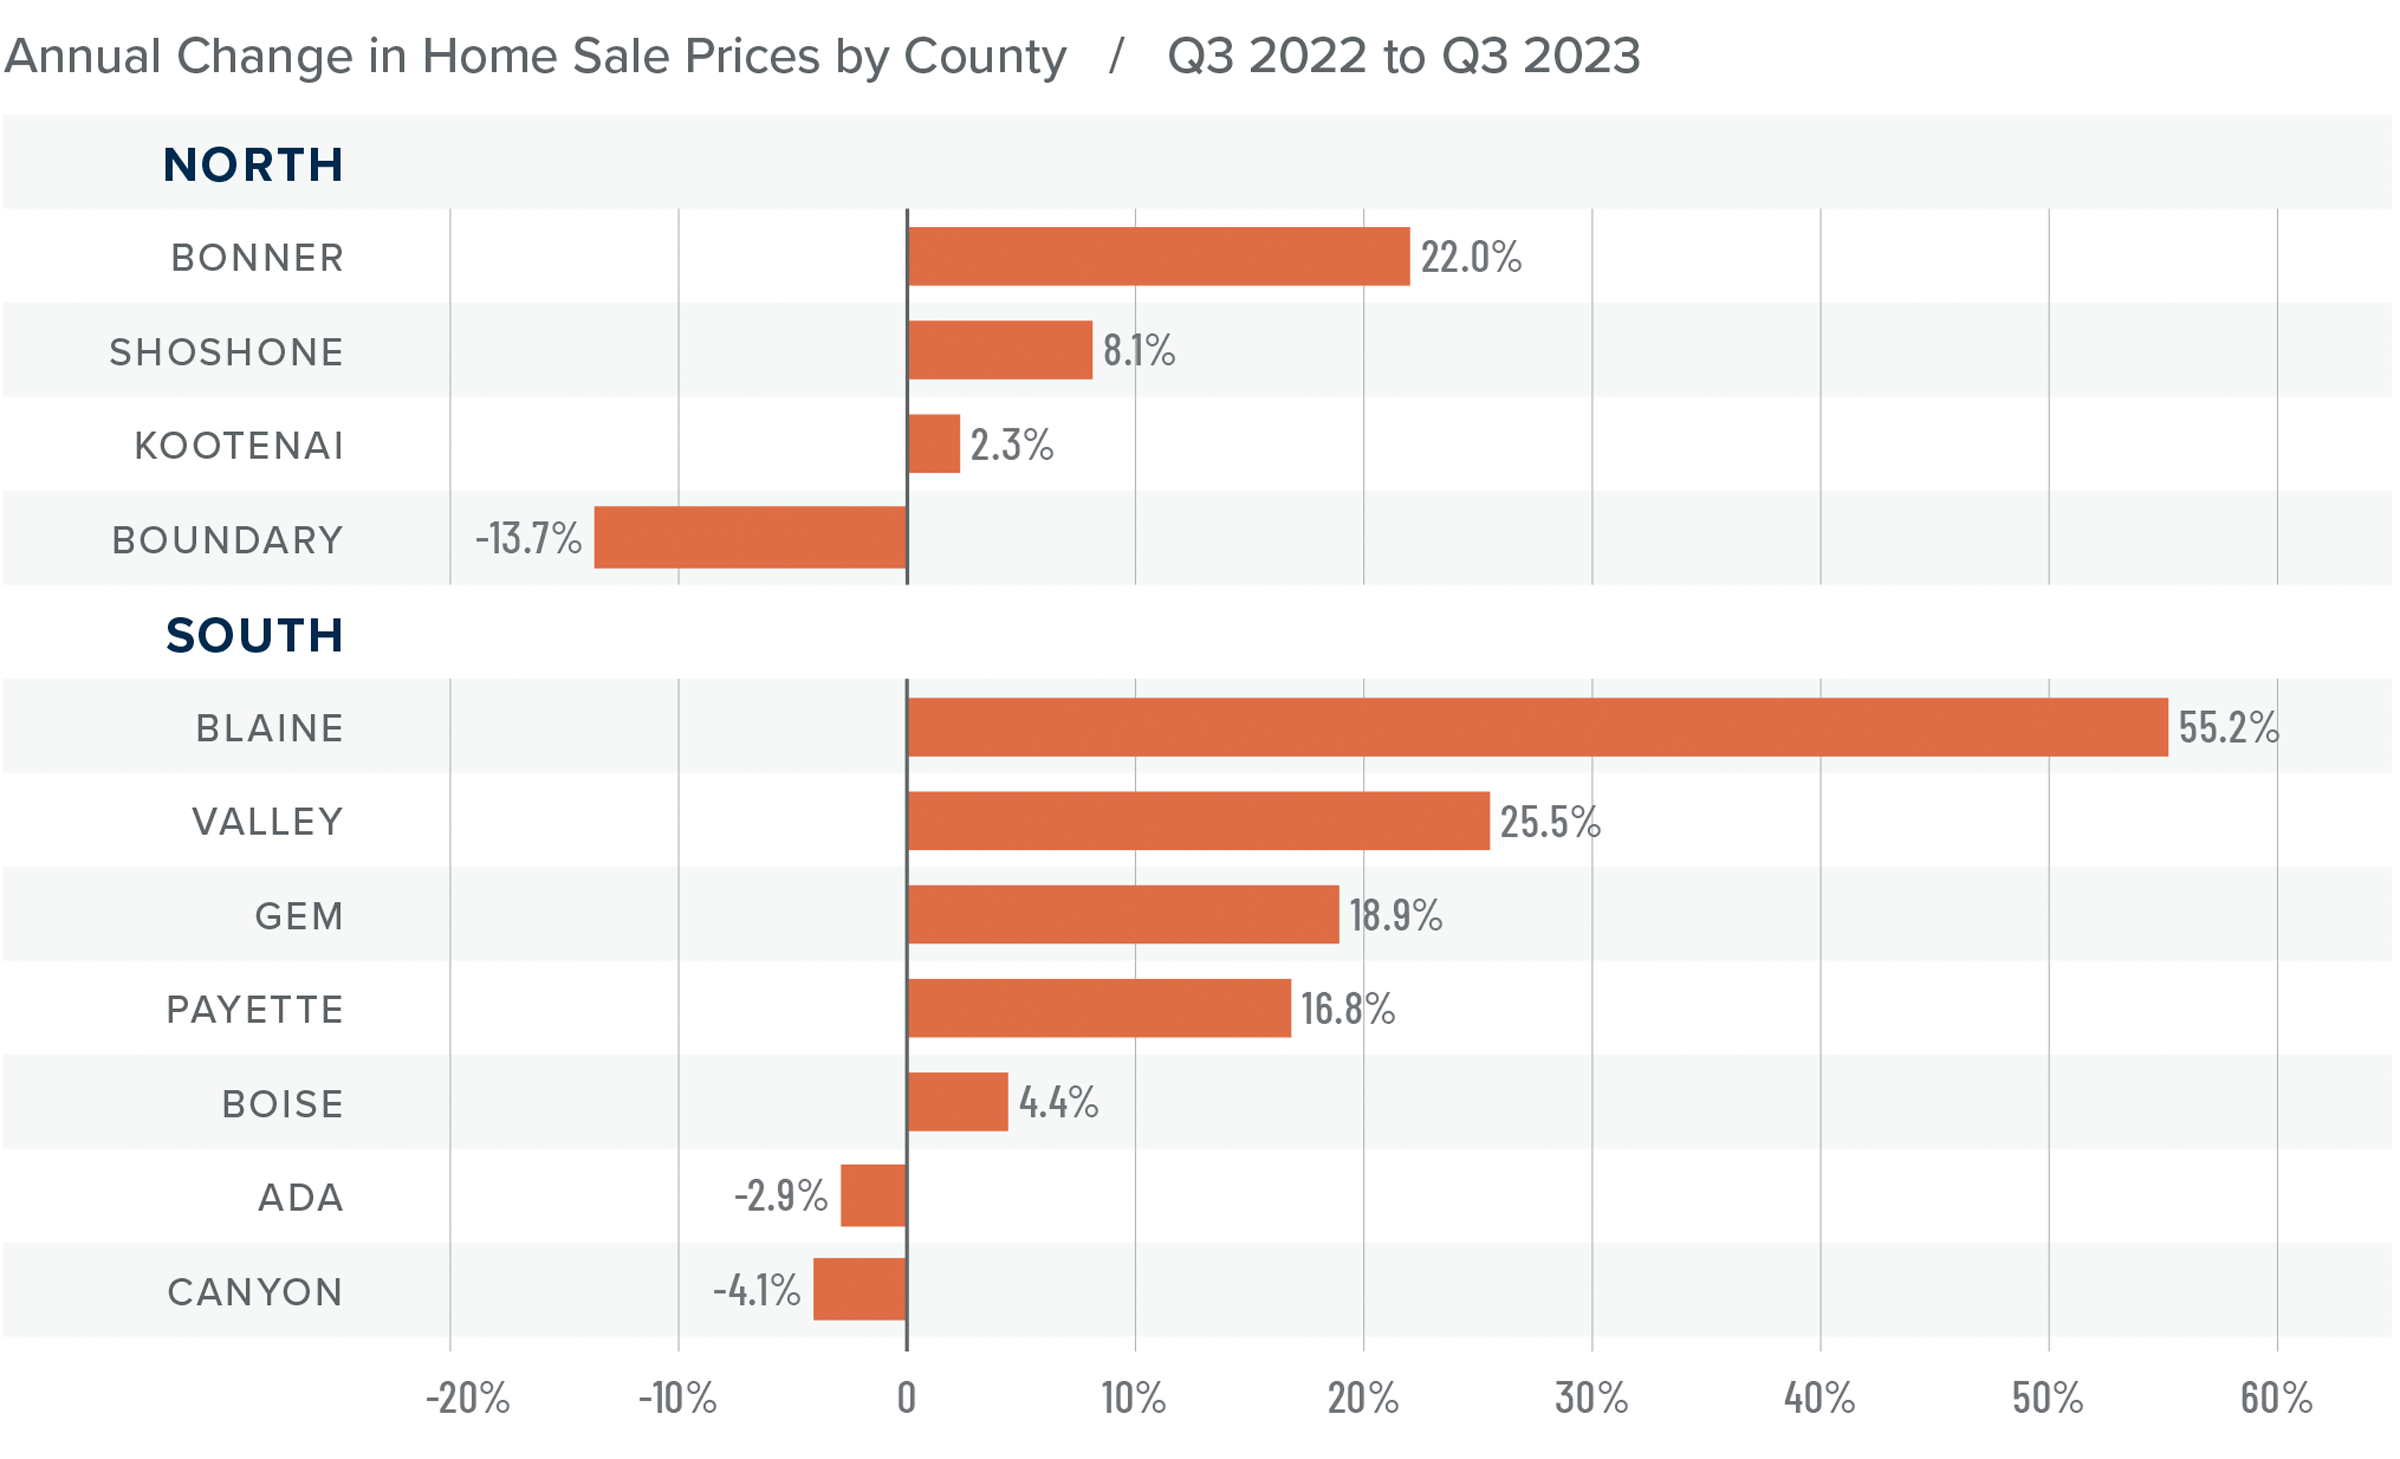
❱ The average home price in the region rose 2.7% year over year to $636,148. Sale prices were 5.1% higher than in the second quarter of 2023.
❱ Compared to the second quarter of 2023, prices rose an average of 5.9% in the northern market areas covered by this report. Sale prices were up 4.2% in the southern part of the state.
❱ Only one county in the northern market areas and two in the southern markets saw prices fall year over year. Compared to the second quarter, prices rose in all markets other than Shoshone and Boundary counties in the northern market area.
❱ Median list prices were up 9.5% from the second quarter. However, in the southern part of the state, every county except Payette and Blaine counties saw list prices fall. Only Boundary County in the northern markets saw list prices fall. This may suggest that sellers are starting to adjust their expectations given significant increases in financing costs.
Mortgage Rates
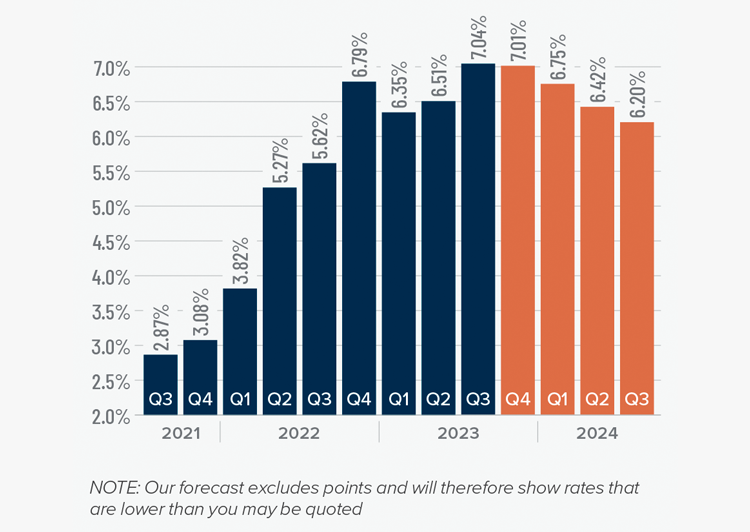
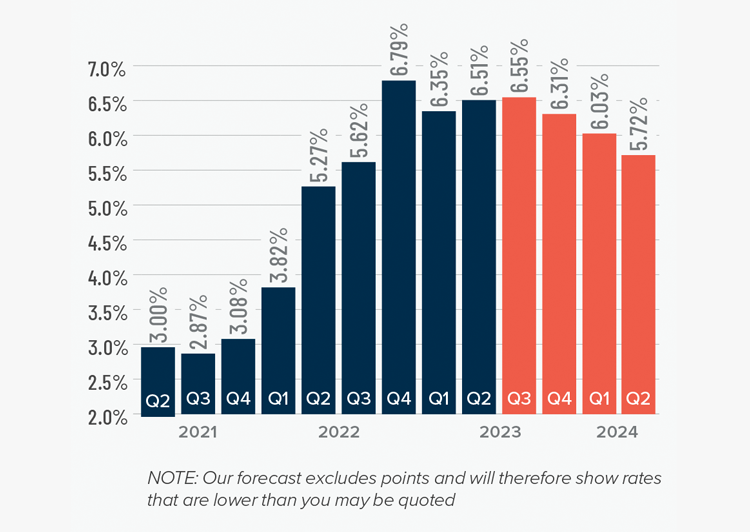
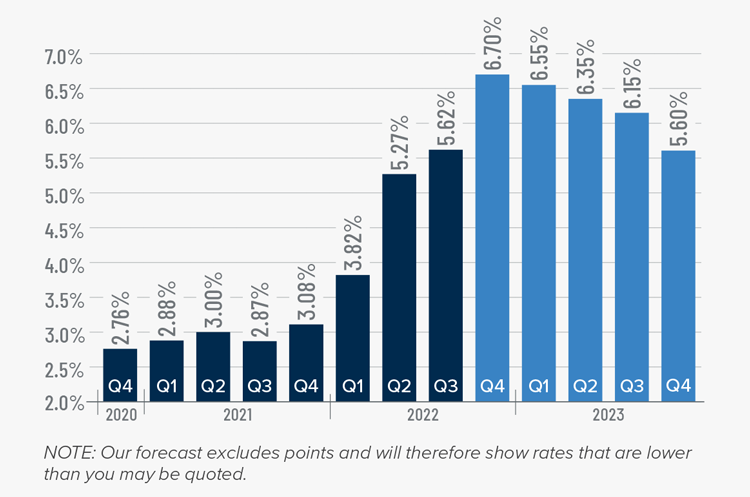
Mortgage rates continued trending higher in the third quarter of 2023 and are now at levels we have not seen since the fall of 2000. Mortgage rates are tied to the interest rate (yield) on 10-year treasuries, and they move in the opposite direction of the economy. Unfortunately for mortgage rates, the economy remains relatively buoyant, and though inflation is down significantly from its high, it is still elevated. These major factors and many minor ones are pushing Treasury yields higher, which is pushing mortgage rates up. Given the current position of the Federal Reserve, which intends to keep rates “higher for longer,” it is unlikely that home buyers will get much reprieve when it comes to borrowing costs any time soon.
With such a persistently positive economy, I have had to revise my forecast yet again. I now believe rates will hold at current levels before starting to trend down in the spring of next year.
Idaho Days on Market
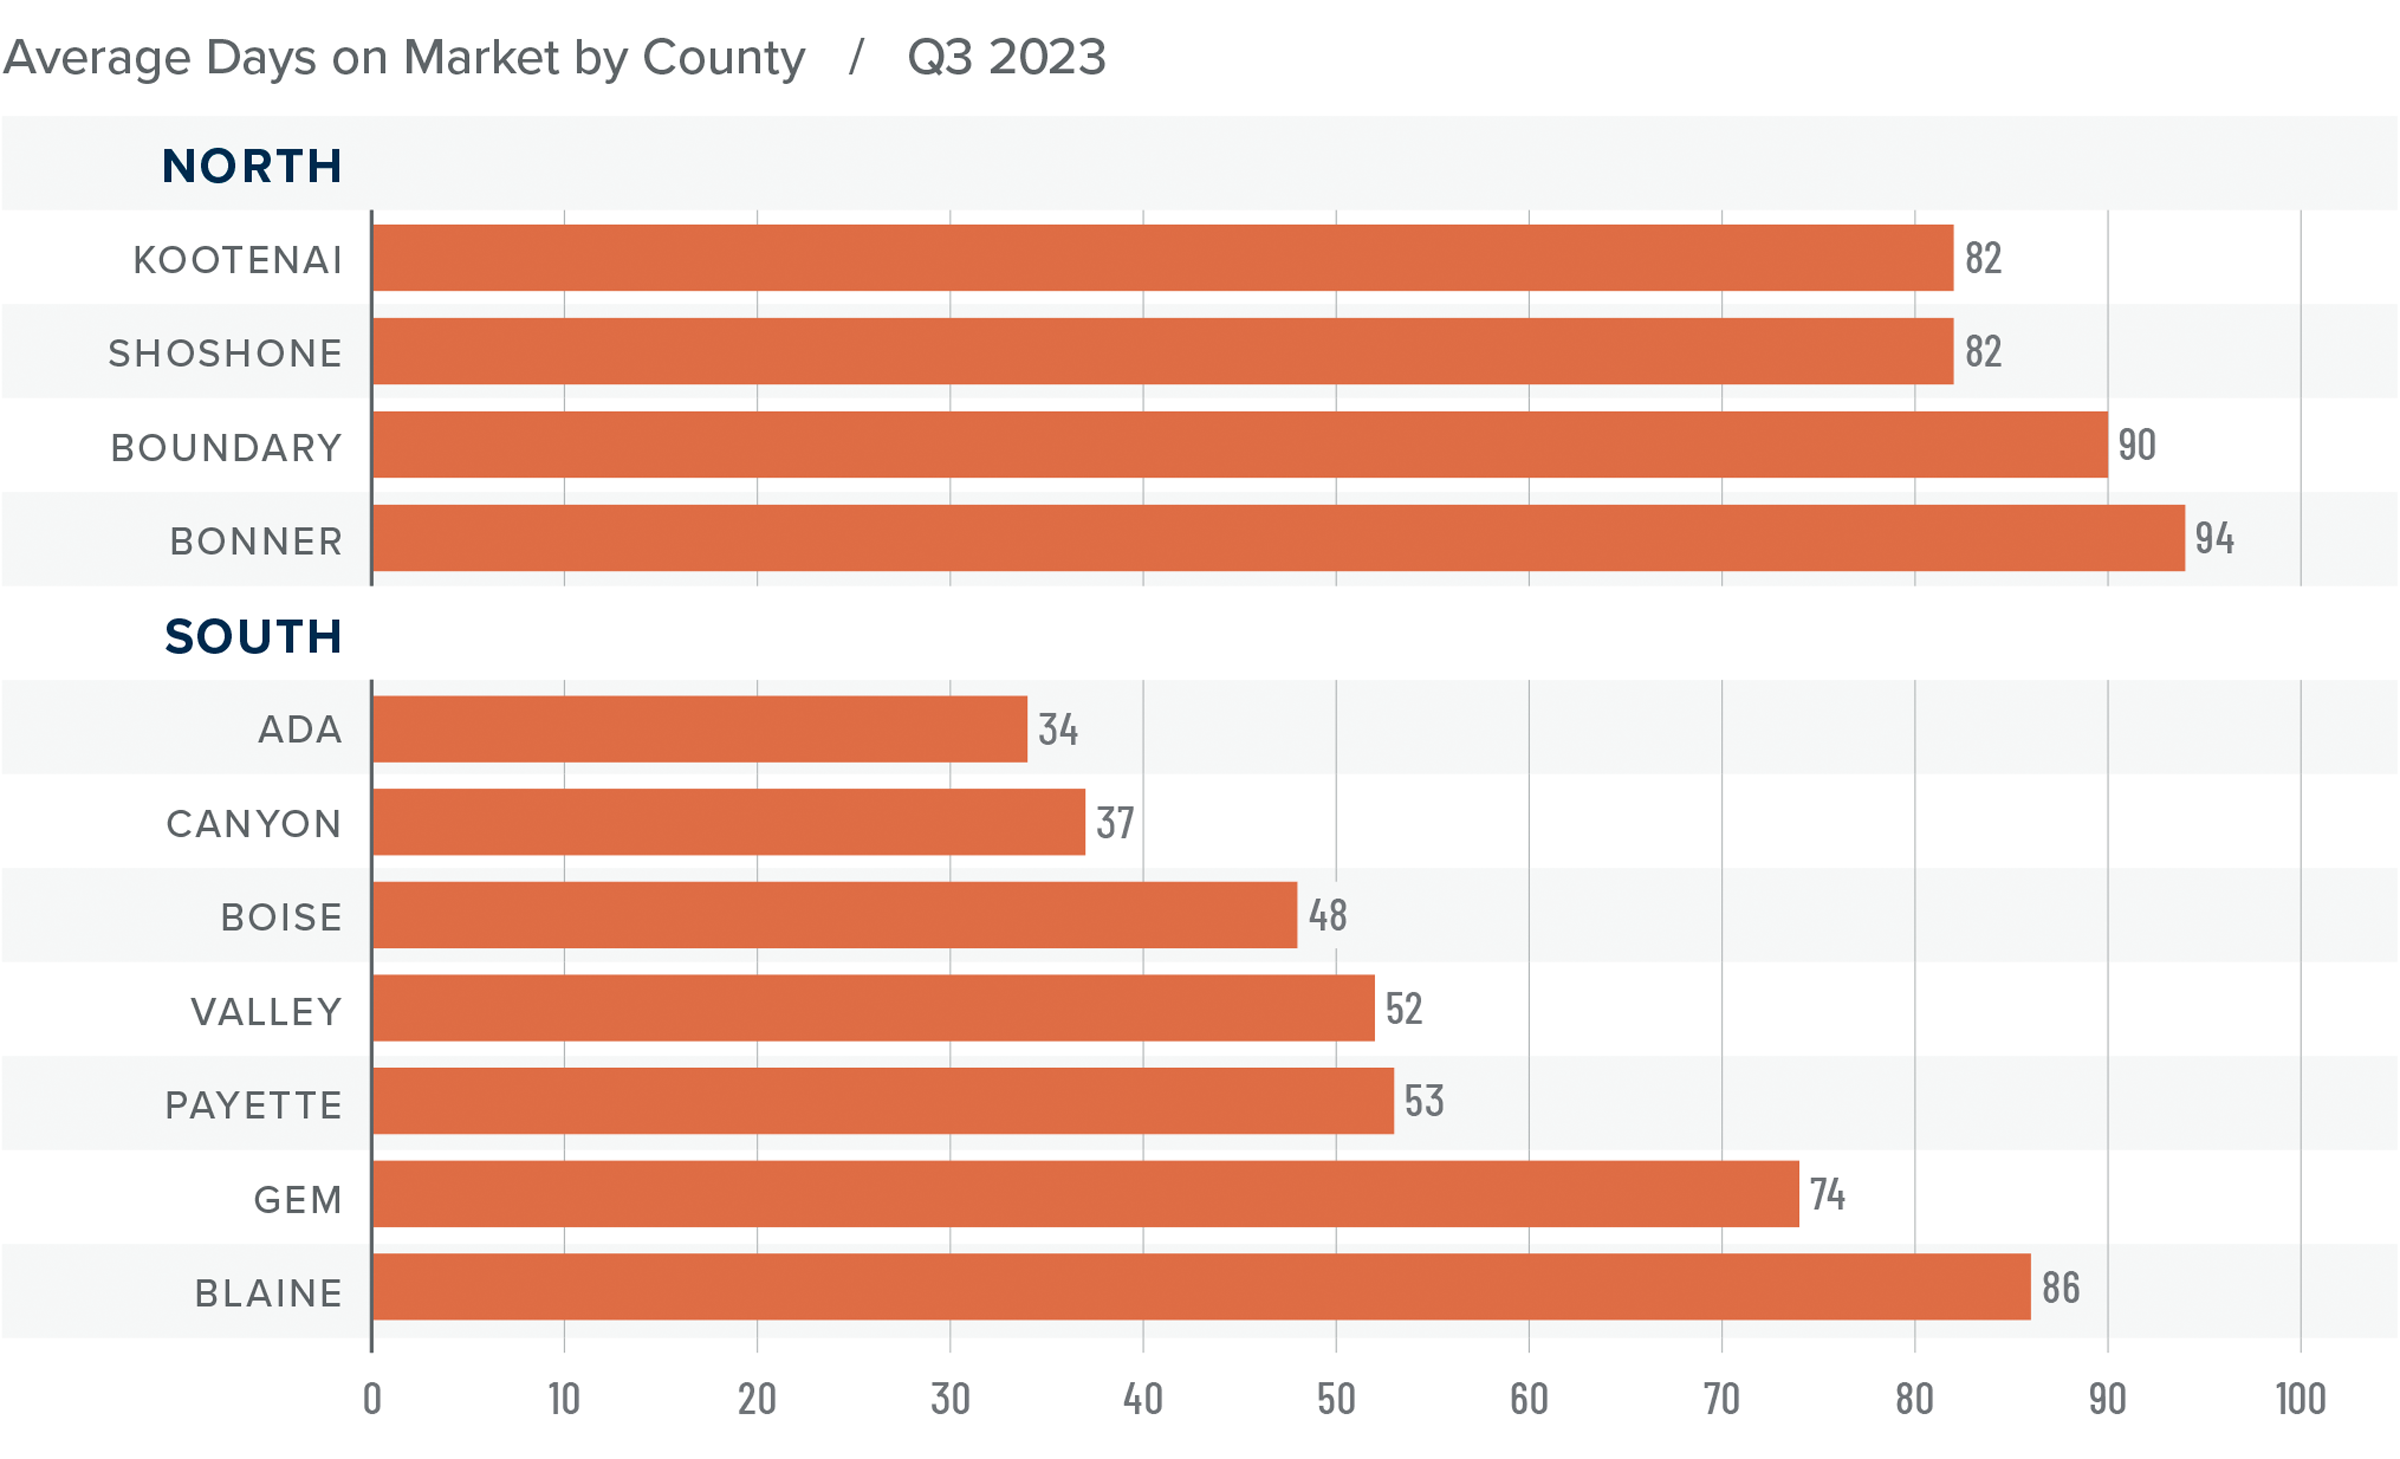
❱ The average time it took to sell a home in the region rose 16 days compared to the third quarter of 2022. It took an average of nine fewer days for a home to sell than in the second quarter of this year.
❱ In both Northern and Southern Idaho, days on market rose in all counties compared to the same period of 2022. Compared to the second quarter of this year, market time rose in every county in the northern part of the state. In the southern areas, market time fell in all counties except Payette and Gem.
❱ It took an average of 87 days to sell a home in Northern Idaho and 55 days in the southern counties covered by this report.
❱ Homes sold the fastest in Ada County in the southern part of the state. In Northern Idaho, Shoshone and Kootenai counties had the shortest market time.
Conclusions
This speedometer reflects the state of the region’s real estate market using housing inventory, price gains, home sales, interest rates, and larger economic factors.
There appears to be a disconnect in the market right now. Pending and closed sales are down while listings are higher, which should favor home buyers. However, list and sale prices are higher, which typically favors sellers.
Given the rapid increases in home prices over the past two years, significantly higher mortgage rates will start impacting the market at some point. The question is when.

All things considered, the market favors neither buyers or sellers. As such, the needle stays in the balanced quadrant, with neither side having the upper hand.
Q2 2023 Idaho Real Estate Market Update

The following analysis of select counties of the Idaho real estate market is provided by Windermere Real Estate Chief Economist Matthew Gardner. We hope that this information may assist you with making better-informed real estate decisions. For further information about the housing market in your area, please don’t hesitate to contact your Windermere Real Estate agent.
Regional Economic Overview
Idaho’s annual pace of employment growth has started to slow. However, the addition of 25,400 new jobs over the past year represented an impressive 3.1% growth rate. All of Idaho’s metro areas except Lewiston saw solid year-over-year nonfarm job gains. Coeur d’Alene had the greatest increase at 3.9%, followed by Pocatello (+3.6%), Boise (+3.4%), Idaho Falls (3.2%), and Twin Falls (2%). Lewiston saw a very modest decline of 200 jobs, or .2%. The state unemployment rate was a healthy 2.6%, marginally above the 2.5% we saw at this time in 2022, but still the 13th lowest rate in the nation. The lowest regional jobless rate was in Lewiston and Idaho Falls at 2.6%. Boise’s rate was 2.8% and the highest rate was in Coeur d’Alene at 3.3%. Jobs continue to be added across the state. Even if the pace has cooled slightly, the economy appears to be solid. Although I expect the pace of job growth to continue to cool, I do not anticipate jobs to be shed this year, even as the national economy slows.
Idaho Home Sales
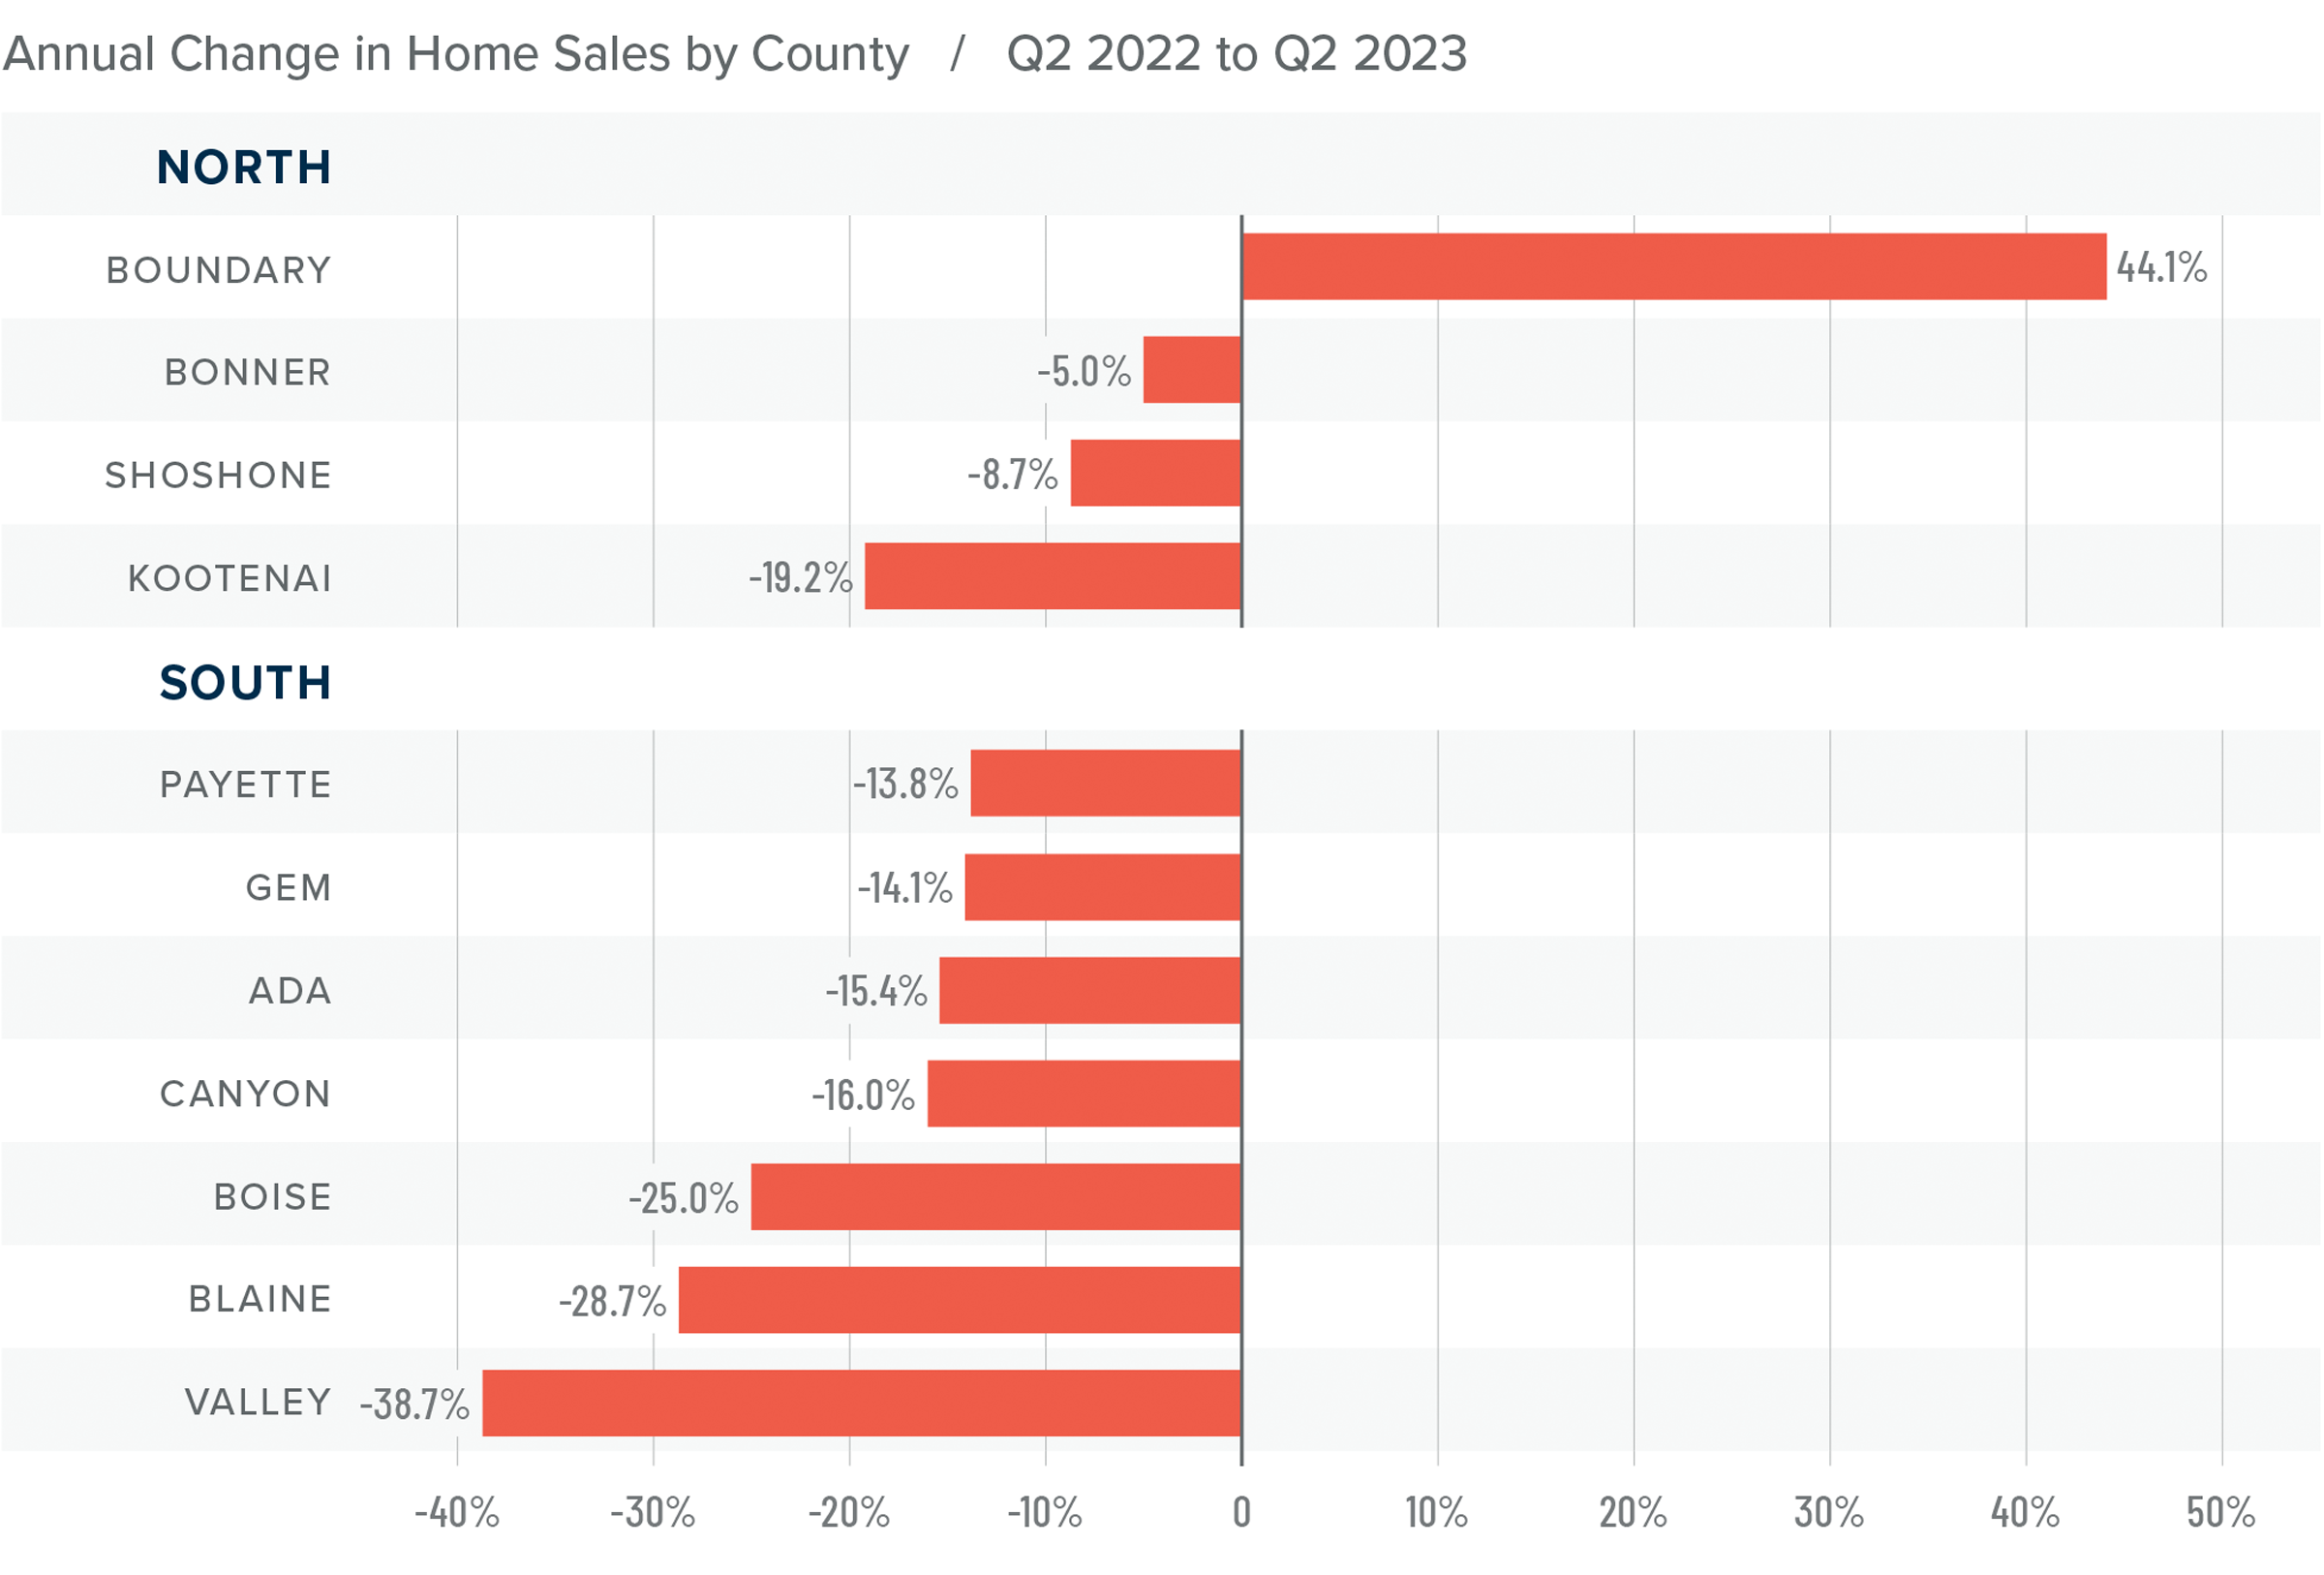
❱ In the second quarter of 2023, 5,069 homes sold, which was down 16.1% from the second quarter of 2022. Sales were up 20.8% from the first quarter of this year.
❱ Listing activity was marginally higher than in the second quarter of 2022, but jumped 24.6% from the first quarter of this year, which caused the pace of sales to rise significantly.
❱ Compared to the same period a year ago, sales fell in every market other than Boundary County, but this is a small market that can be prone to extreme swings. Compared to the first quarter of this year, sales rose in all markets other than Valley County, where they fell by a modest 2.1%.
❱ Pending sales were up 13% from the first quarter of the year, suggesting that sales may continue to rise in the upcoming quarter.
Idaho Home Prices
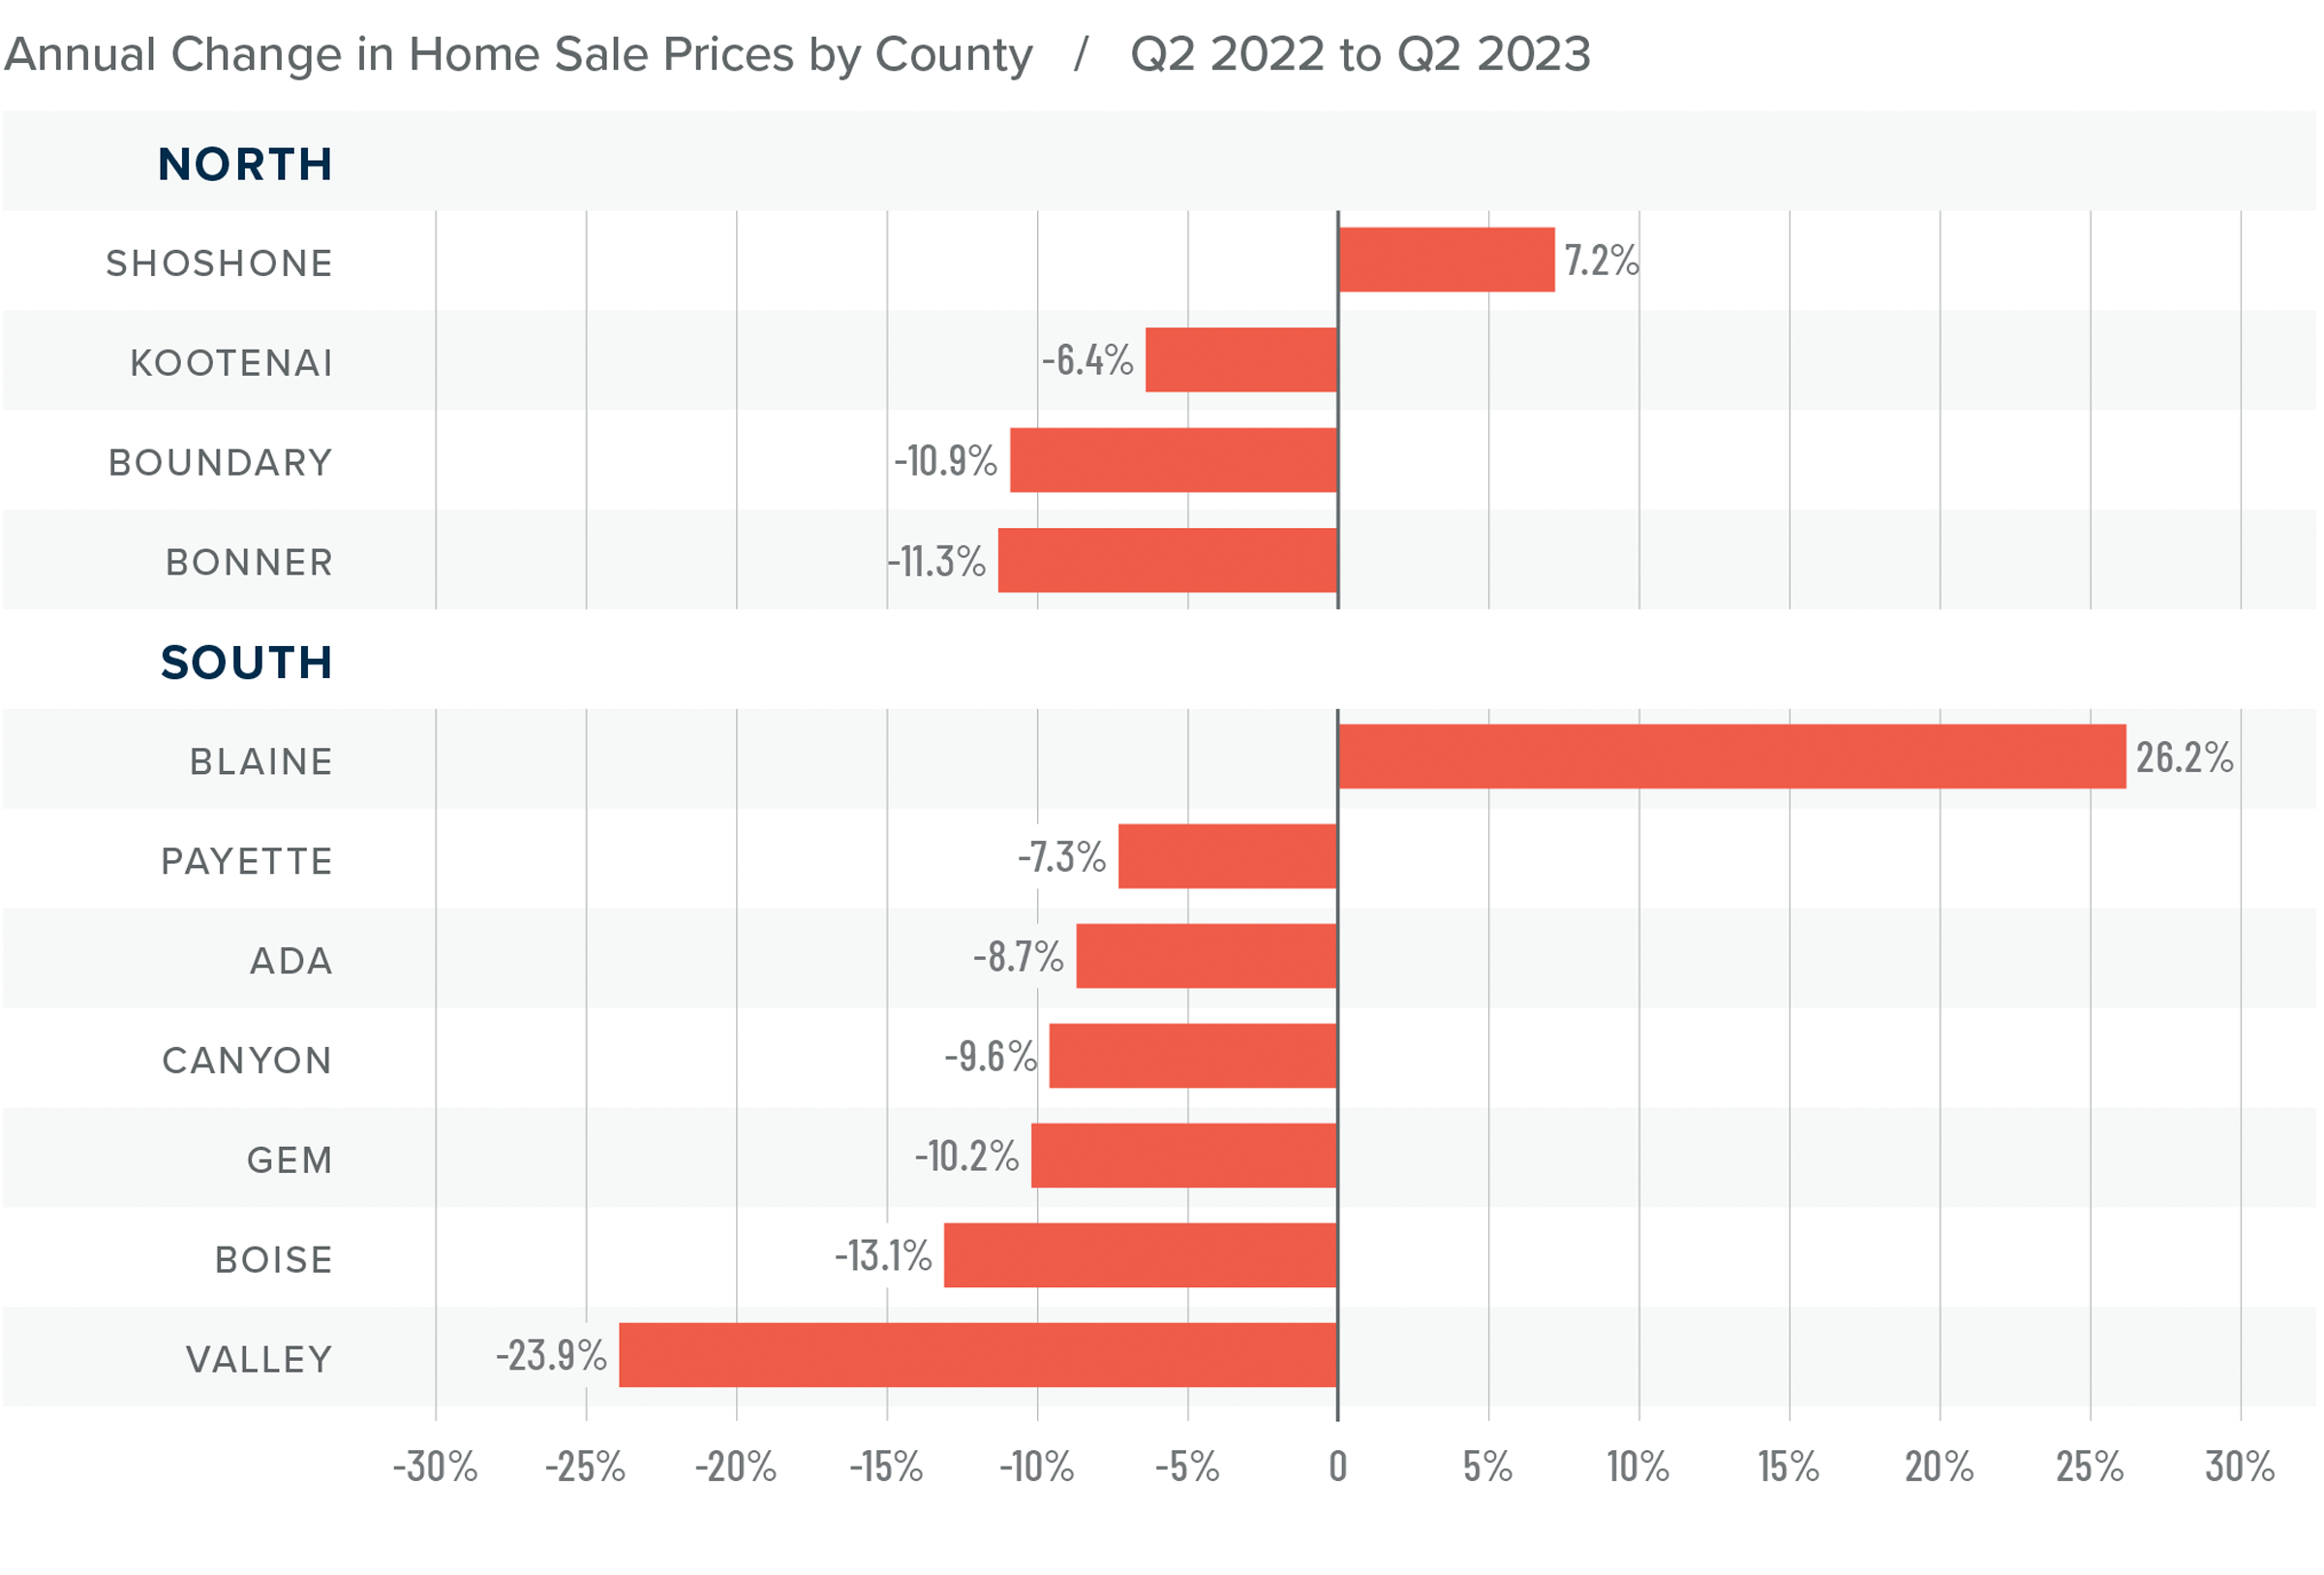
❱ The average home price in the region fell 7.9% year over year to $605,535. Sale prices were 5.7% higher than in the first quarter of 2023.
❱ Compared to the first quarter of this year, home prices rose in all the Northern Idaho market areas and rose in every market other than Gem and Valley counties in Southern Idaho.
❱ Only one county in each of the northern and southern market areas saw prices rise year over year, while the balance of the region had lower sale prices. Prices fell 8% in the south and 7.6% in the north compared to the second quarter of 2022.
❱ Median list prices in the second quarter were down 2.9% from the first quarter. This may have contributed to the increase in sales and prices, as sellers are likely being more cognizant of the higher financing costs buyers are facing.
Mortgage Rates
Although they were less erratic than the first quarter, mortgage rates unfortunately trended higher and ended the quarter above 7%. This was due to the short debt ceiling impasse, as well as several economic datasets that suggested the U.S. economy was not slowing at the speed required by the Federal Reserve.
While the June employment report showed fewer jobs created than earlier in the year, as well as downward revisions to prior gains, inflation has not sufficiently slowed. Until it does, rates cannot start to trend consistently lower. With the economy not slowing as fast as expected, I have adjusted my forecast: Rates will hold at current levels in third quarter and then start to trend lower through the fall. Although there are sure to be occasional spikes, my model now shows the 30-year fixed rate breaking below 6% next spring.
Idaho Days on Market
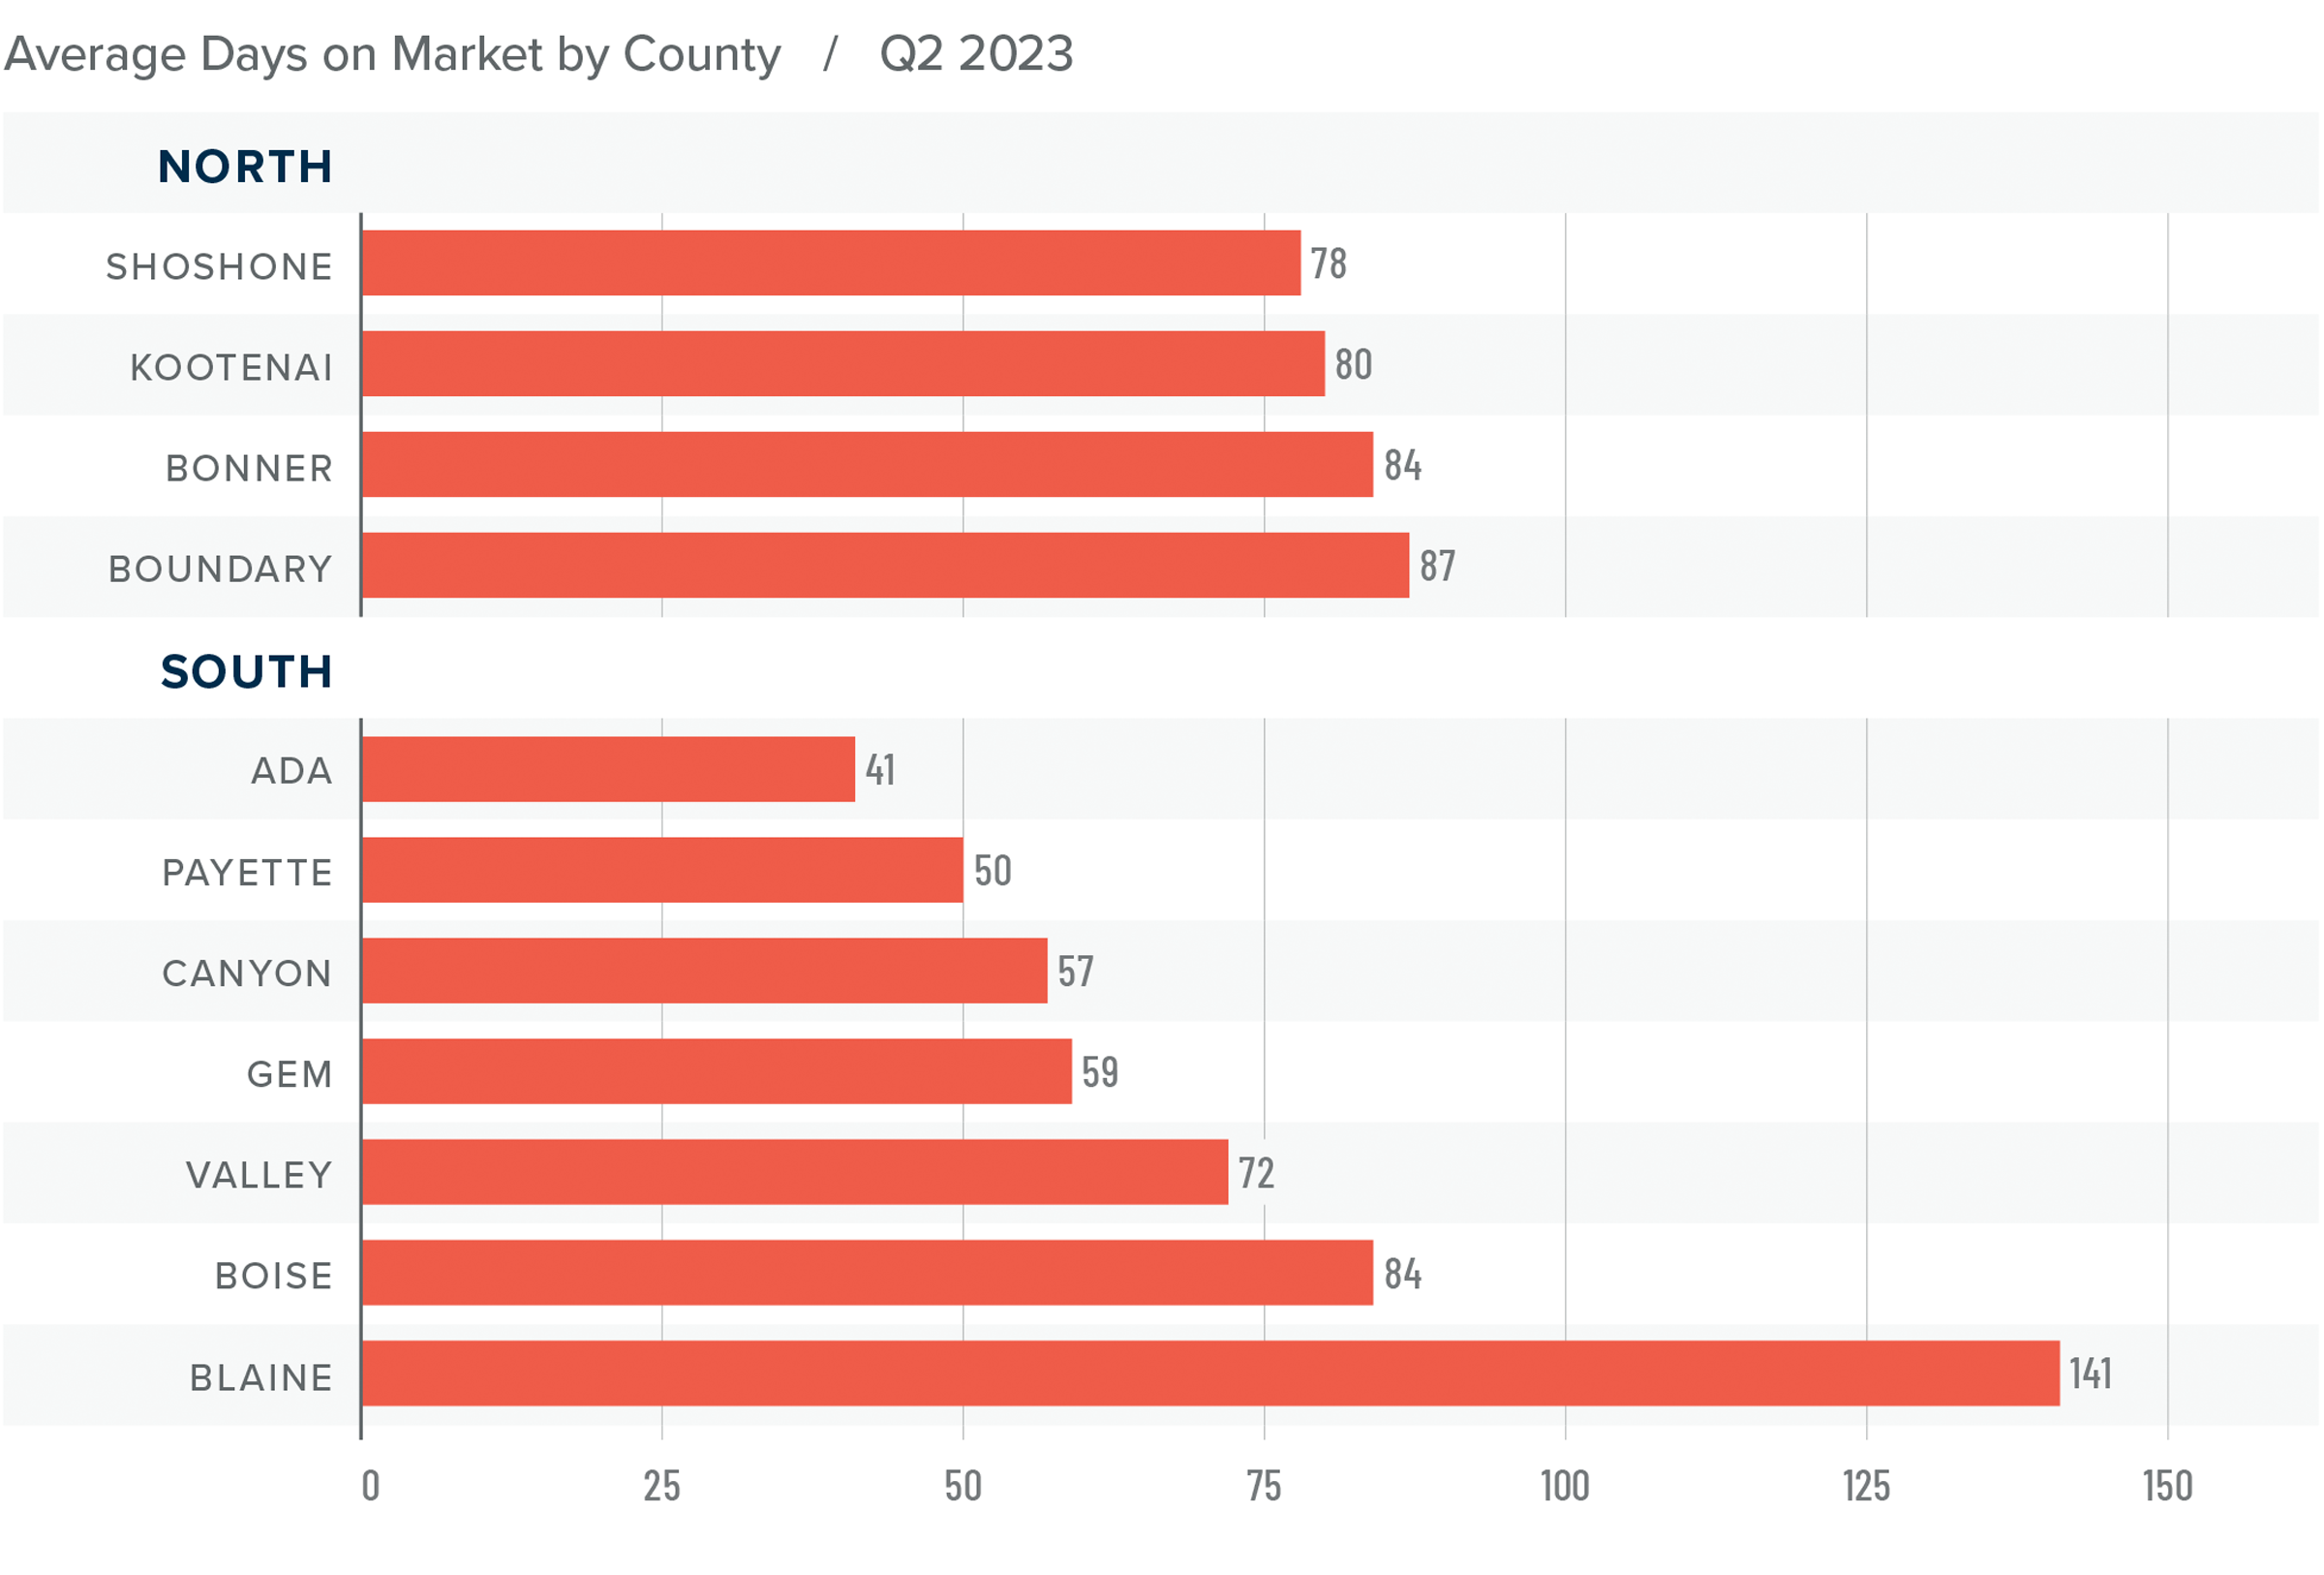
❱ The average time it took to sell a home in the region rose 27 days compared to the same quarter of 2022. It took an average of 20 fewer days to find a buyer than in the first quarter of this year.
❱ In all Northern and Southern Idaho counties, days on market rose compared to the same period in 2022. But compared to the first quarter of this year, market time fell in every county other than Valley.
❱ It took an average of 82 days to sell a home in Northern Idaho and 72 days in the southern counties covered by this report.
❱ Homes sold the fastest in Ada County in the southern part of the state and in Shoshone County in Northern Idaho.
Conclusions
This speedometer reflects the state of the region’s real estate market using housing inventory, price gains, home sales, interest rates, and larger economic factors.
The housing market performed well in the second quarter, even as mortgage rates rose. It will be interesting to see what impact the rate increases in June and July may have on sales activity in the third quarter. Though list prices have not fallen much, the share of homes on the market that have undergone price cuts has increased. This is likely in response to rising mortgage rates. Rising inventory levels favor buyers. If sellers are starting to acknowledge that buyers are being stretched given current mortgage rates, that too works in their favor. That said, higher sales activity and home prices, and lower days on the market all favor sellers.

Since there are components of the market that favor both sides, I am leaving the needle in the balanced quadrant, albeit modestly favoring home sellers.
About Matthew Gardner

As Chief Economist for Windermere Real Estate, Matthew Gardner is responsible for analyzing and interpreting economic data and its impact on the real estate market on both a local and national level. Matthew has over 30 years of professional experience both in the U.S. and U.K.
In addition to his day-to-day responsibilities, Matthew sits on the Washington State Governors Council of Economic Advisors; chairs the Board of Trustees at the Washington Center for Real Estate Research at the University of Washington; and is an Advisory Board Member at the Runstad Center for Real Estate Studies at the University of Washington where he also lectures in real estate economics.
Q1 2023 Idaho Real Estate Market Update

The following analysis of select counties of the Idaho real estate market is provided by Windermere Real Estate Chief Economist Matthew Gardner. We hope that this information may assist you with making better-informed real estate decisions. For further information about the housing market in your area, please don’t hesitate to contact your Windermere Real Estate agent.
Regional Economic Overview
Year over year, Idaho added 24,900 jobs, representing a solid growth rate of 3%. All of Idaho’s metropolitan areas saw year-over-year nonfarm job gains. Pocatello experienced the greatest increase at 5.5%, followed by Boise (3.7%), Idaho Falls (3.1%), Coeur d’Alene (2.9%), Twin Falls (.4%), and Lewiston (.3%). The state unemployment rate was 2.6%, matching the rate of the first quarter of 2022. The Boise metro area matched the state’s jobless rate of 2.6% and equaled the rate during the same period in 2022. This is rather impressive given that the labor force has grown by over 9,800 persons, or 2.4%. Clearly new jobs are being created at a very solid pace. My current forecast is that employment will rise by 17,000 jobs, which would represent a growth rate of 2 percent.
Idaho Home Sales
❱ In the first quarter of 2023, 4,205 homes sold, which was down 19.5% from the first quarter of 2022 and 2.3% lower than in the fourth quarter of last year.
❱ Although listing activity was significantly higher than the first quarter of 2022, it was down 27% from the fourth quarter of 2022. All counties had fewer homes on the market.
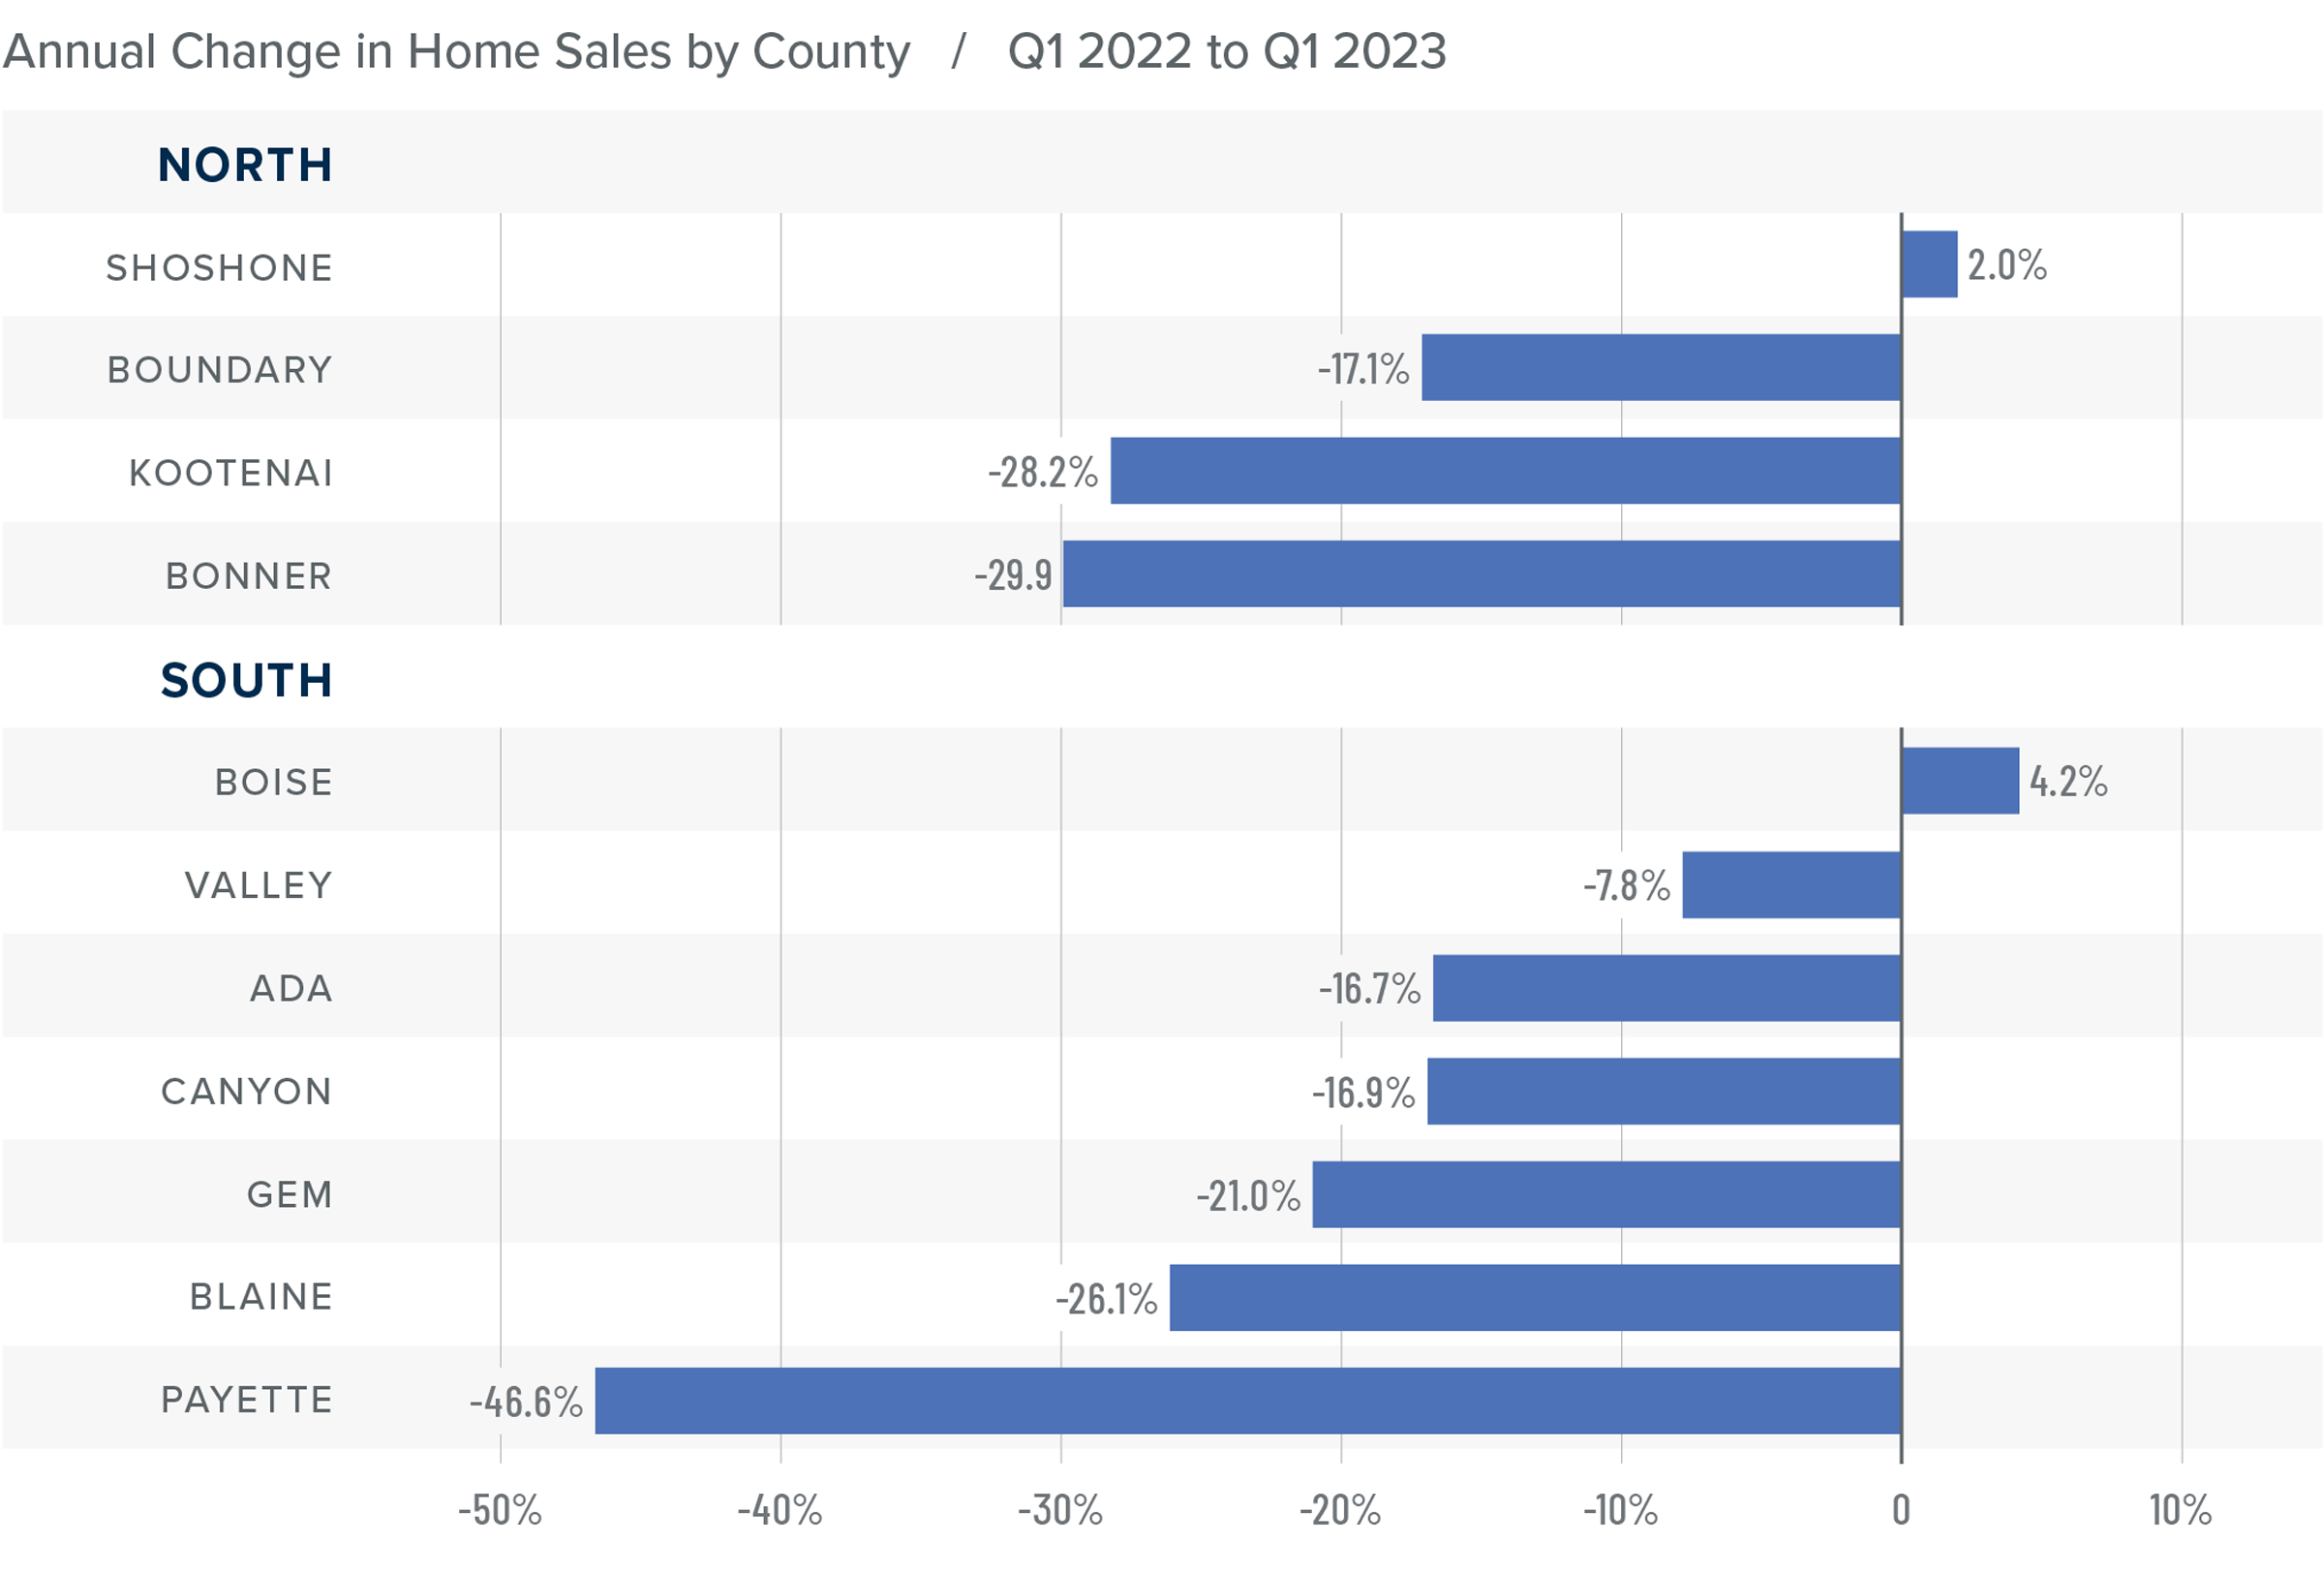
❱ Compared to the same period in 2022, sales fell in all but two markets covered by this report. Compared to the fourth quarter of last year, sales fell in all the Northern Idaho markets, but rose in Canyon, Ada, and Blaine counties in the southern part of the state.
❱ Even with fewer listings, pending sales in the quarter were up 36.9% from the fourth quarter of 2022, suggesting that sales growth may improve in the second quarter of this year.
Idaho Home Prices
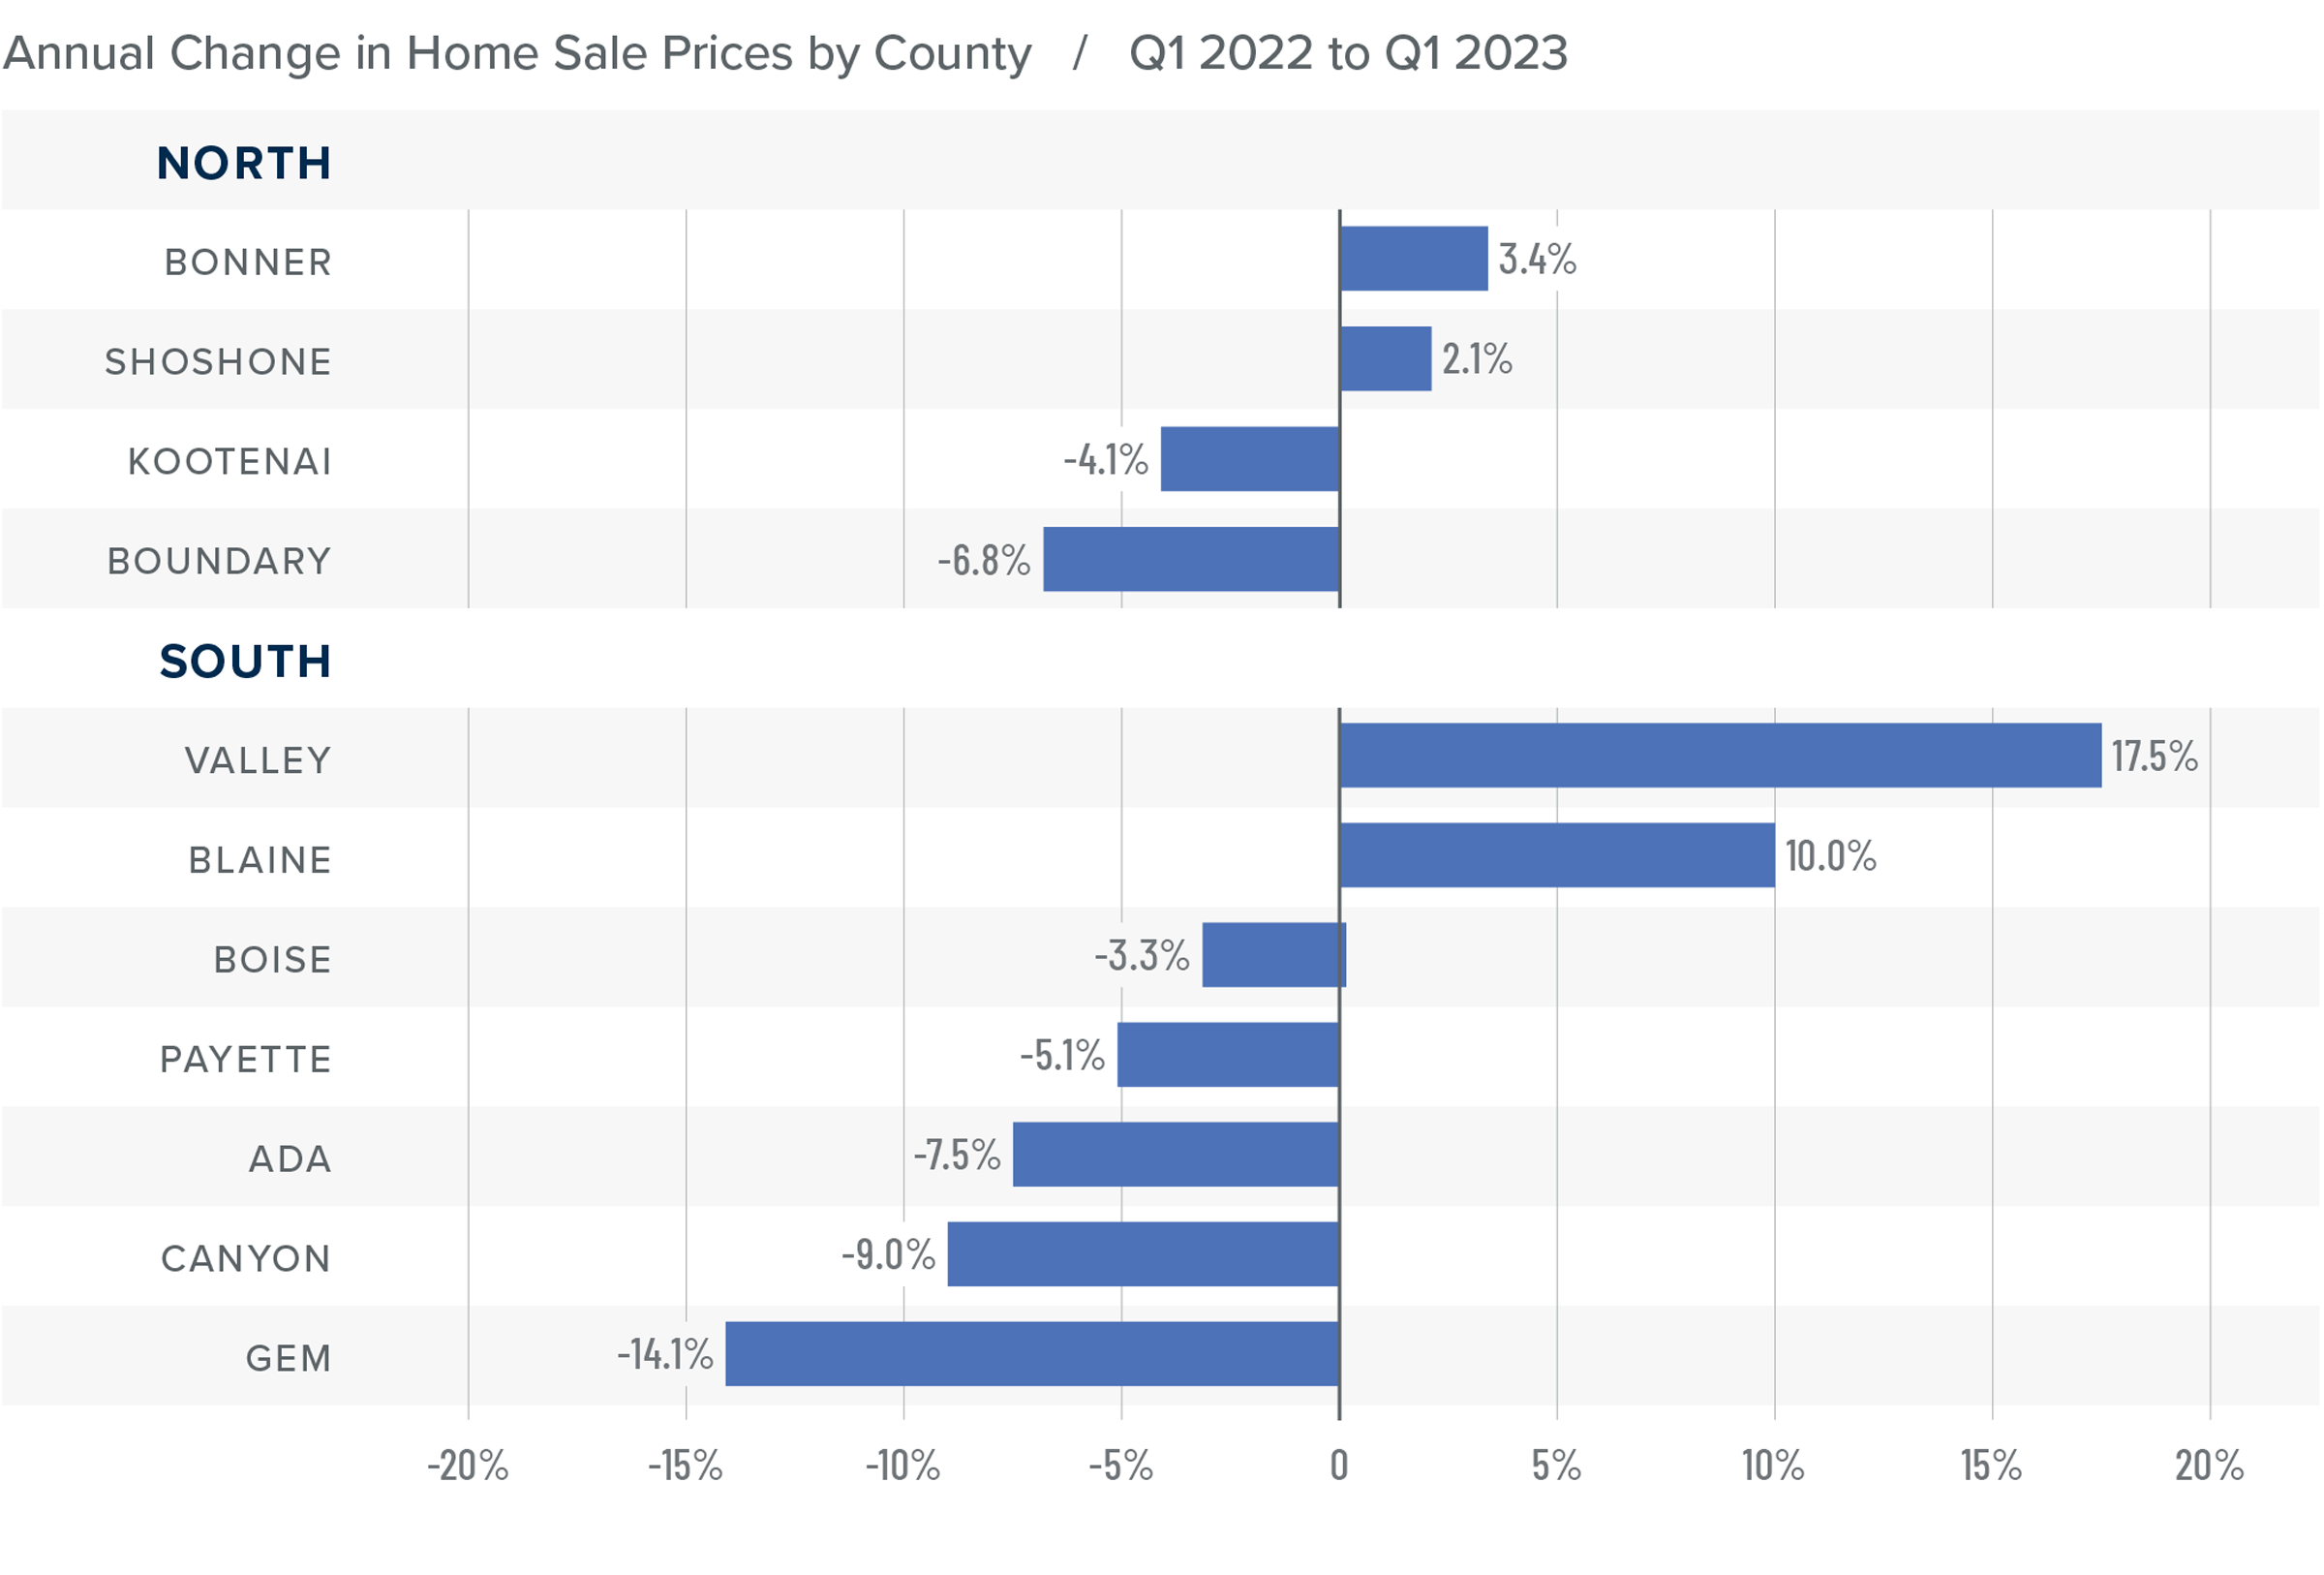
❱ The average home price in the region fell 6% year over year to $576,130. Prices were 5.4% lower than in the fourth quarter of 2022.
❱ Compared to the fourth quarter of 2022, prices only increased in Shoshone County. In the southern part of the state, prices rose in Valley, Payette, Gem, Boise, and Blaine counties.
❱ Both the northern and southern market areas saw counties split, with prices rising in around half while contracting in the other half. Year over year, prices fell 6.4% in the south and 4% in the north.
❱ Median listing prices in the first quarter were up by only .9% over the fourth quarter of last year. Interestingly, listing prices were up more than 10% in the populous Ada County, which many believed would see significant downward price pressure after the rapid growth over the past few years.
Mortgage Rates
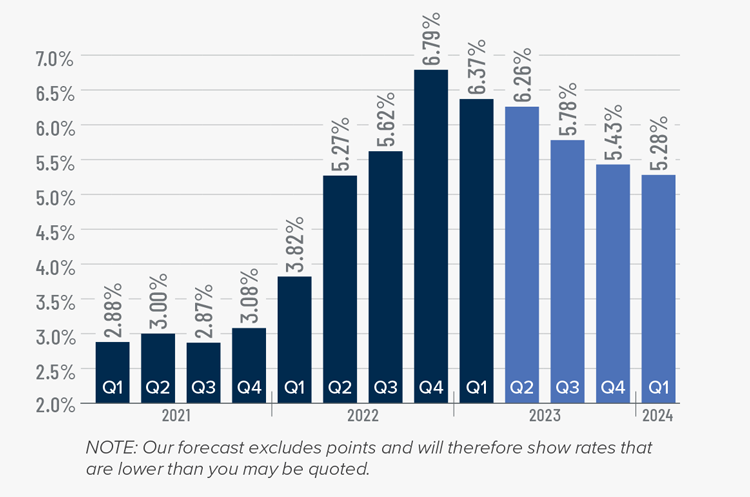
Rates in the first quarter of 2023 were far less volatile than last year, even with the brief but significant impact of early March’s banking crisis. It appears that buyers are jumping in when rates dip, which was the case in mid-January and again in early February.
Even with the March Consumer Price Index report showing inflation slowing, I still expect the Federal Reserve to raise short-term rates one more time following their May meeting before pausing rate increases. This should be the catalyst that allows mortgage rates to start trending lower at a more consistent pace than we have seen so far this year. My current forecast is that rates will continue to move lower with occasional spikes, and that they will hold below 6% in the second half of this year.
Idaho Days on Market
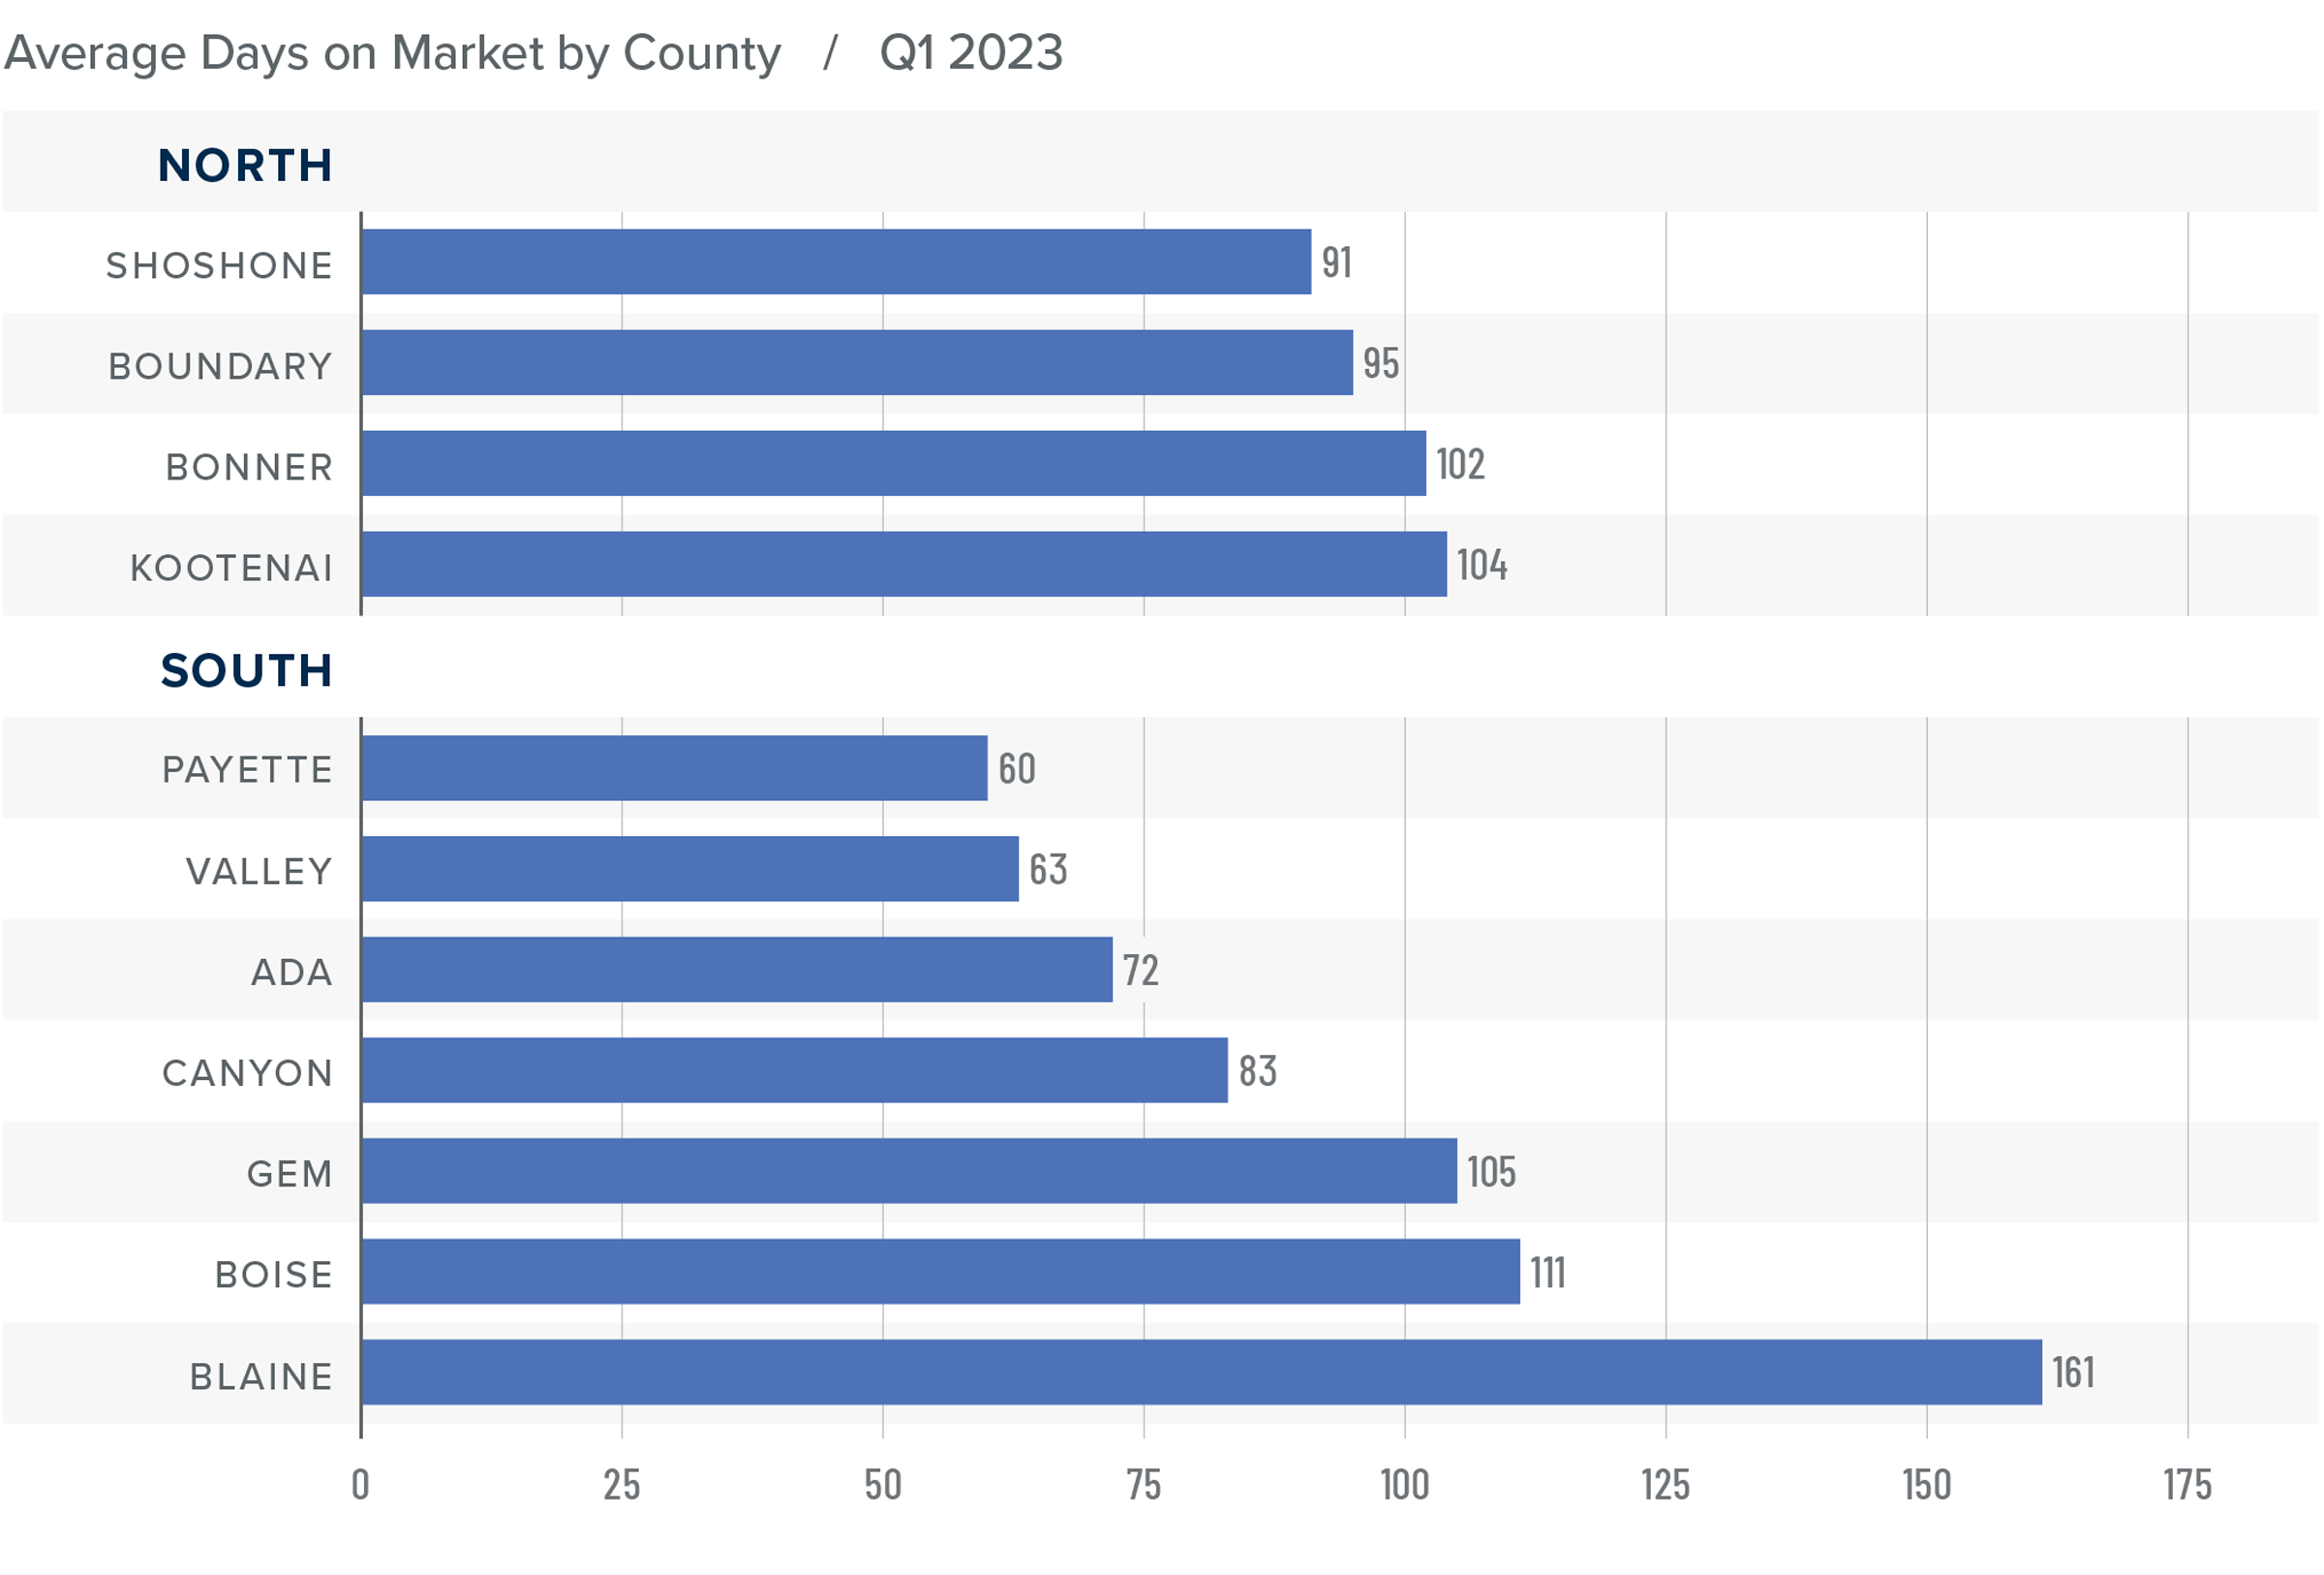
❱ The average time it took to sell a home in the region rose 33 days compared to the same quarter of 2022 and was 22 days longer than in the final quarter of 2022.
❱ In both Northern and Southern Idaho, days on market rose in all counties compared to the same period in 2022. Compared to the fourth quarter of 2022, market time rose in every county other than Gem County in Northern Idaho.
❱ It took an average of 98 days to sell a home in Northern Idaho and 94 days in the southern counties covered by this report.
❱ Homes sold fastest in Payette County in the southern part of the state and in Shoshone County in Northern Idaho.
Conclusions
This speedometer reflects the state of the region’s real estate market using housing inventory, price gains, home sales, interest rates, and larger economic factors.
The housing market has certainly slowed as it adjusts to higher mortgage rates and significantly lower affordability. Over the past few months, I have heard suggestions that the Idaho market was sure to crash after the rapid increase of prices through the pandemic period, especially as financing costs are more than double what they were in 2021. Although prices are adjusting in many markets, I do not expect to see any systemic declines for one simple reason: supply levels are still remarkably low and are not likely to rise to a level where any market is oversupplied. This will provide a floor for prices and stop them from falling much further than where they are today.
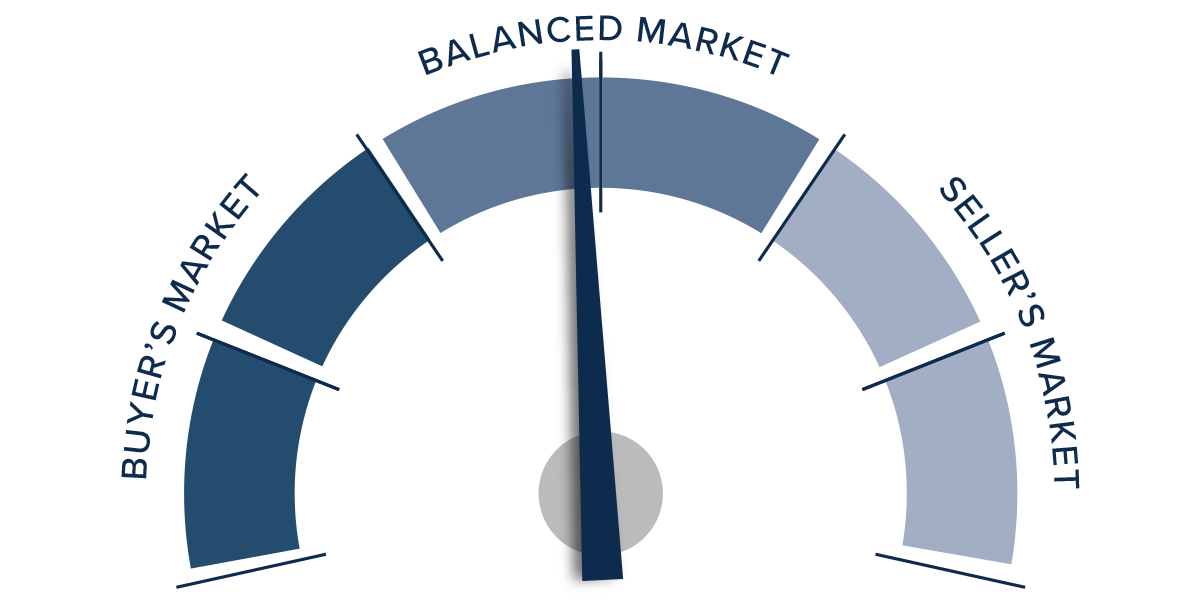
Slower sales activity, lower prices, and longer days on market favor home buyers. However, lower inventory levels, higher pending sales, higher absorption rates, and higher listing prices favor home sellers. As such, I am leaving the needle close to the midpoint of neutral territory. Although buyers are still able to find deals, sellers of well-positioned, appropriately priced homes will still see competition for them, given how few homes are available.
About Matthew Gardner
As Chief Economist for Windermere Real Estate, Matthew Gardner is responsible for analyzing and interpreting economic data and its impact on the real estate market on both a local and national level. Matthew has over 30 years of professional experience both in the U.S. and U.K.
In addition to his day-to-day responsibilities, Matthew sits on the Washington State Governors Council of Economic Advisors; chairs the Board of Trustees at the Washington Center for Real Estate Research at the University of Washington; and is an Advisory Board Member at the Runstad Center for Real Estate Studies at the University of Washington where he also lectures in real estate economics.
Q4 2022 Idaho Real Estate Market Update

The following analysis of select counties of the Idaho real estate market is provided by Windermere Real Estate Chief Economist Matthew Gardner. We hope that this information may assist you with making better-informed real estate decisions. For further information about the housing market in your area, please don’t hesitate to contact your Windermere Real Estate agent.
Regional Economic Overview
The pace of job growth in Idaho continues to slow. That said, with the addition of 23,800 jobs over the past 12 months, the pace of growth was still an impressive 3%. The Boise metro area grew at a more modest 2.5% rate. The job market there is clearly showing signs of fatigue, adding only 200 new jobs over the past three months. Idaho’s unemployment rate was 3%, down modestly from 3.2% a year ago. In the Boise metro area, 2.6% of the labor force was unemployed, down from 2.8% a year ago. Even if the country enters a recession this year, I expect that Idaho will still add jobs, but at a much slower pace than we have seen since the post-pandemic recovery started. My current forecast shows that the state will add about 114,000 jobs in 2023, which suggests that employment growth will slow to around 2%.
Idaho Home Sales
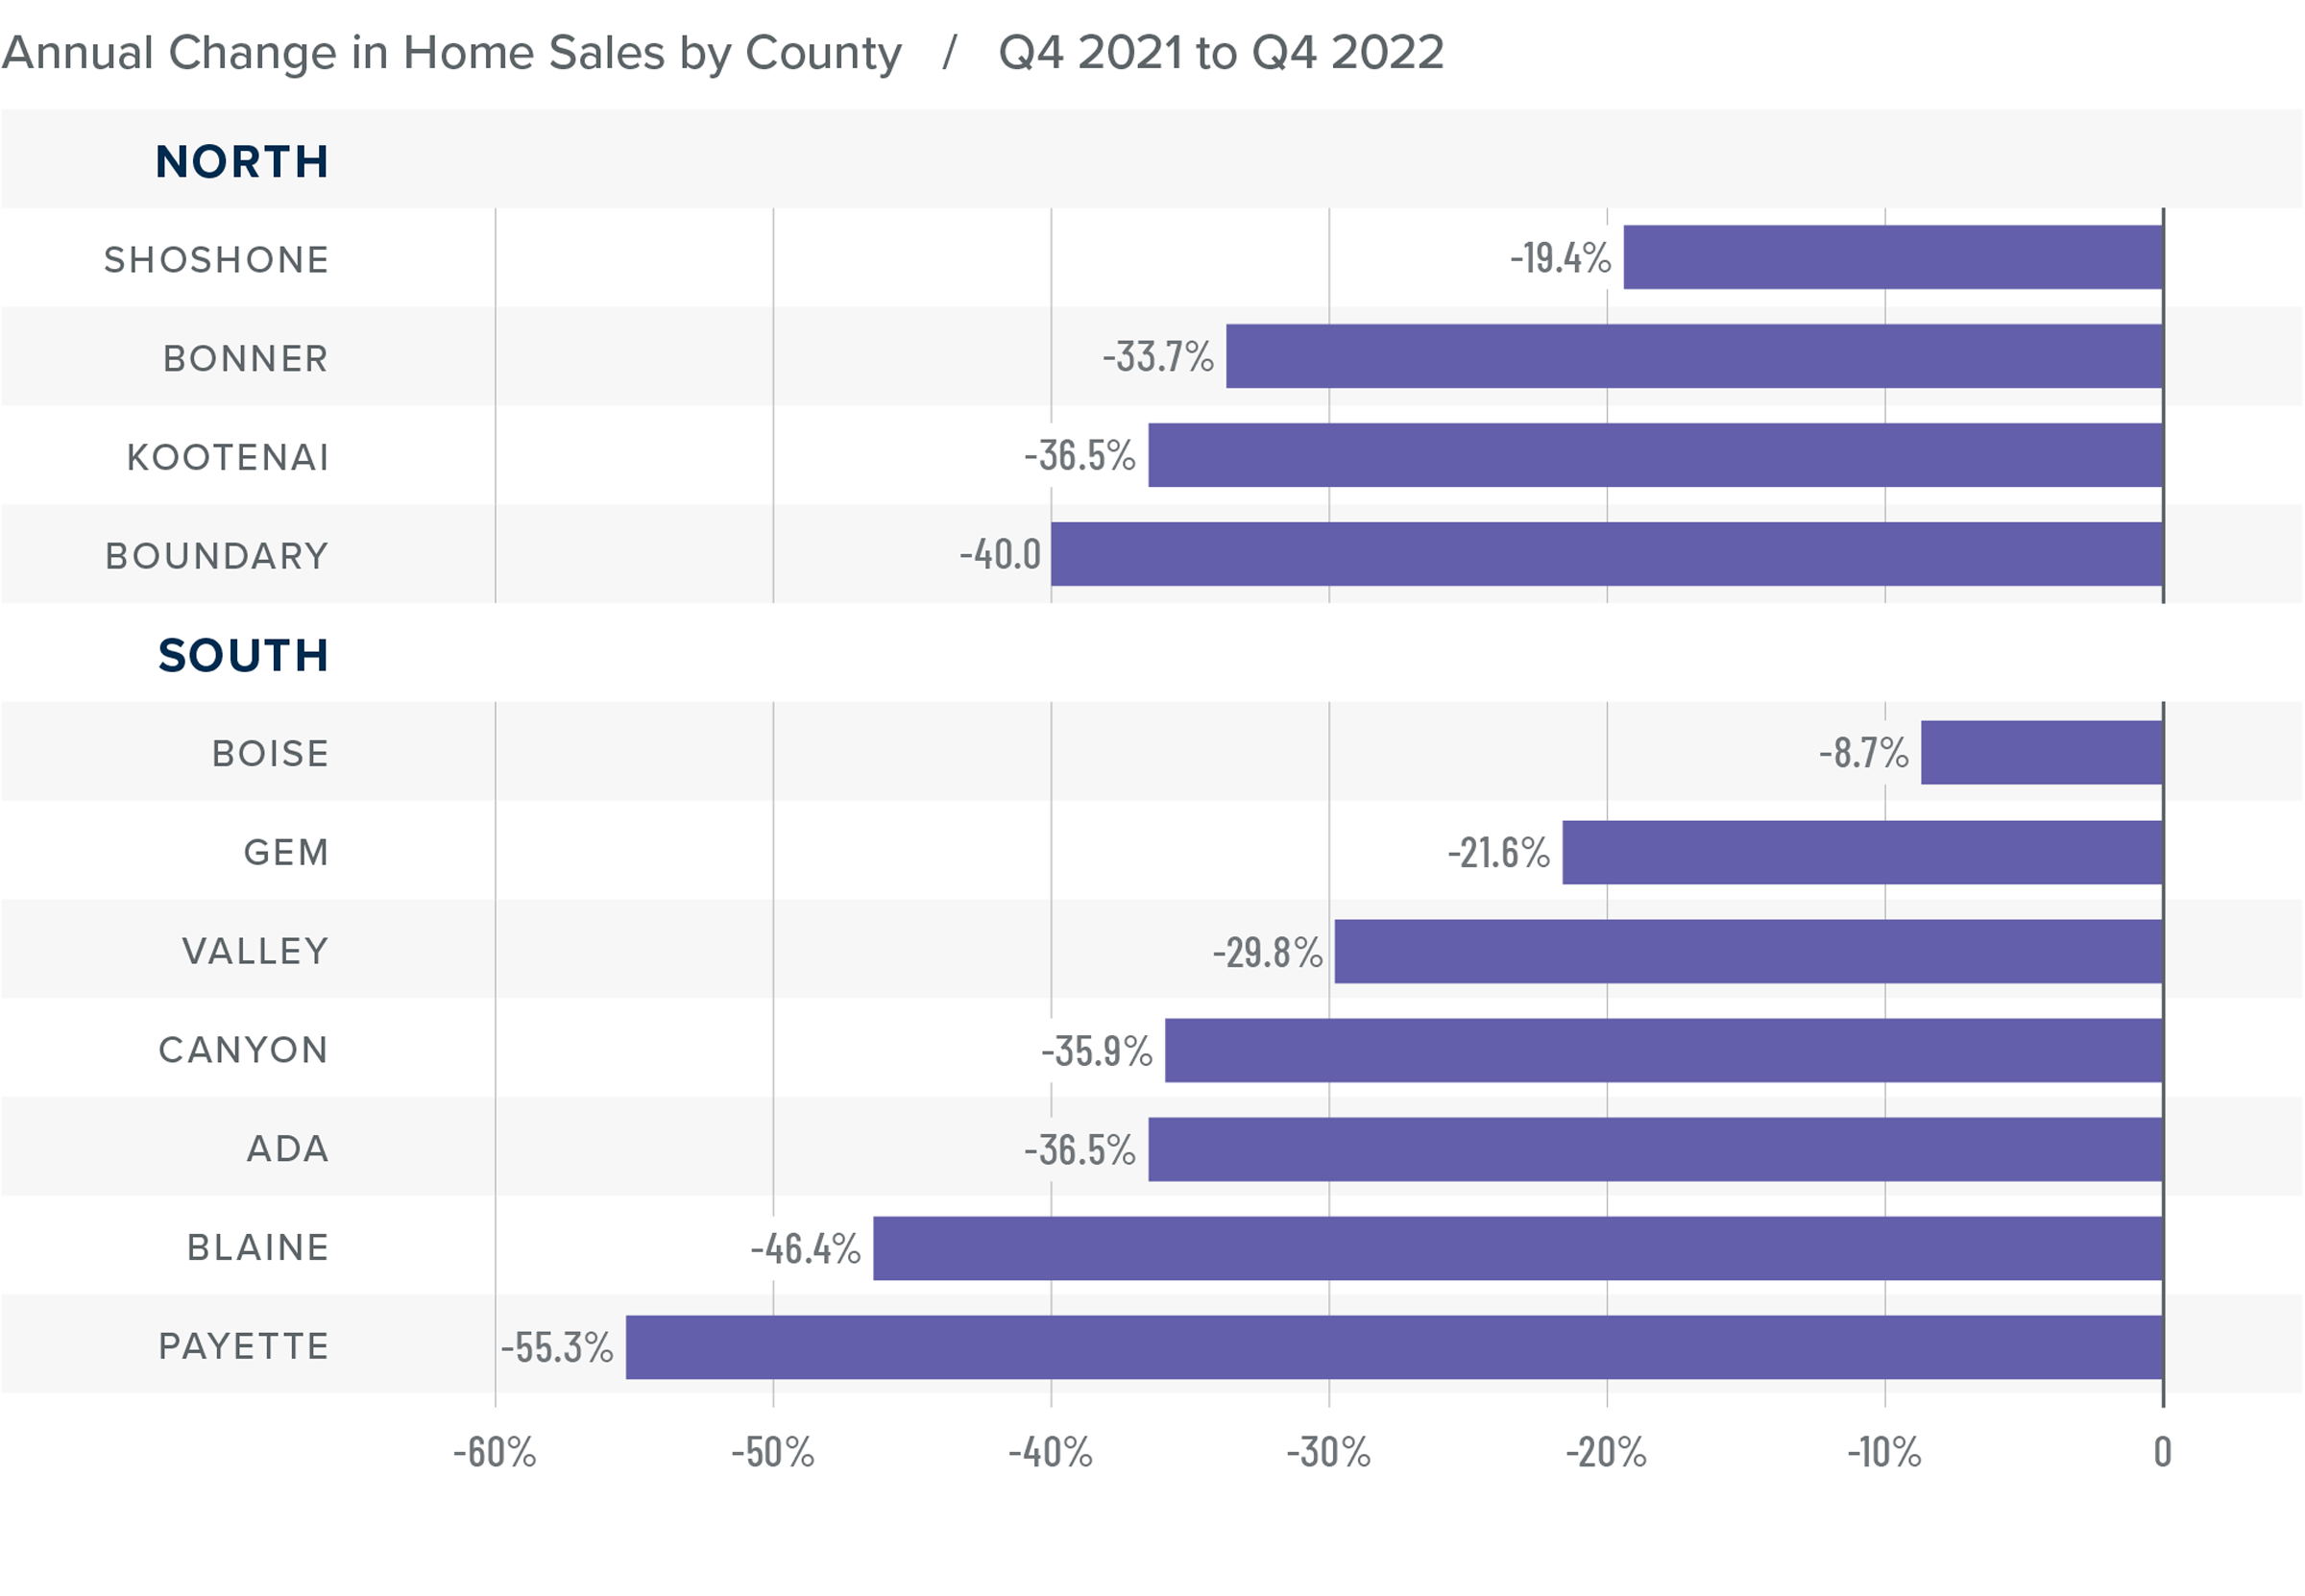
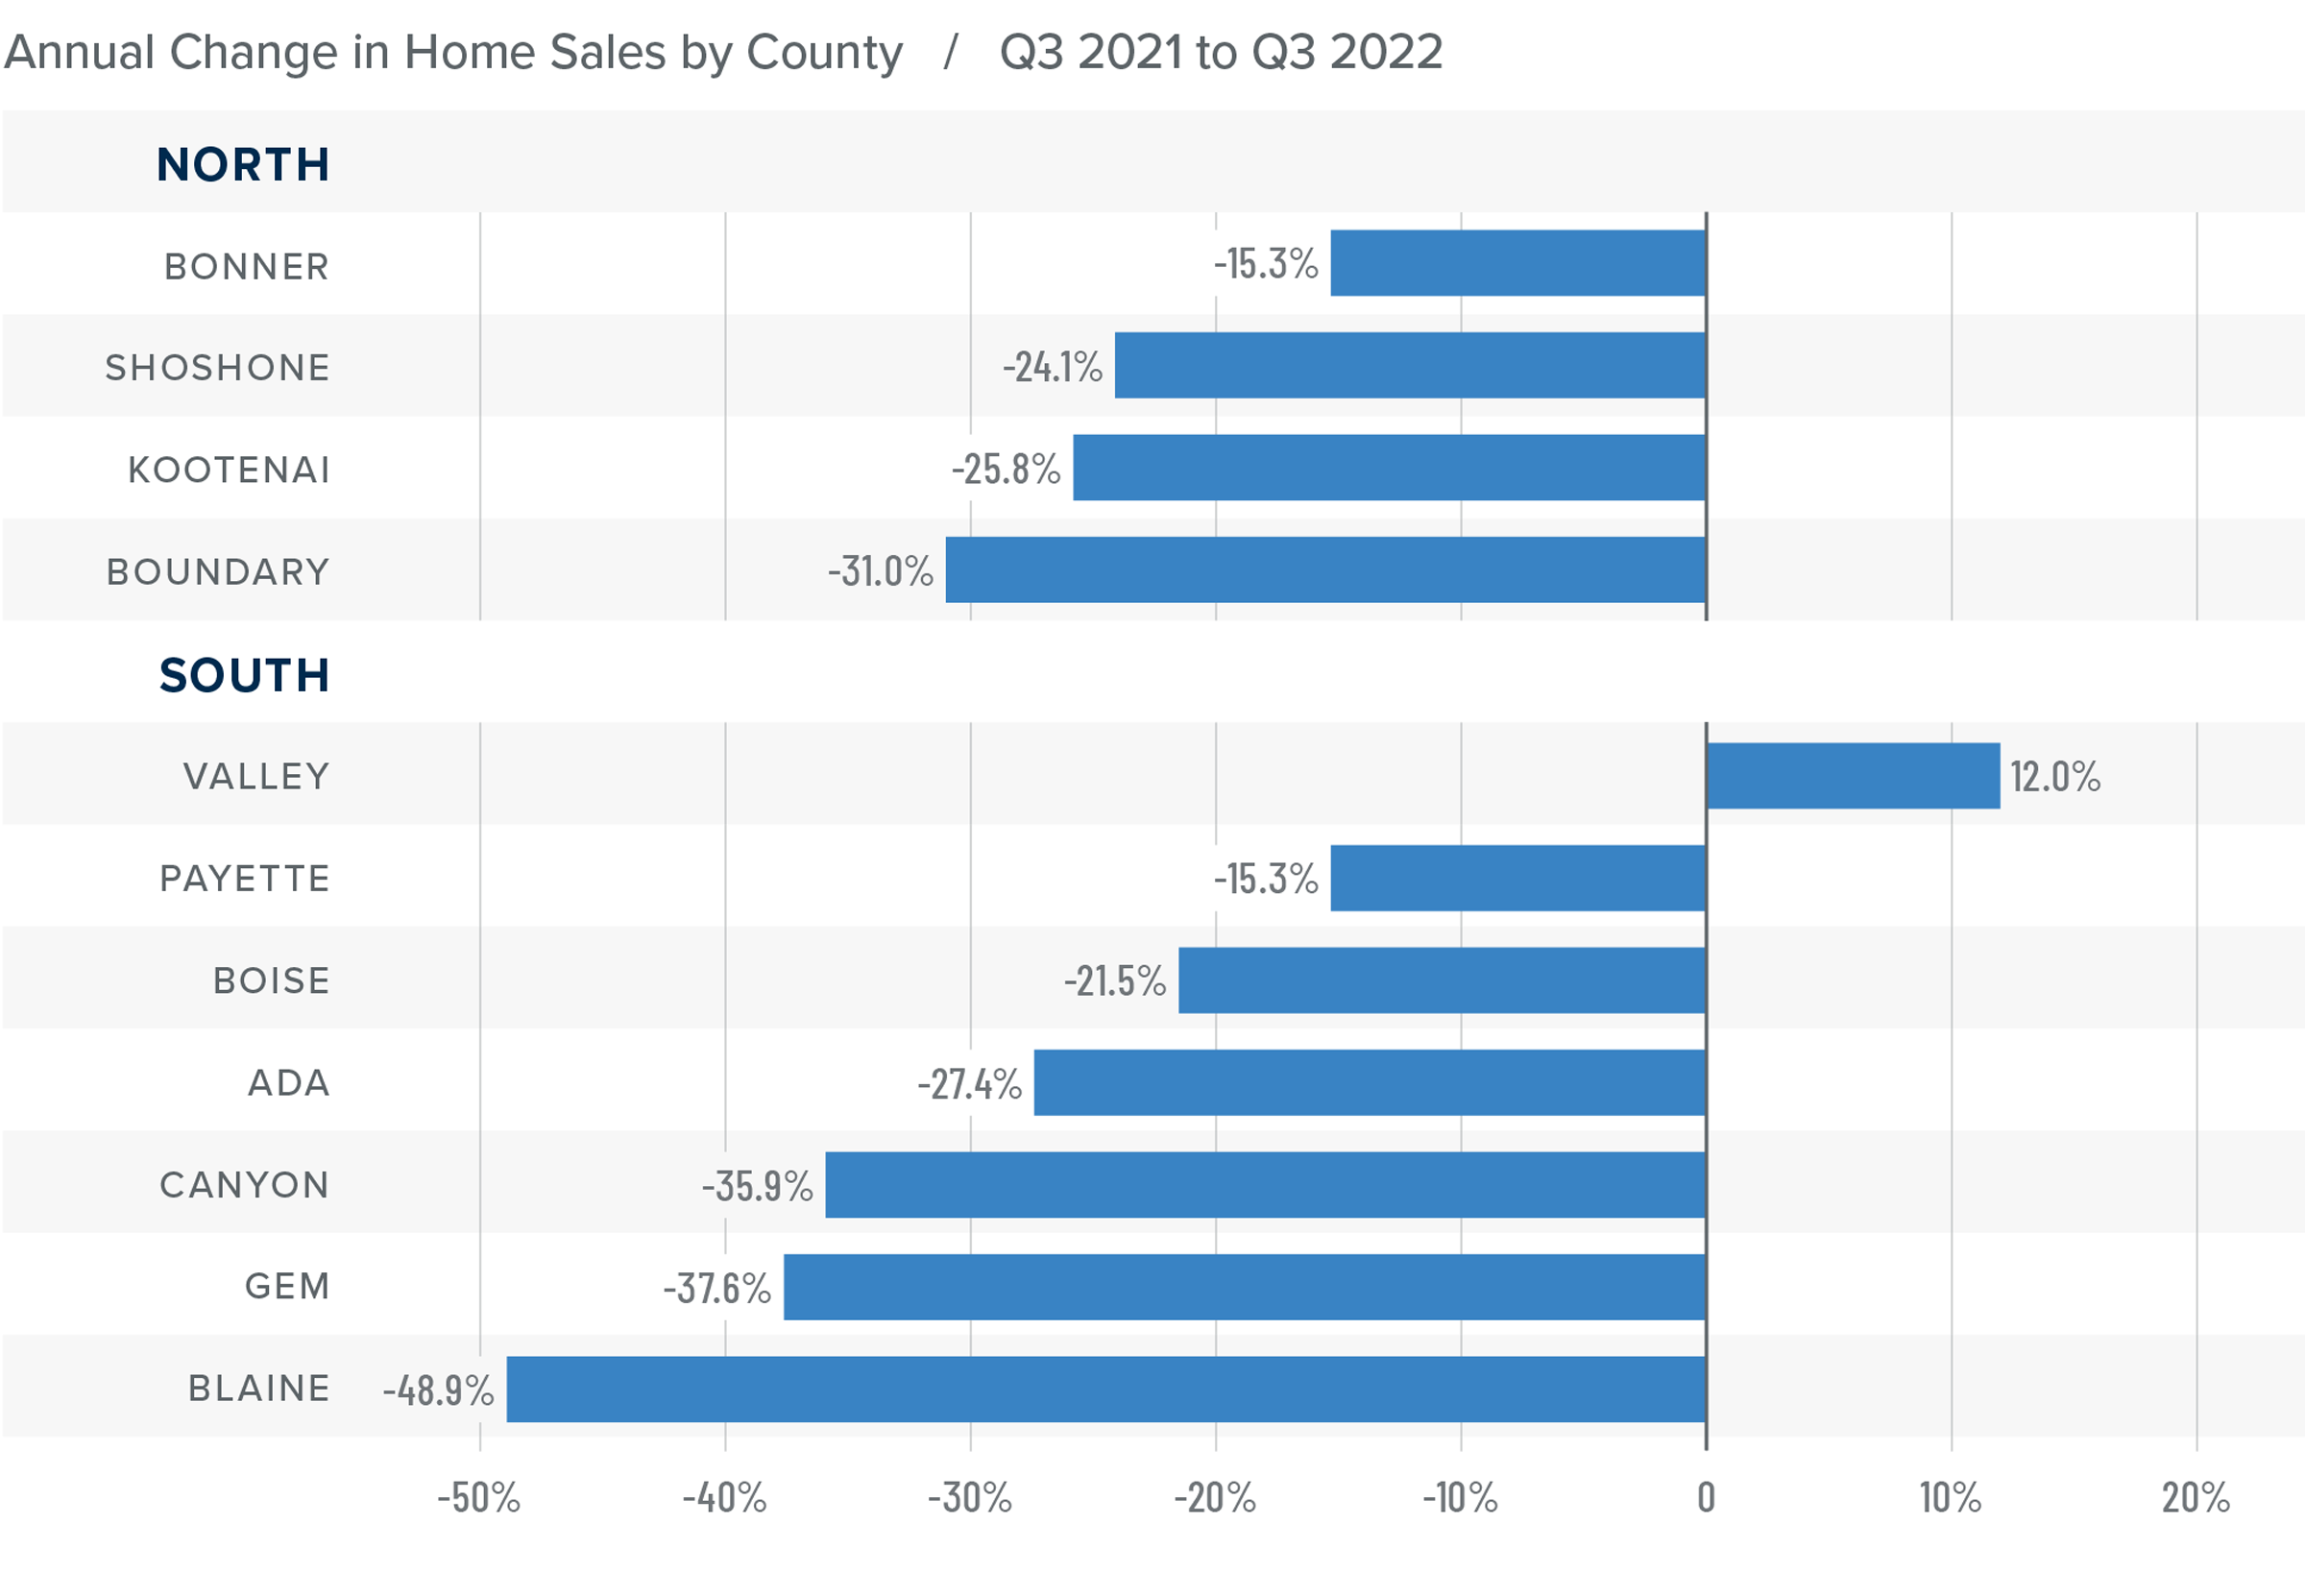
❱ In the final quarter of 2022, 4,777 homes sold, which was 36.1% lower than in the fourth quarter of 2021 and down 8.9% from the third quarter of 2022.
❱ Listing activity fell 12.7% from the third quarter, but was 52.9% higher than fourth quarter of 2021.
❱ Compared to the same period a year prior, sales fell in all markets covered by this report. Relative to the third quarter of 2022, sales rose in all Northern Idaho markets but fell in every southern market other than Gem County.
❱ Pending sales were 19.2% lower than in the third quarter of the year, which means it’s unlikely that the first quarter of 2023 will show any substantial increase in sales.
Idaho Home Prices
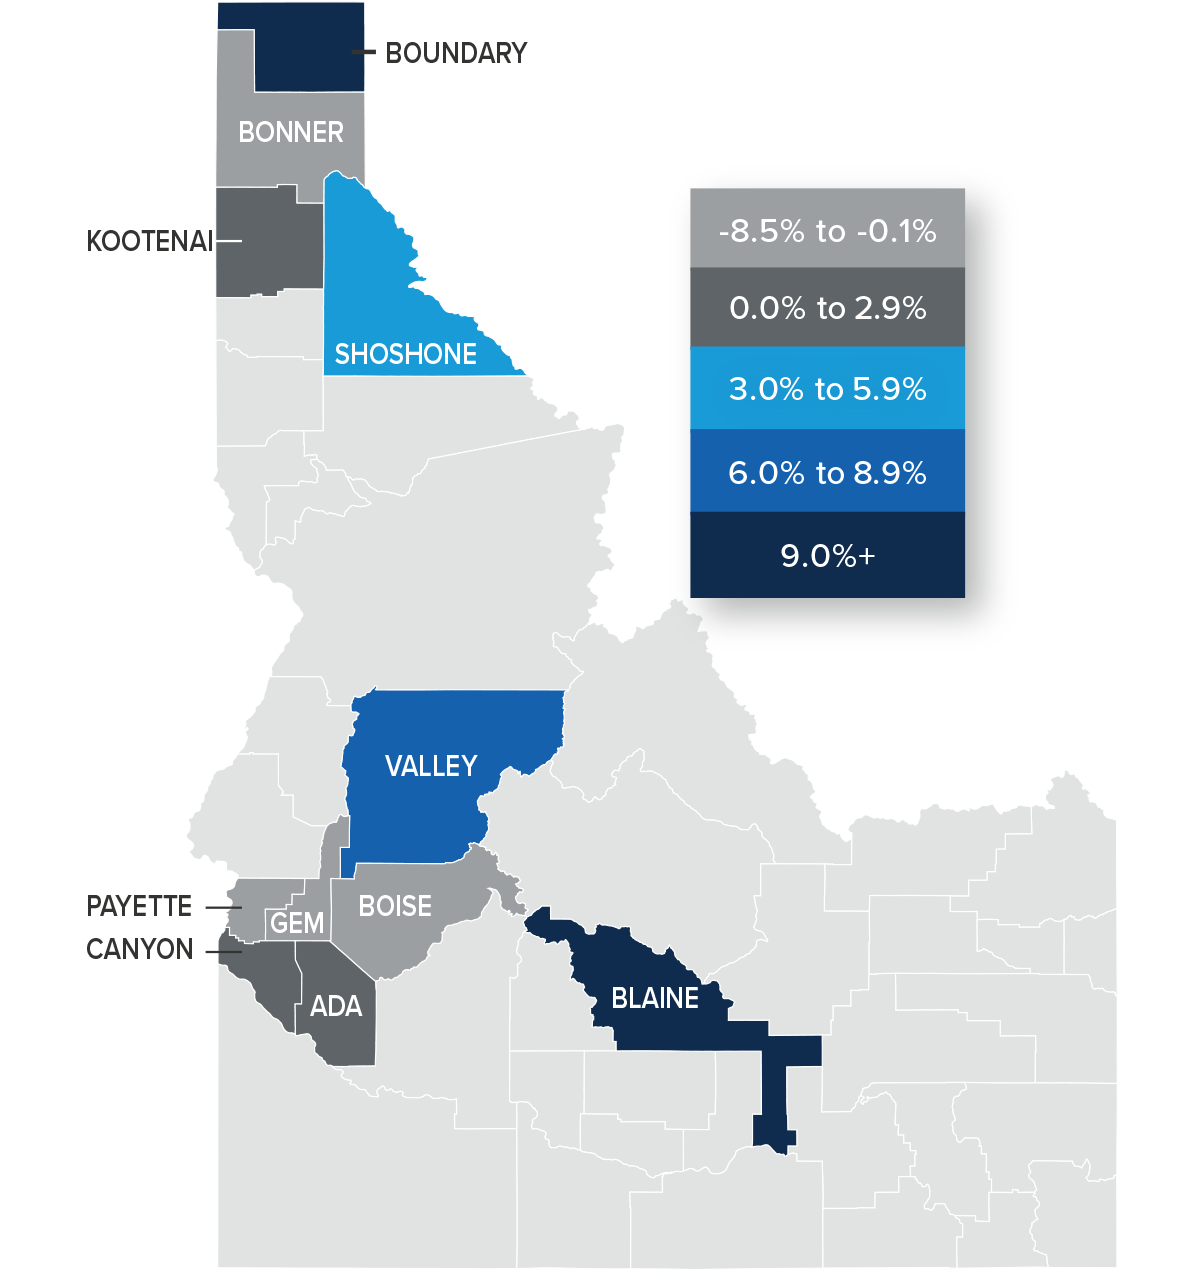
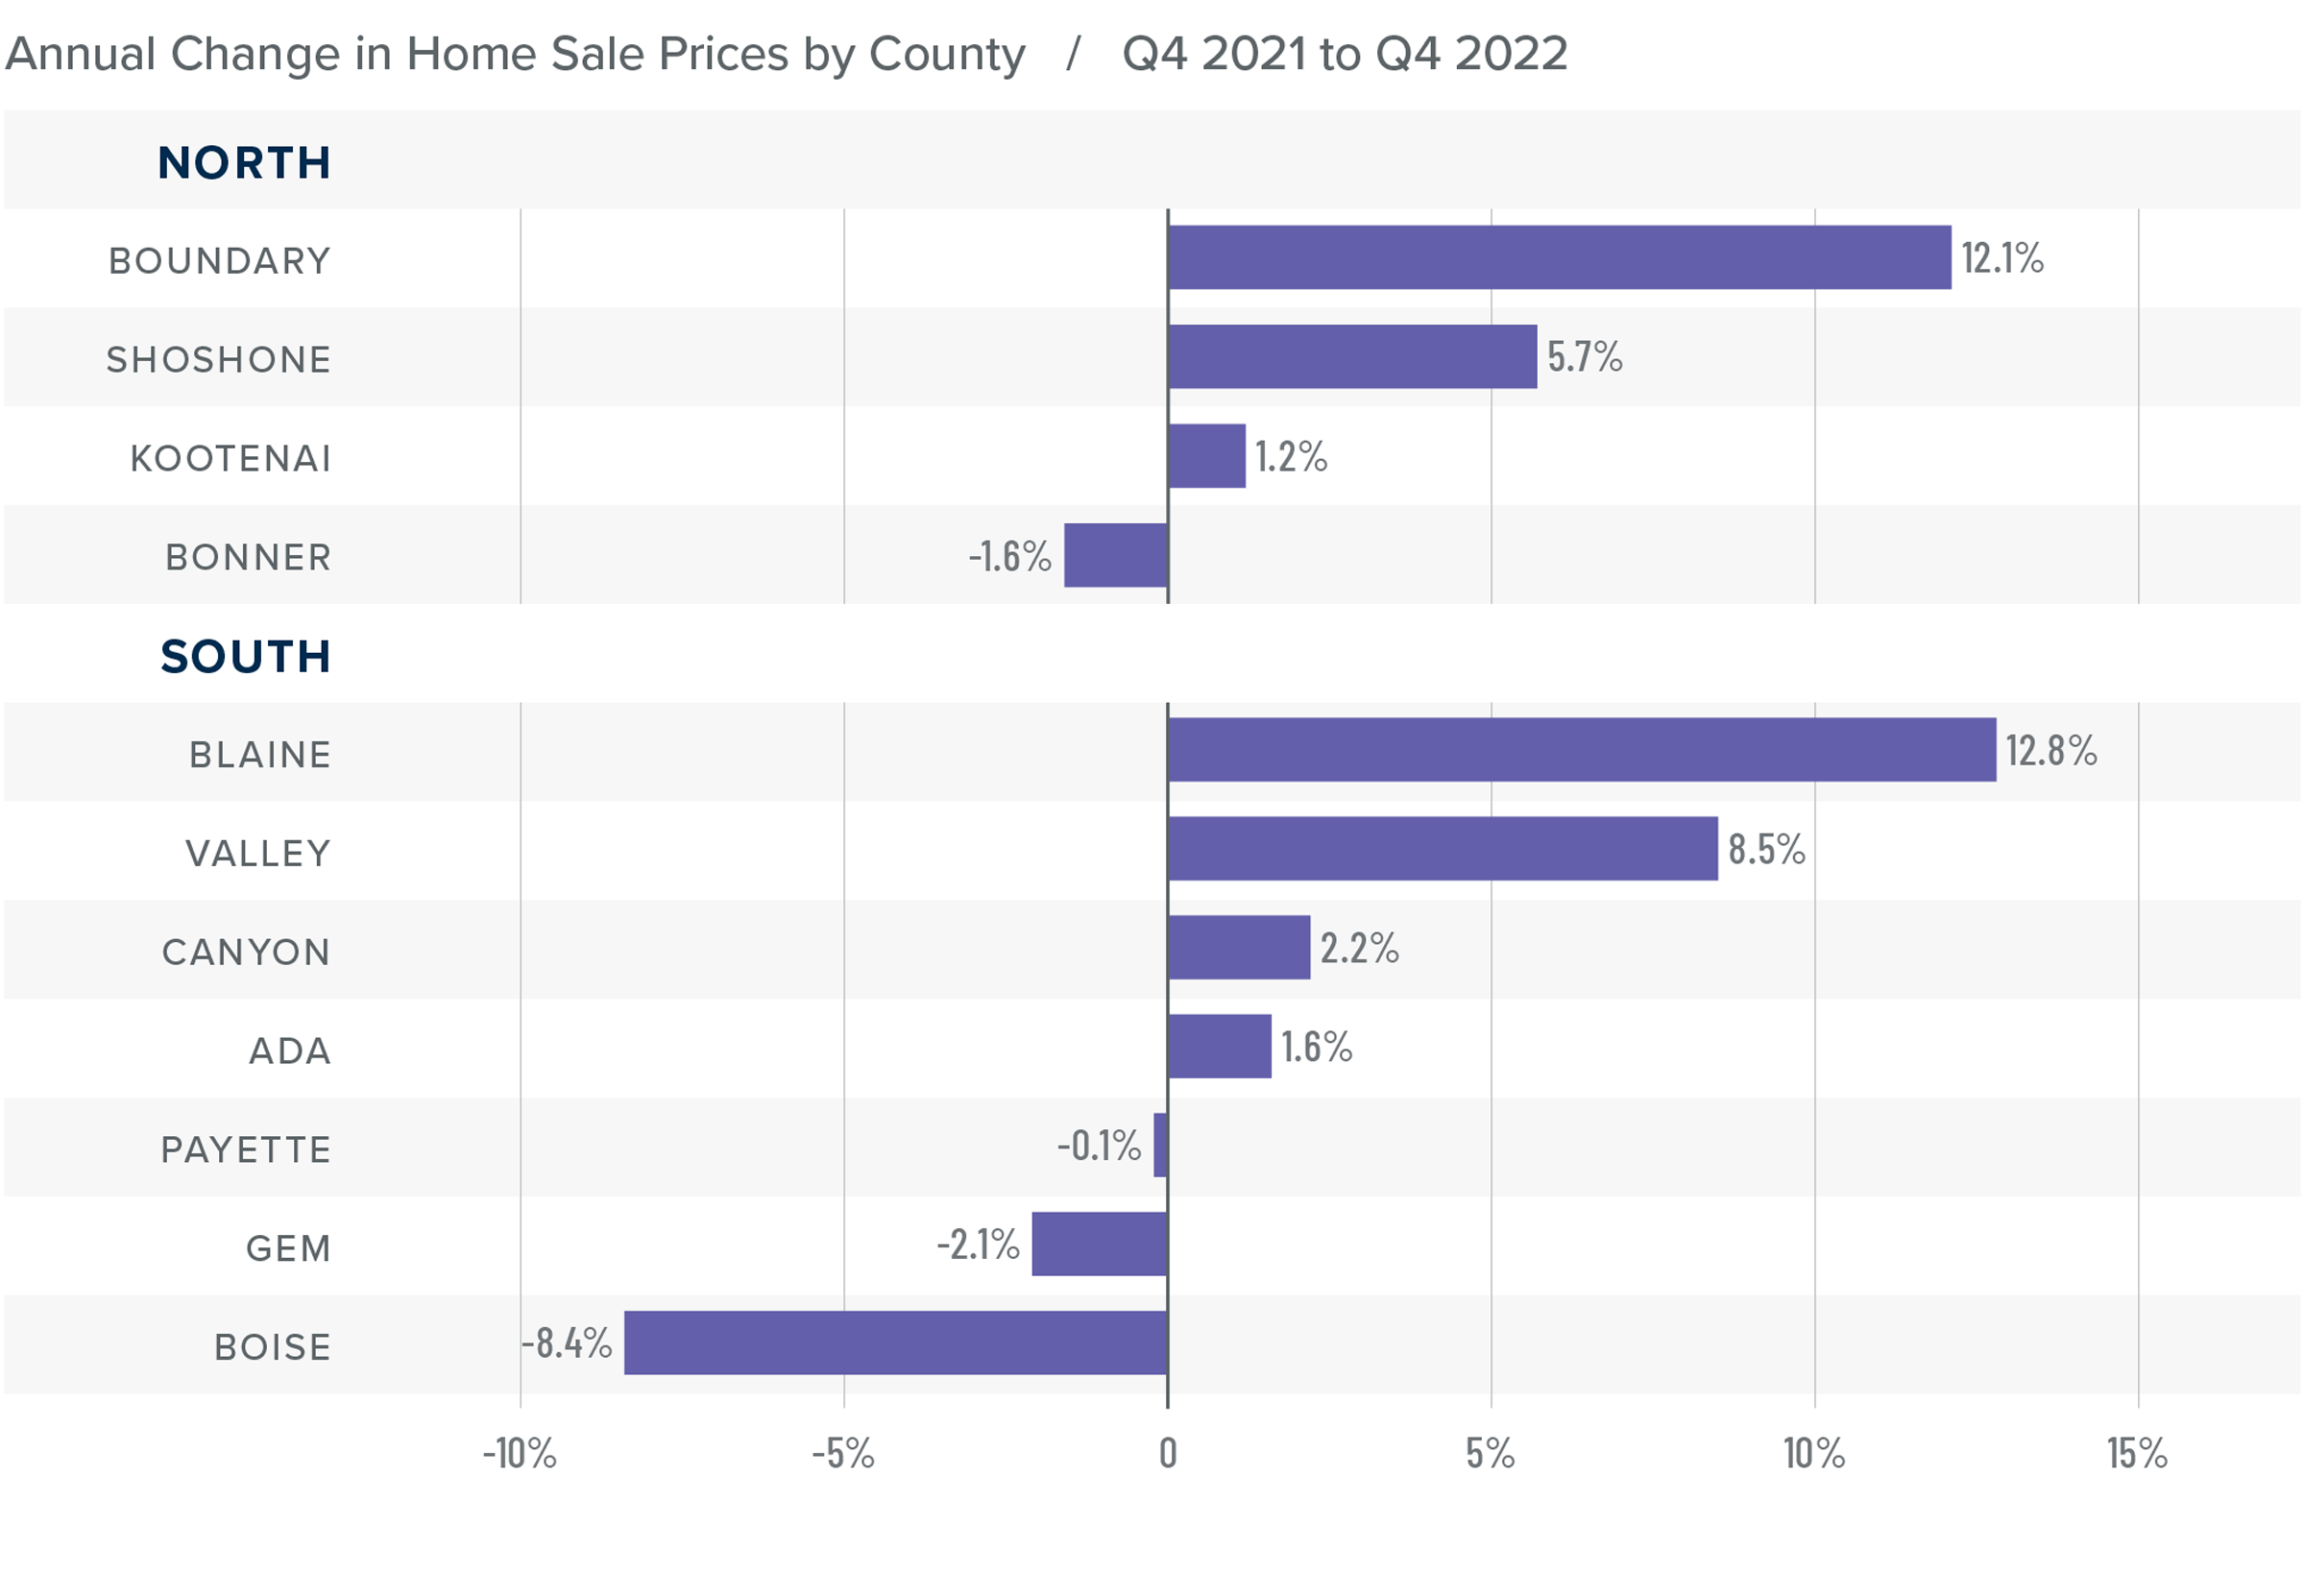
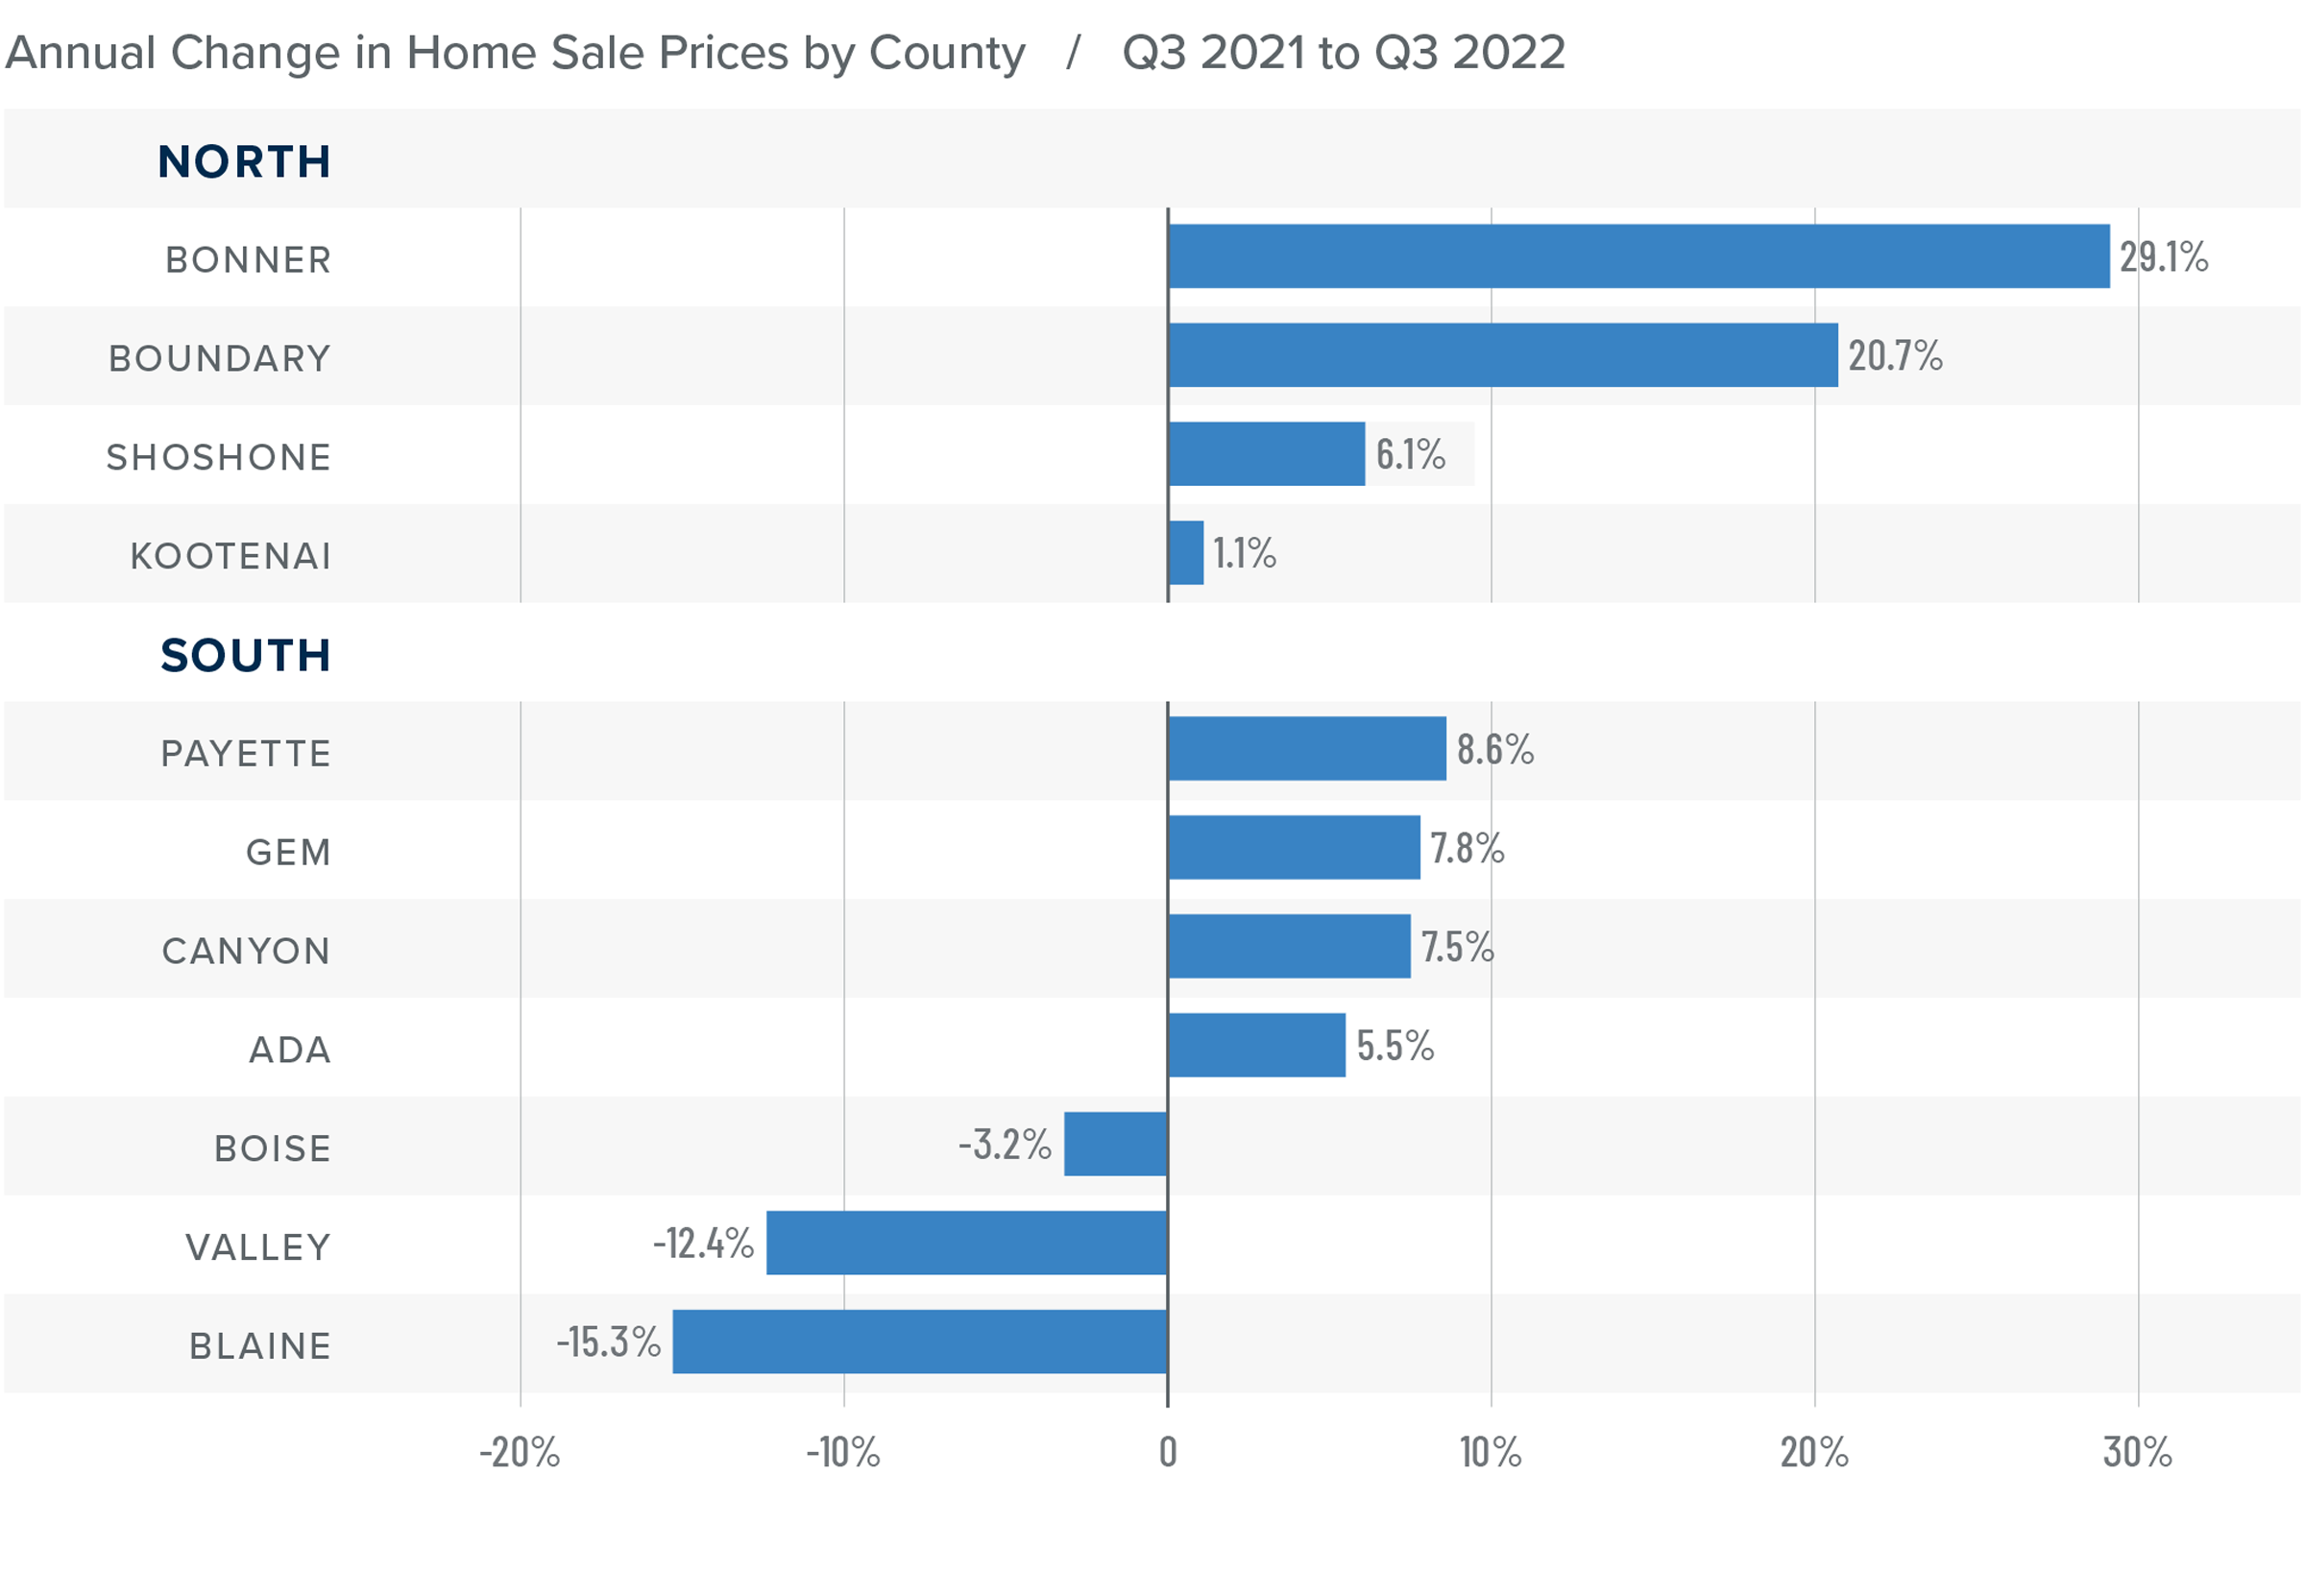
❱ The average home price in the region rose 1.4% year over year to $614,027. Relative to the third quarter of 2022, prices fell 1.8%.
❱ Compared to the third quarter, prices rose in Bonner and Boundary counties in the northern part of the state. In Southern Idaho, prices fell in all counties other than Blaine and Valley.
❱ Year over year, prices rose by double digits in Boundary County and were higher in all Northern Idaho counties except Bonner. In the southern part of the state, prices rose in four counties but fell in Payette, Gem, and Boise counties.
❱ Median listing prices in the fourth quarter were down 1.6% from the third quarter, but they were higher in Blaine, Valley, and Kootenai counties.
Mortgage Rates
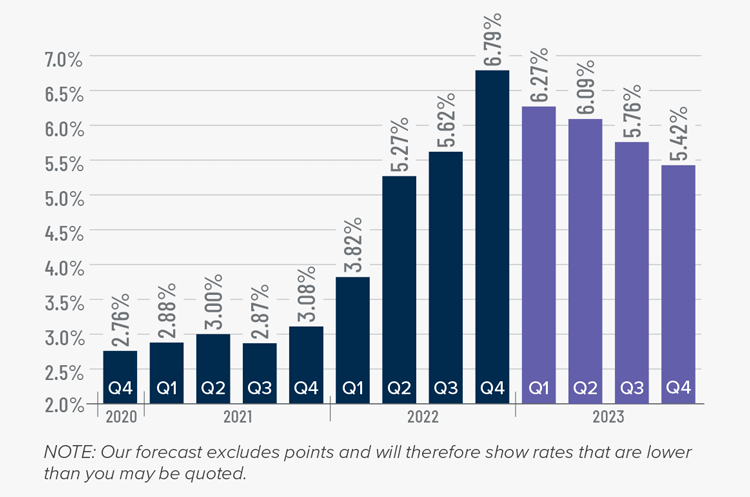
Rates rose dramatically in 2022, but I believe that they have now peaked. Mortgage rates are primarily based on the prices and yields of bonds, and while bonds take cues from several places, they are always impacted by inflation and the economy at large. If inflation continues to fall, as I expect it will, rates will continue to drop.
My current forecast is that mortgage rates will trend lower as we move through the year. While this may be good news for home buyers, rates will still be higher than they have become accustomed to. Even as the cost of borrowing falls, home prices in expensive markets will probably fall a bit more to compensate for rates that will likely hold above 6% until early summer.
Idaho Days on Market
❱ The average time it took to sell a home in the region rose 14 days compared to the same quarter of 2021. Average days on market rose 21 days from the third quarter of 2022.
❱ Year over year, days on market rose in all Southern Idaho counties. In Northern Idaho, market time rose in every county other than Shoshone.
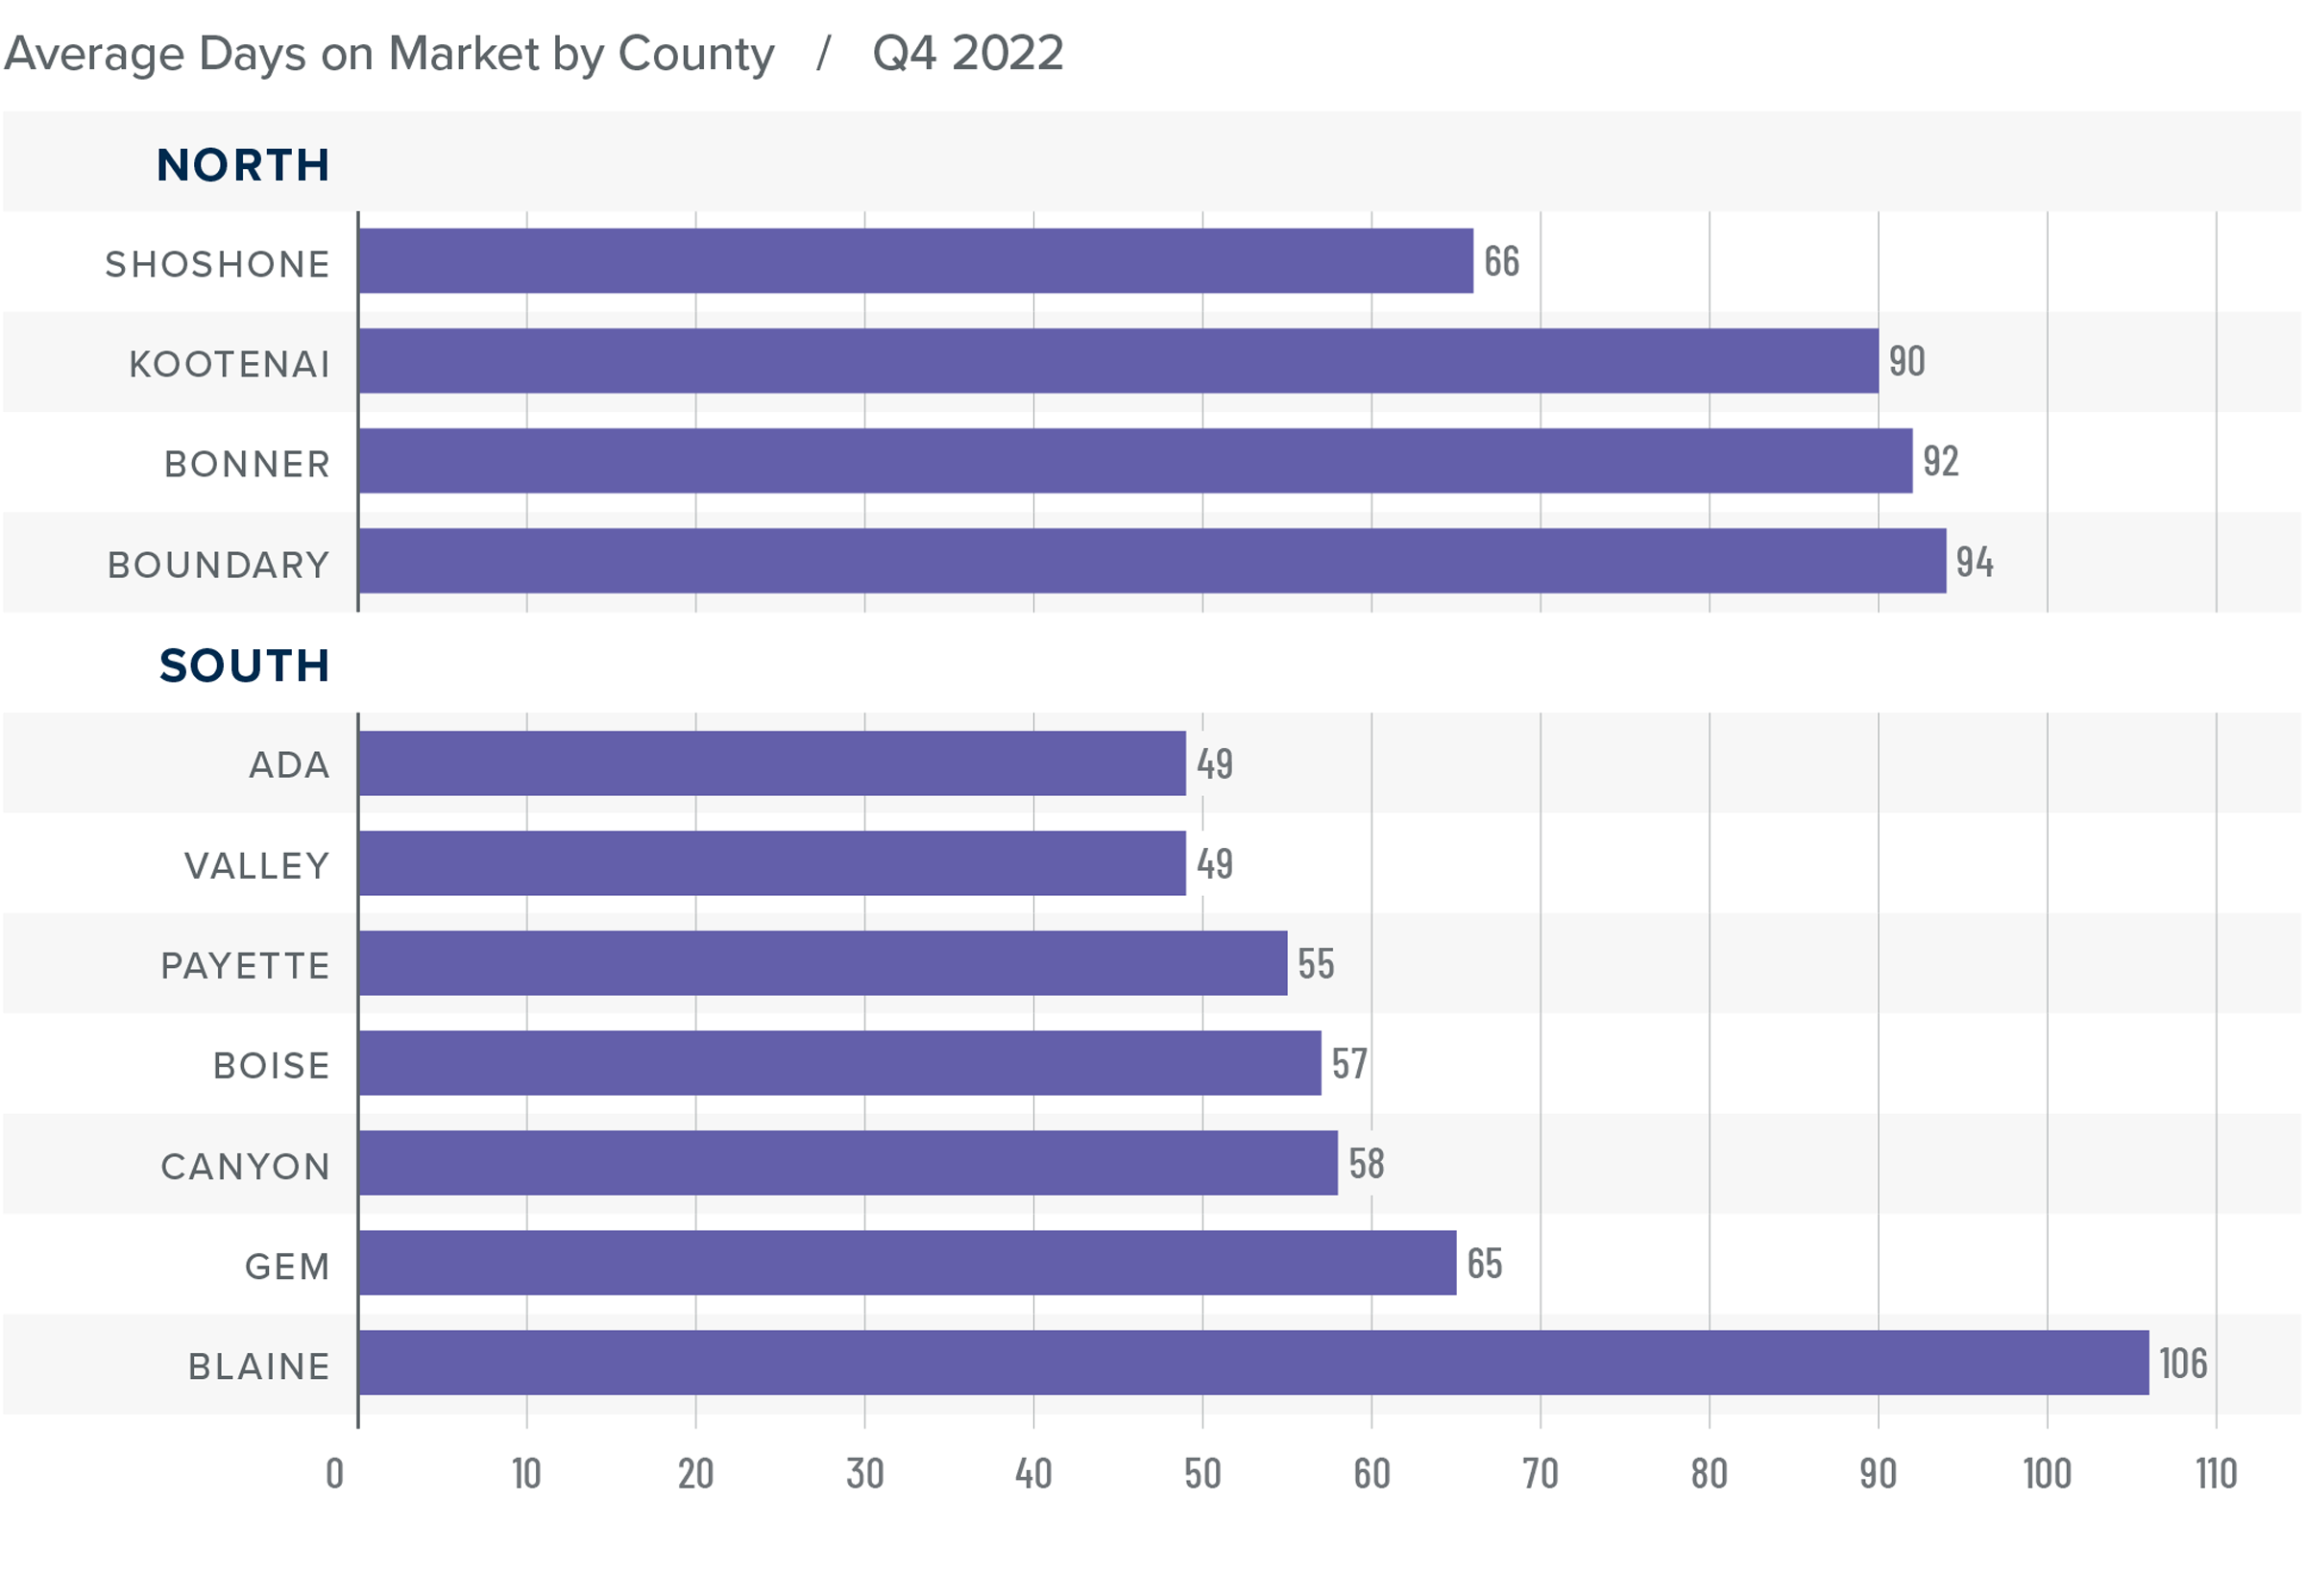
❱ It took an average of 86 days to sell a home in Northern Idaho and 63 days in the southern counties covered by this report.
❱ Homes again sold the fastest in Ada County in Southern Idaho and in Shoshone County in the northern part of the state.
Conclusions
This speedometer reflects the state of the region’s real estate market using housing inventory, price gains, home sales, interest rates, and larger economic factors.
Housing affordability has become a significant concern in Idaho, and high mortgage rates are impacting the ability for buyers to finance a home at current prices. While mortgage rates are expected to fall later this year, they will still be higher than buyers have become accustomed to. This means prices will likely decline as we move through the year, but they should level off as we enter the fall.

Although there is ample choice for buyers, I am wondering if listing activity will taper in the coming months as sellers hold off until the market improves. It’s also foreseeable that many of them will decide not to sell because they would lose the historically low interest rate on their current mortgage. Given all of this, I am moving the needle towards a more neutral market. If the number of homes for sale rises significantly in the spring, it’s likely the market will start to favor buyers.
About Matthew Gardner
As Chief Economist for Windermere Real Estate, Matthew Gardner is responsible for analyzing and interpreting economic data and its impact on the real estate market on both a local and national level. Matthew has over 30 years of professional experience both in the U.S. and U.K.
In addition to his day-to-day responsibilities, Matthew sits on the Washington State Governors Council of Economic Advisors; chairs the Board of Trustees at the Washington Center for Real Estate Research at the University of Washington; and is an Advisory Board Member at the Runstad Center for Real Estate Studies at the University of Washington where he also lectures in real estate economics.
Q3 2022 Idaho Real Estate Market Update

The following analysis of select counties of the Idaho real estate market is provided by Windermere Real Estate Chief Economist Matthew Gardner. We hope that this information may assist you with making better-informed real estate decisions. For further information about the housing market in your area, please don’t hesitate to contact your Windermere Real Estate agent.
Regional Economic Overview
Employment in Idaho continues to grow, but the pace has started to taper. The addition of 22,400 jobs over the past 12 months represents a growth rate of 2.8%. Idaho’s third-quarter unemployment rate was 2.7%, down from 3.5% a year ago. This is higher than the all-time low in May and June of this year, but very impressive all the same. Although jobs are being added at a slower pace, I am not concerned given the current unemployment rate and the growing labor force.
Idaho Home Sales
❱ In the third quarter of 2022, 5,243 homes sold, which was 28.7% lower than a year ago and 18.1% lower than in the second quarter of the year.
❱ Listing activity was up 53% compared to a year ago. The average number of homes on the market was 9.1% higher than in the second quarter of 2022.
❱ Compared to the same period a year ago, sales fell in the northern part of the state and were lower in all areas of Southern Idaho except Valley County. Compared to the second quarter, sales also fell across Northern Idaho, but rose in Valley, Payette, and Boise counties in the southern part of the state.
❱ Pending sales were 19% lower than in the second quarter of this year. With more listings and fewer sales, the market is certainly slowing, much of which can be attributed to rising mortgage rates, which hit a level we have not seen since 2008.
Idaho Home Prices
❱ The average home price in the region rose 4.3% year over year to $625,275 but was down 2.9% compared to the second quarter of the year.
❱ Compared to the second quarter of 2022, prices rose in all Northern Idaho counties except Kootenai, where they were down 1.7%. In the southern part of the state, prices fell across the board.
❱ Prices rose by double digits in Bonner and Boundary counties, while the balance of Northern Idaho counties saw single-digit growth. In the southern part of the state, prices rose in four of the counties, but fell in Boise, Valley, and Blaine counties.
❱ Median listing prices in the second quarter were lower in all southern markets, but higher in all but Bonner County in the northern part of the state.
Mortgage Rates
This remains an uncertain period for mortgage rates. When the Federal Reserve slowed bond purchases in 2013, investors were accused of having a “taper tantrum,” and we are seeing a similar reaction today. The Fed appears to be content to watch the housing market go through a period of pain as they throw all their tools at reducing inflation.
As a result, mortgage rates are out of sync with treasury yields, which not only continues to push rates much higher, but also creates violent swings in both directions. My current forecast calls for rates to peak in the fourth quarter of this year before starting to slowly pull back. That said, they will remain in the 6% range until the end of 2023.
Idaho Days on Market
❱ The average number of days it took to sell a home in the region rose five days compared to the same quarter of 2021 but fell six days compared to the second quarter of 2022.
❱ In Northern Idaho, days on market rose in all counties other than Kootenai compared to a year ago. Market time rose in every county other than Blaine in Southern Idaho.
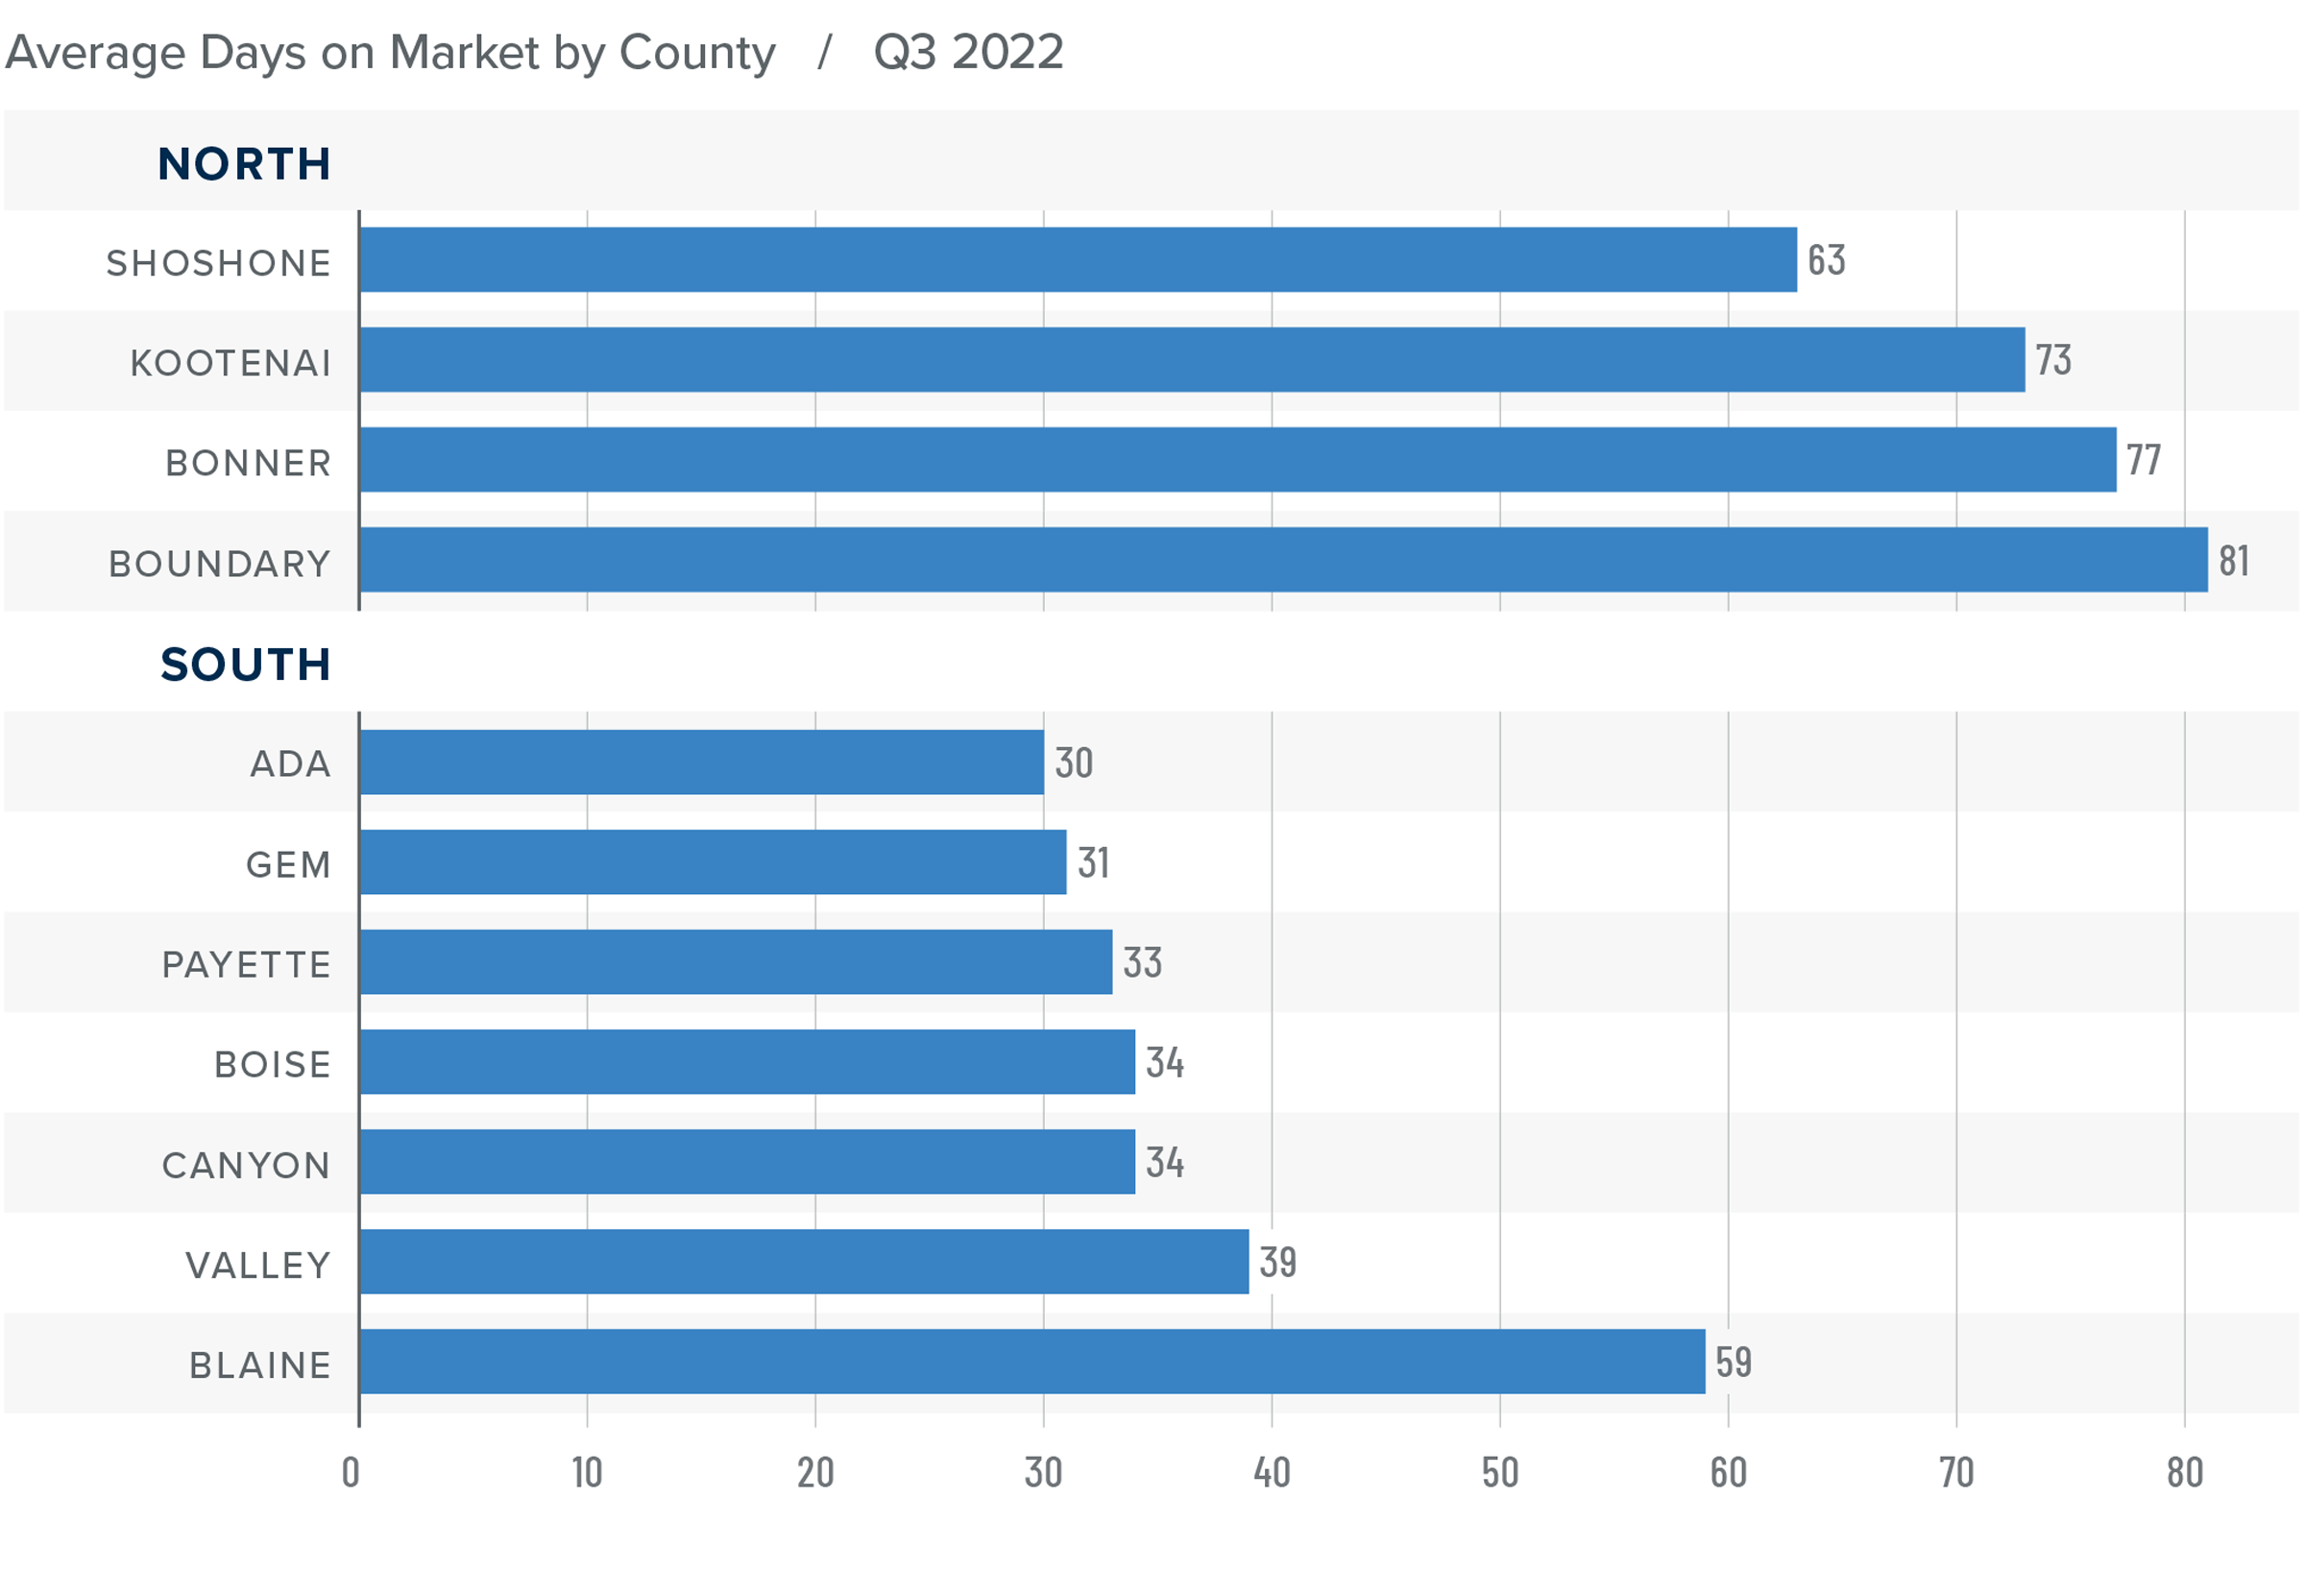
❱ It took an average of 74 days to sell a home in Northern Idaho, and 37 days in the southern part of the state.
❱ Homes sold the fastest in Ada County in the southern part of the state and in Shoshone County in Northern Idaho.
Conclusions
This speedometer reflects the state of the region’s real estate market using housing inventory, price gains, home sales, interest rates, and larger economic factors.
The third quarter appears to have been an inflection point: the impact of higher mortgage rates and lower affordability have now started to negatively affect home sales and prices. With mortgage rates likely to remain very high compared to recent years, the massive run-up in home values is at an end. Although the market will continue to be negatively impacted as we move through the winter and into the spring, I don’t see it falling in a manner similar to the Great Recession. Owners are sitting on significant equity. Even if prices fall in 2023, which I expect, the decline will be relatively modest.

With a contracting market, I expect that many homeowners who were thinking about selling will decide to stay put and ride out the slowdown. This will mean the number of homes for sale is unlikely to grow significantly from current levels. Given all the data discussed here, I am moving the needle more toward balance, but we are still not in a typical buyer’s market at the present time.
About Matthew Gardner
As Chief Economist for Windermere Real Estate, Matthew Gardner is responsible for analyzing and interpreting economic data and its impact on the real estate market on both a local and national level. Matthew has over 30 years of professional experience both in the U.S. and U.K.
In addition to his day-to-day responsibilities, Matthew sits on the Washington State Governors Council of Economic Advisors; chairs the Board of Trustees at the Washington Center for Real Estate Research at the University of Washington; and is an Advisory Board Member at the Runstad Center for Real Estate Studies at the University of Washington where he also lectures in real estate economics.
Q2 2022 Idaho Real Estate Market Update
The following analysis of select counties of the Idaho real estate market is provided by Windermere Real Estate Chief Economist Matthew Gardner. We hope that this information may assist you with making better-informed real estate decisions. For further information about the housing market in your area, please don’t hesitate to contact your Windermere Real Estate agent.
Regional Economic Overview
Employment in Idaho continues to rise, but the pace of growth has started to taper. The addition of 22,400 jobs over the past 12 months represents a growth rate of 2.8%. Idaho’s unemployment rate in June was 2.5%, which is down from 3.7% a year ago and the lowest it’s been since records started being kept in 1976. Although jobs are being added at a slower pace, I am not concerned given the current unemployment rate.
Idaho Home Sales
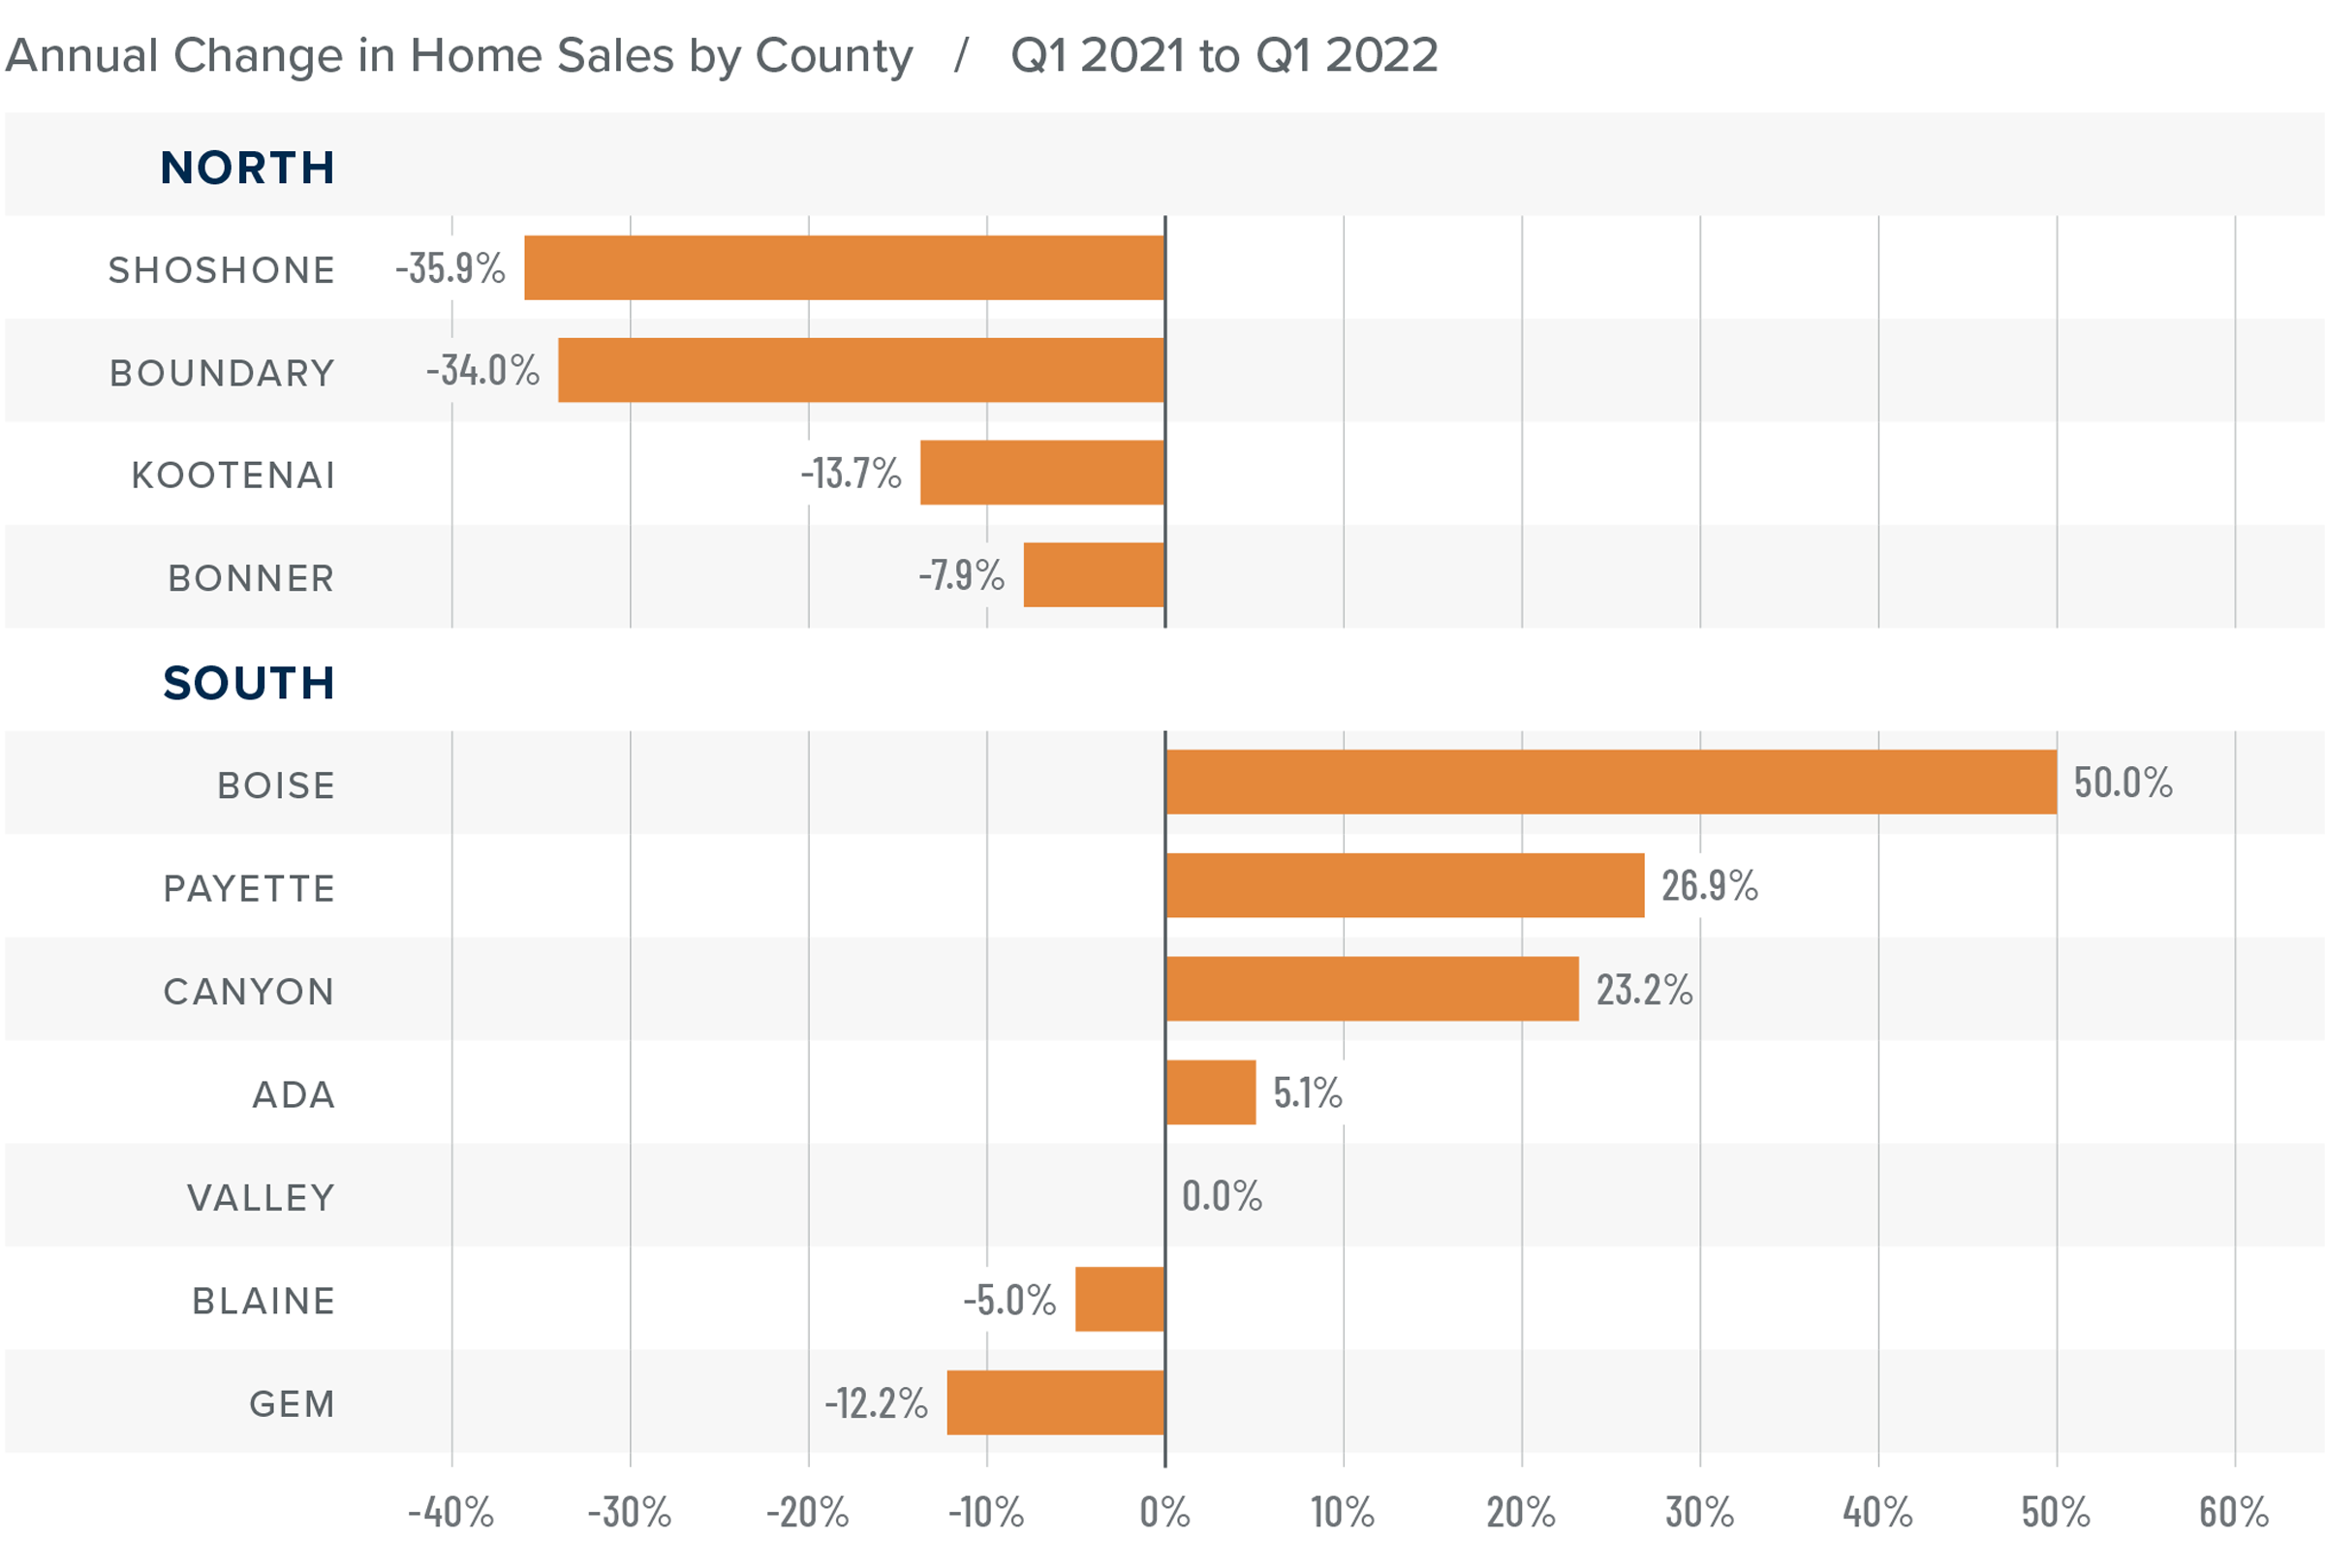
❱ In the second quarter of 2022, 6,403 homes sold, representing an annual growth rate of .8%. Sales were 23.5% higher than in the first quarter of 2022.
❱ Listing activity was up more than 90% compared to a year ago, and the average number of homes on the market was 164% higher than in the first quarter.
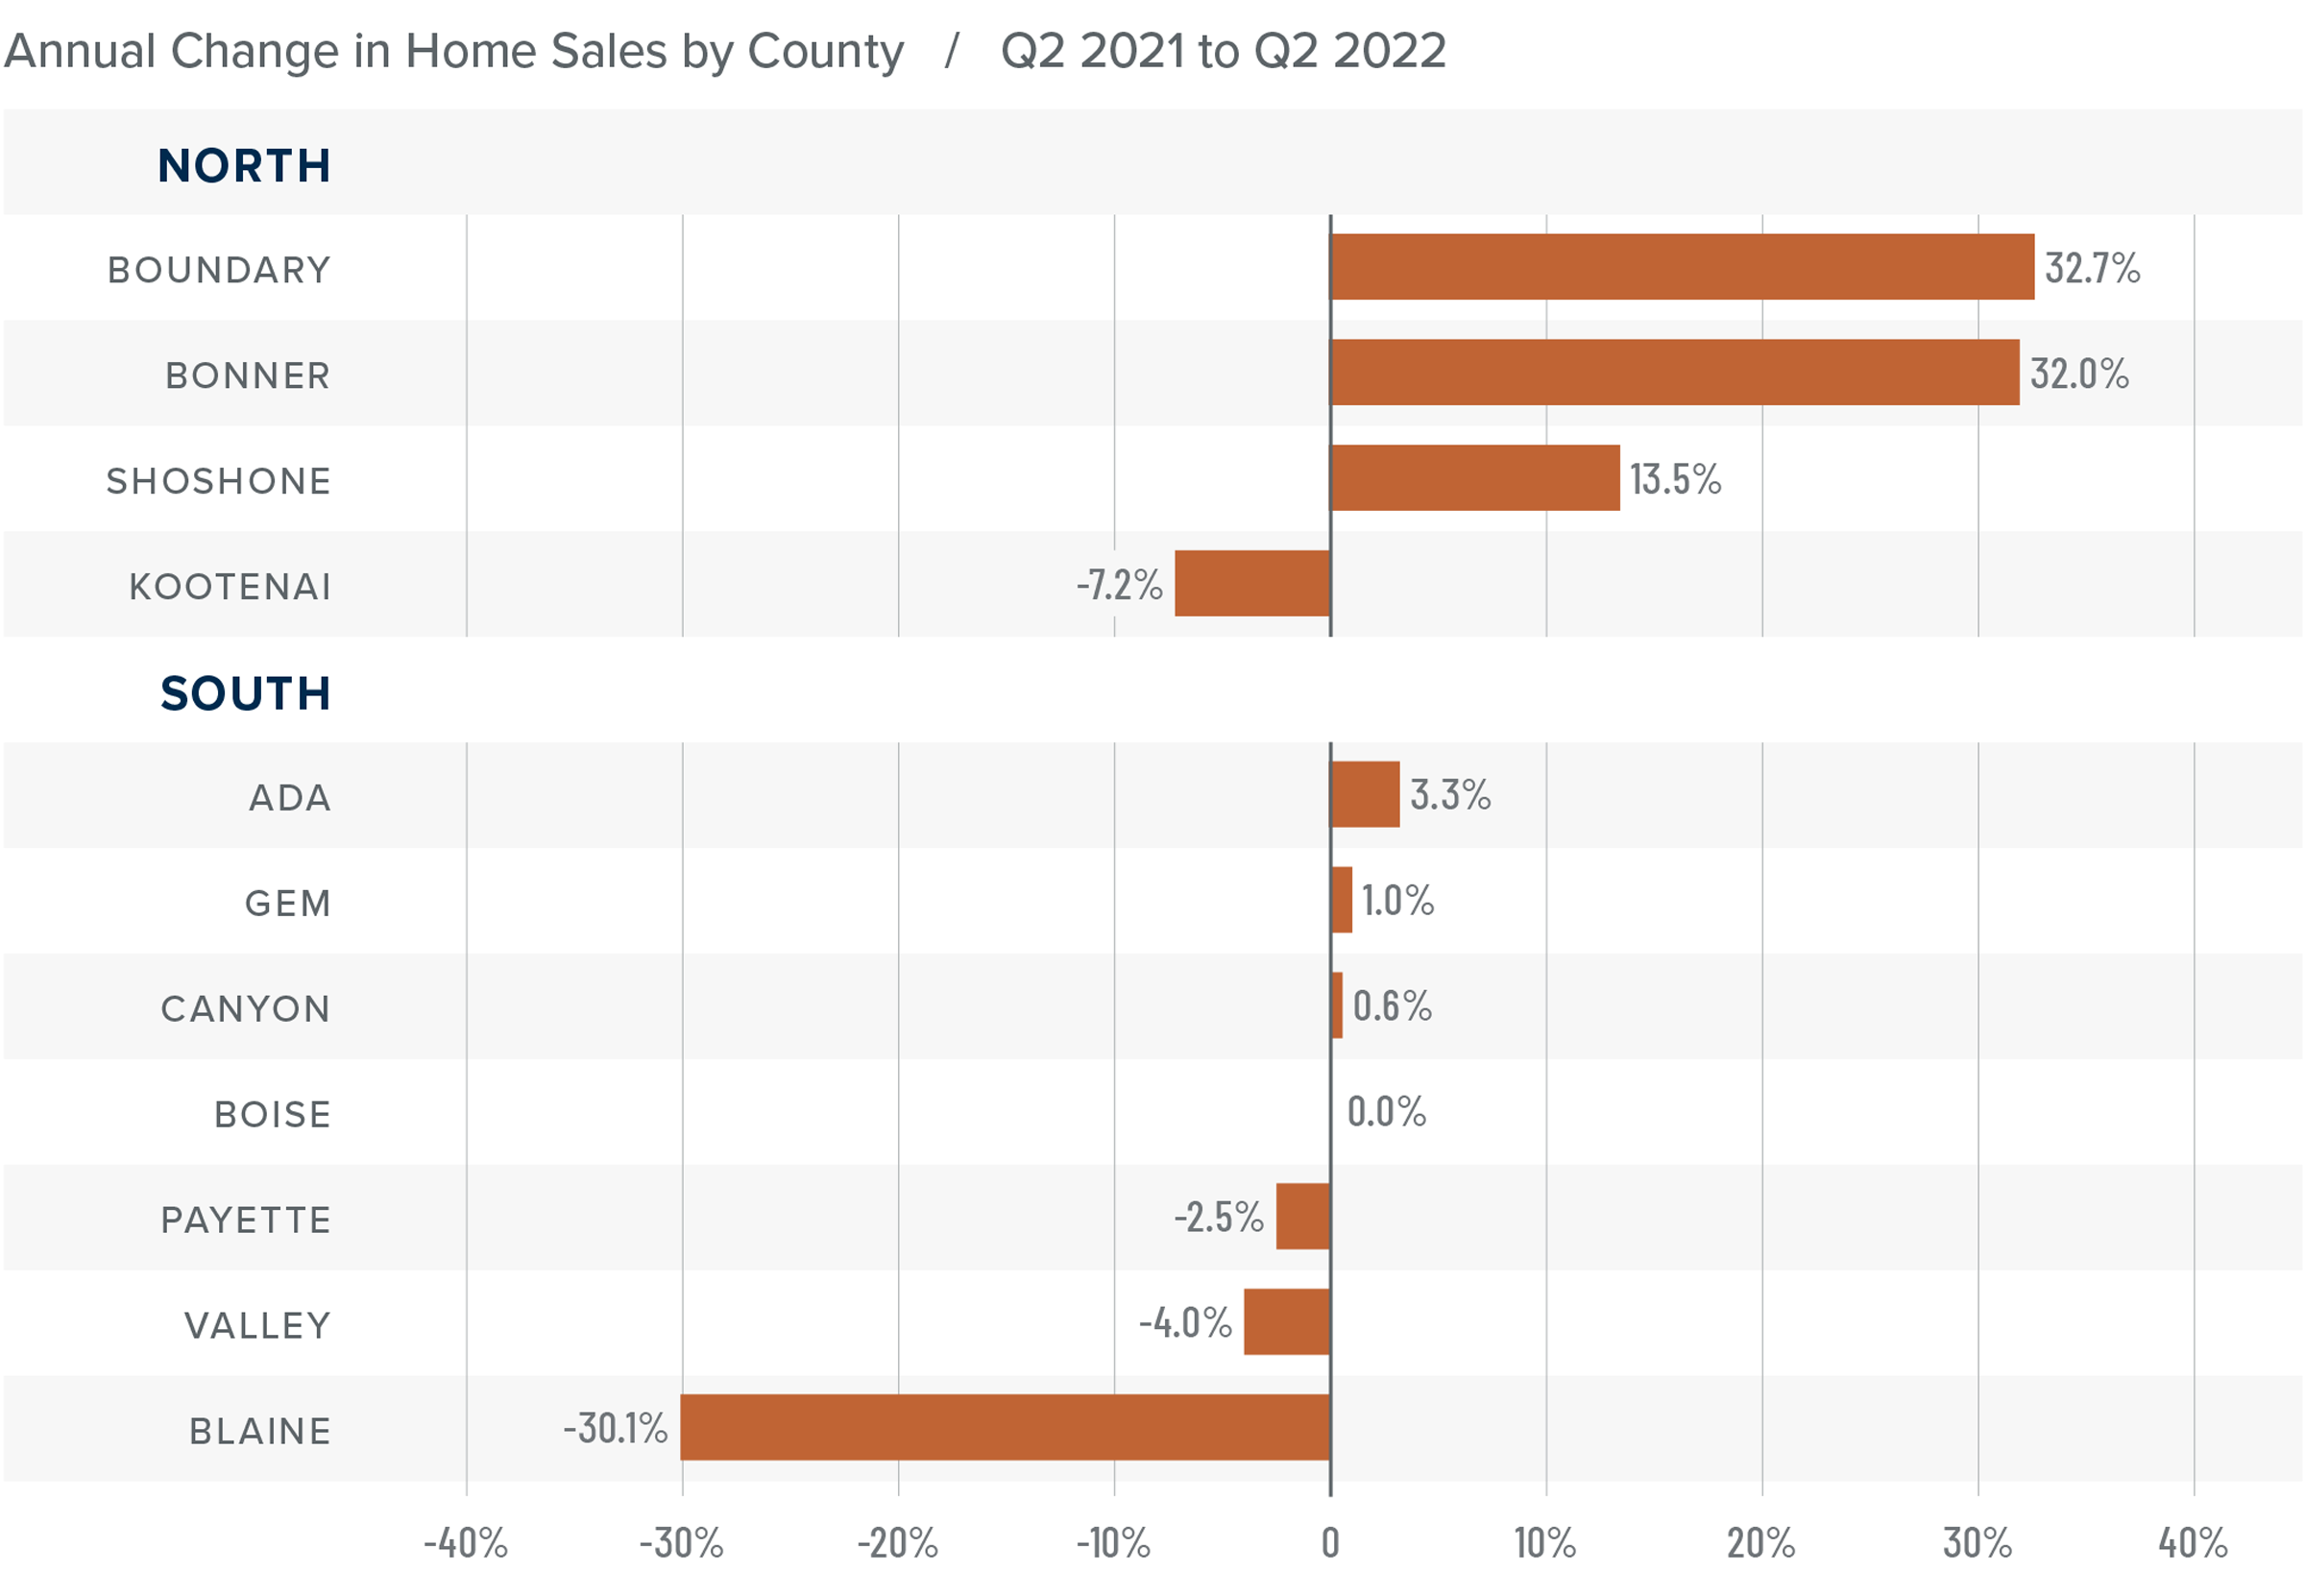
❱ Compared to the same period a year ago, sales rose in Boundary, Bonner, and Shoshone counties in the northern part of the state and were higher in Ada, Gem, and Canyon counties in Southern Idaho. Sales rose from the first quarter of 2022 in all counties except Payette, though that market saw only three fewer transactions.
❱ Pending sales were 4.4% higher than in the first quarter of the year. It appears that buyers are taking advantage of greater choice in the market.
Idaho Home Prices
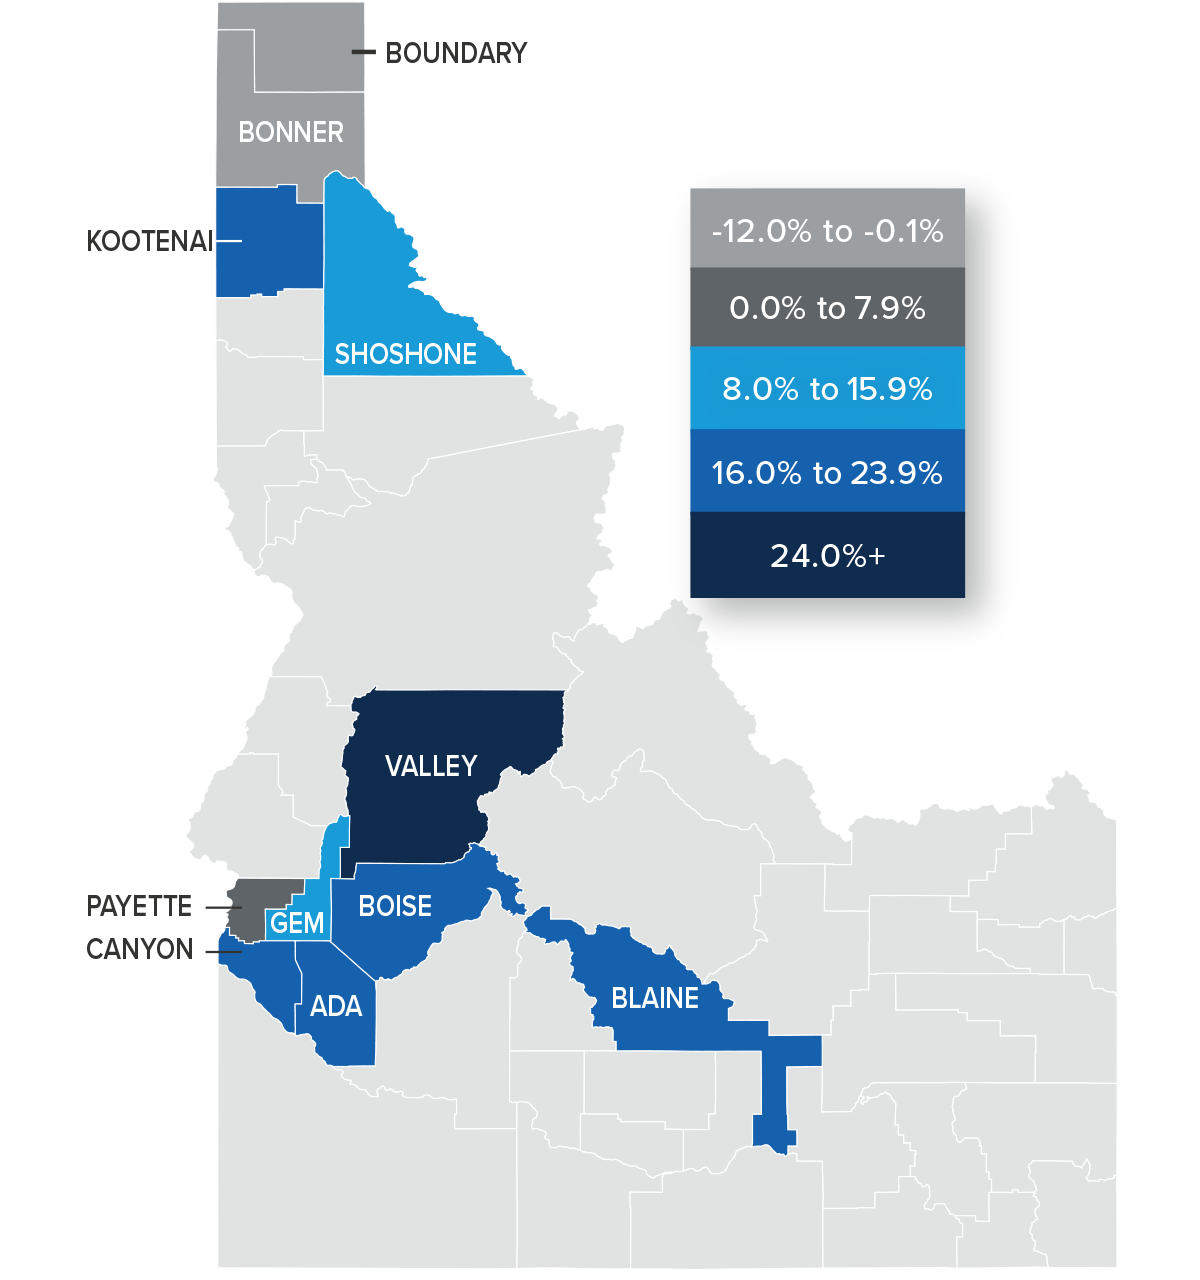
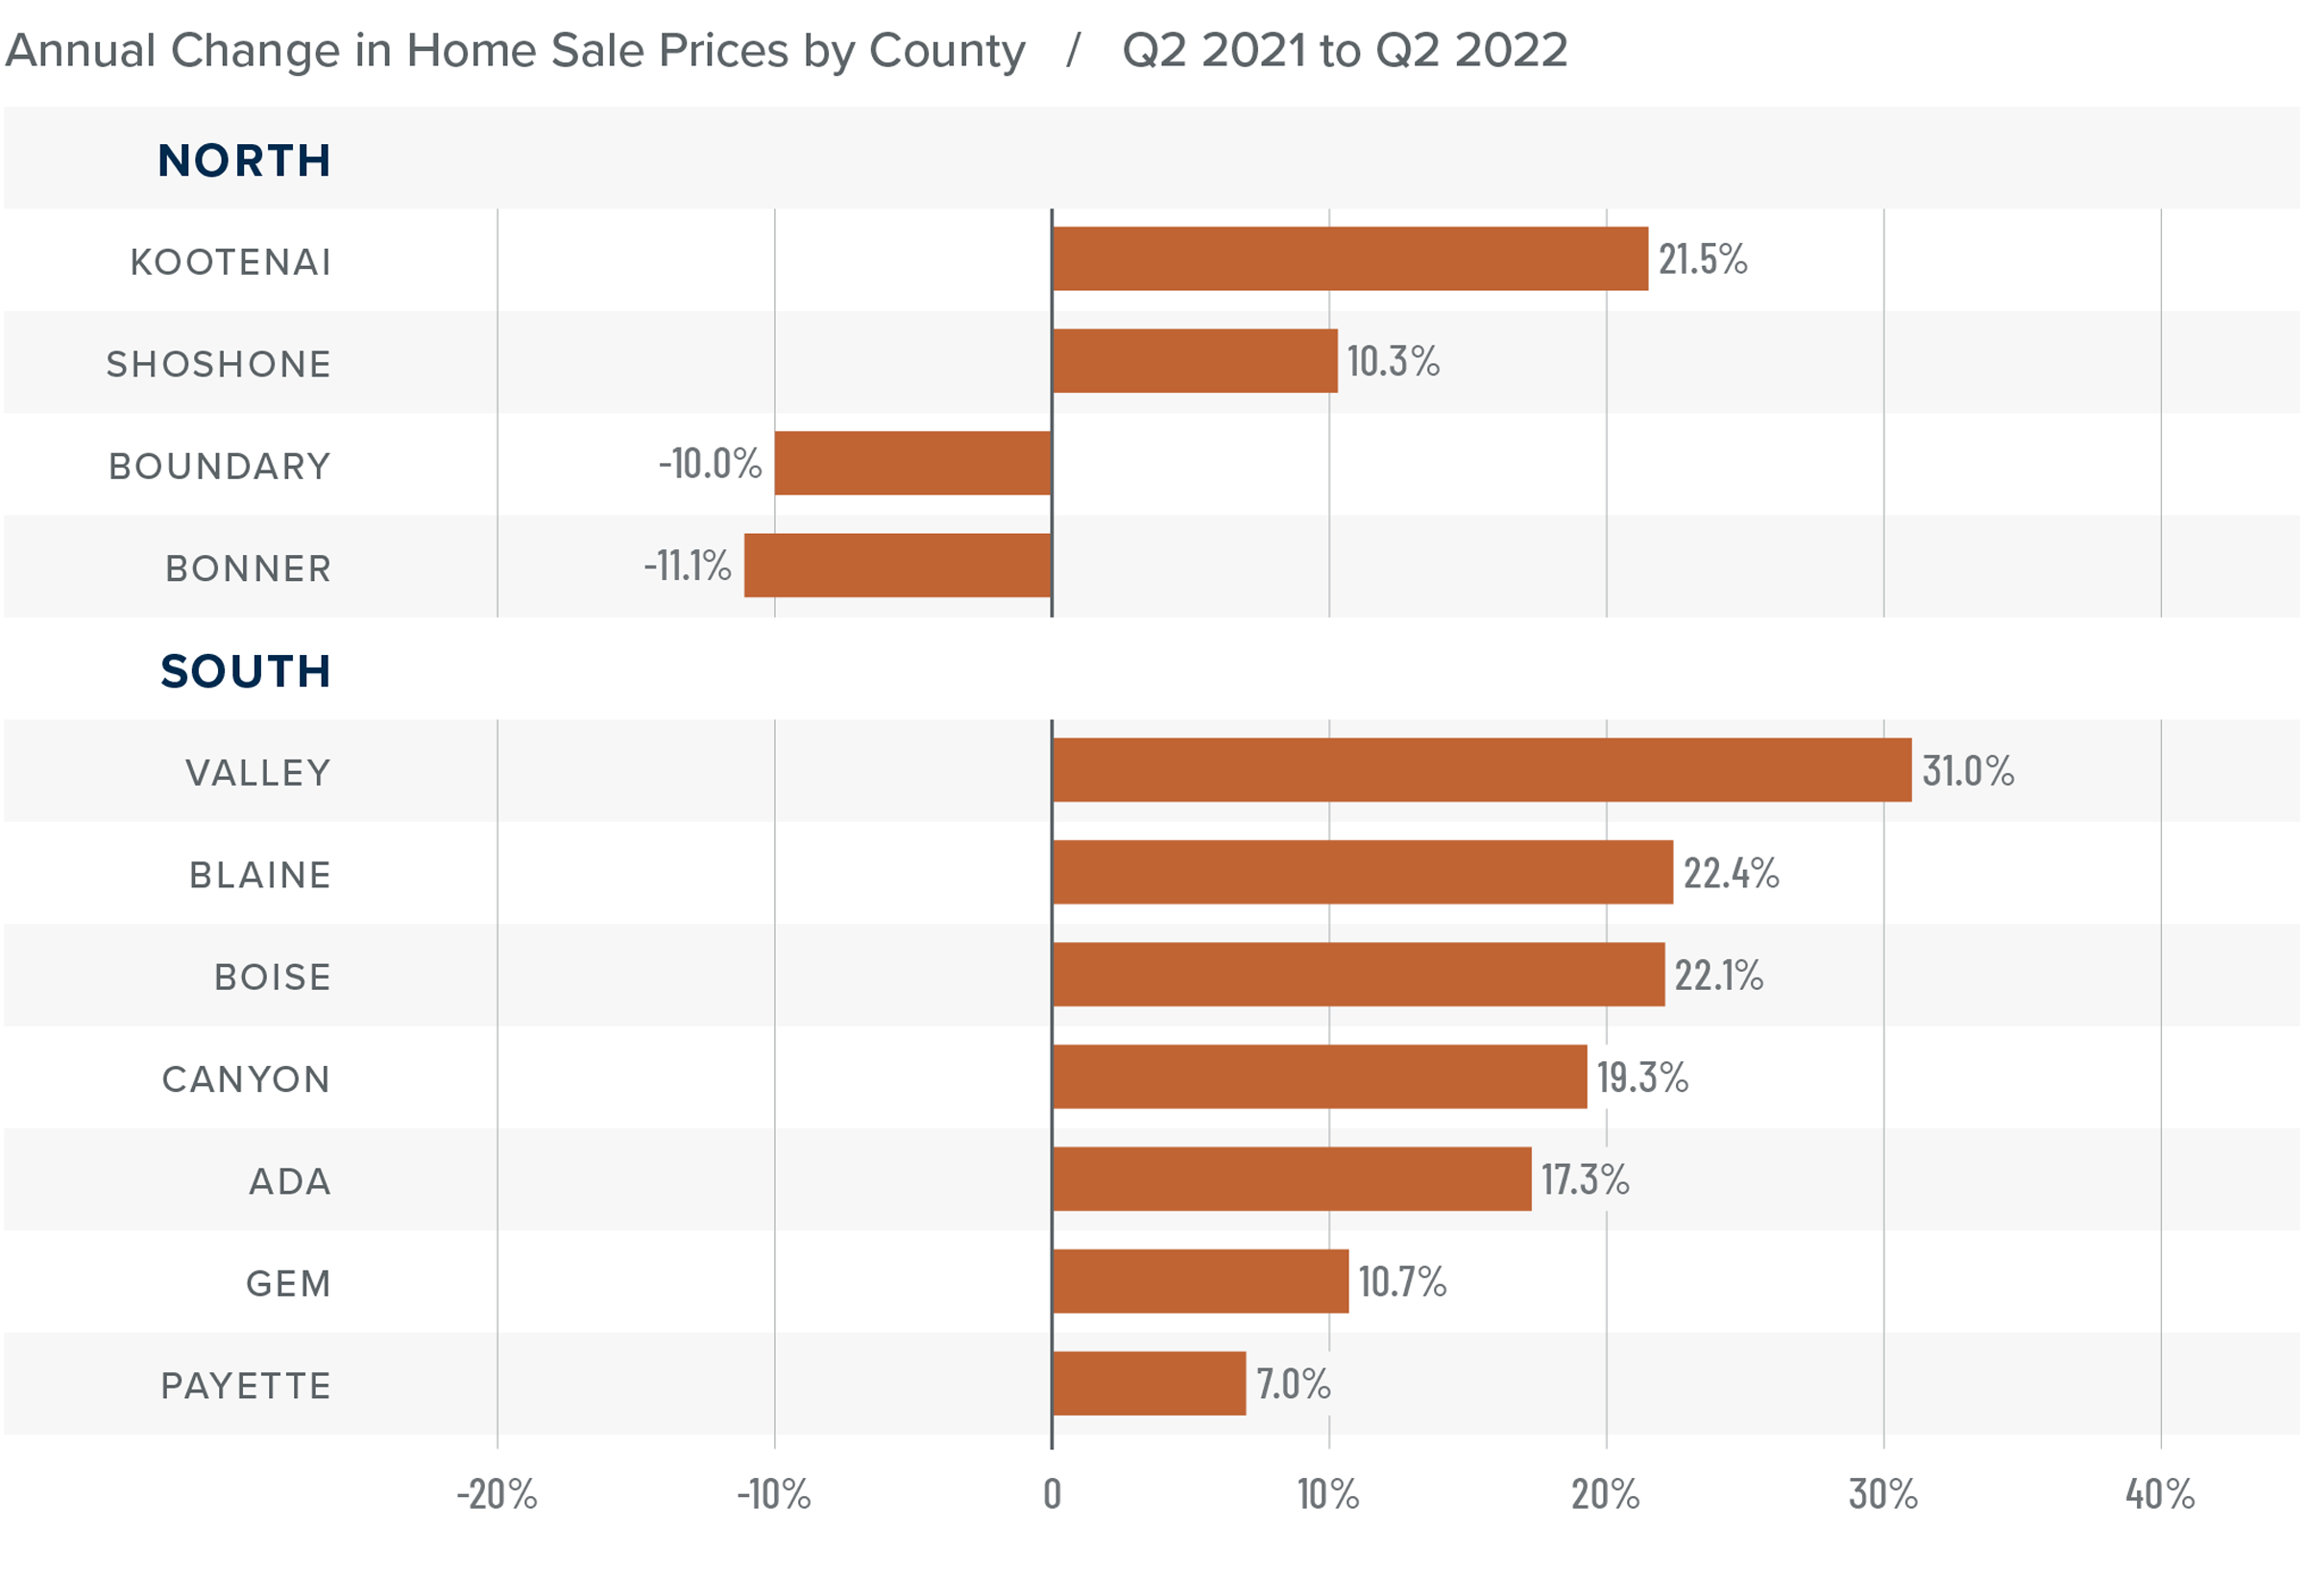
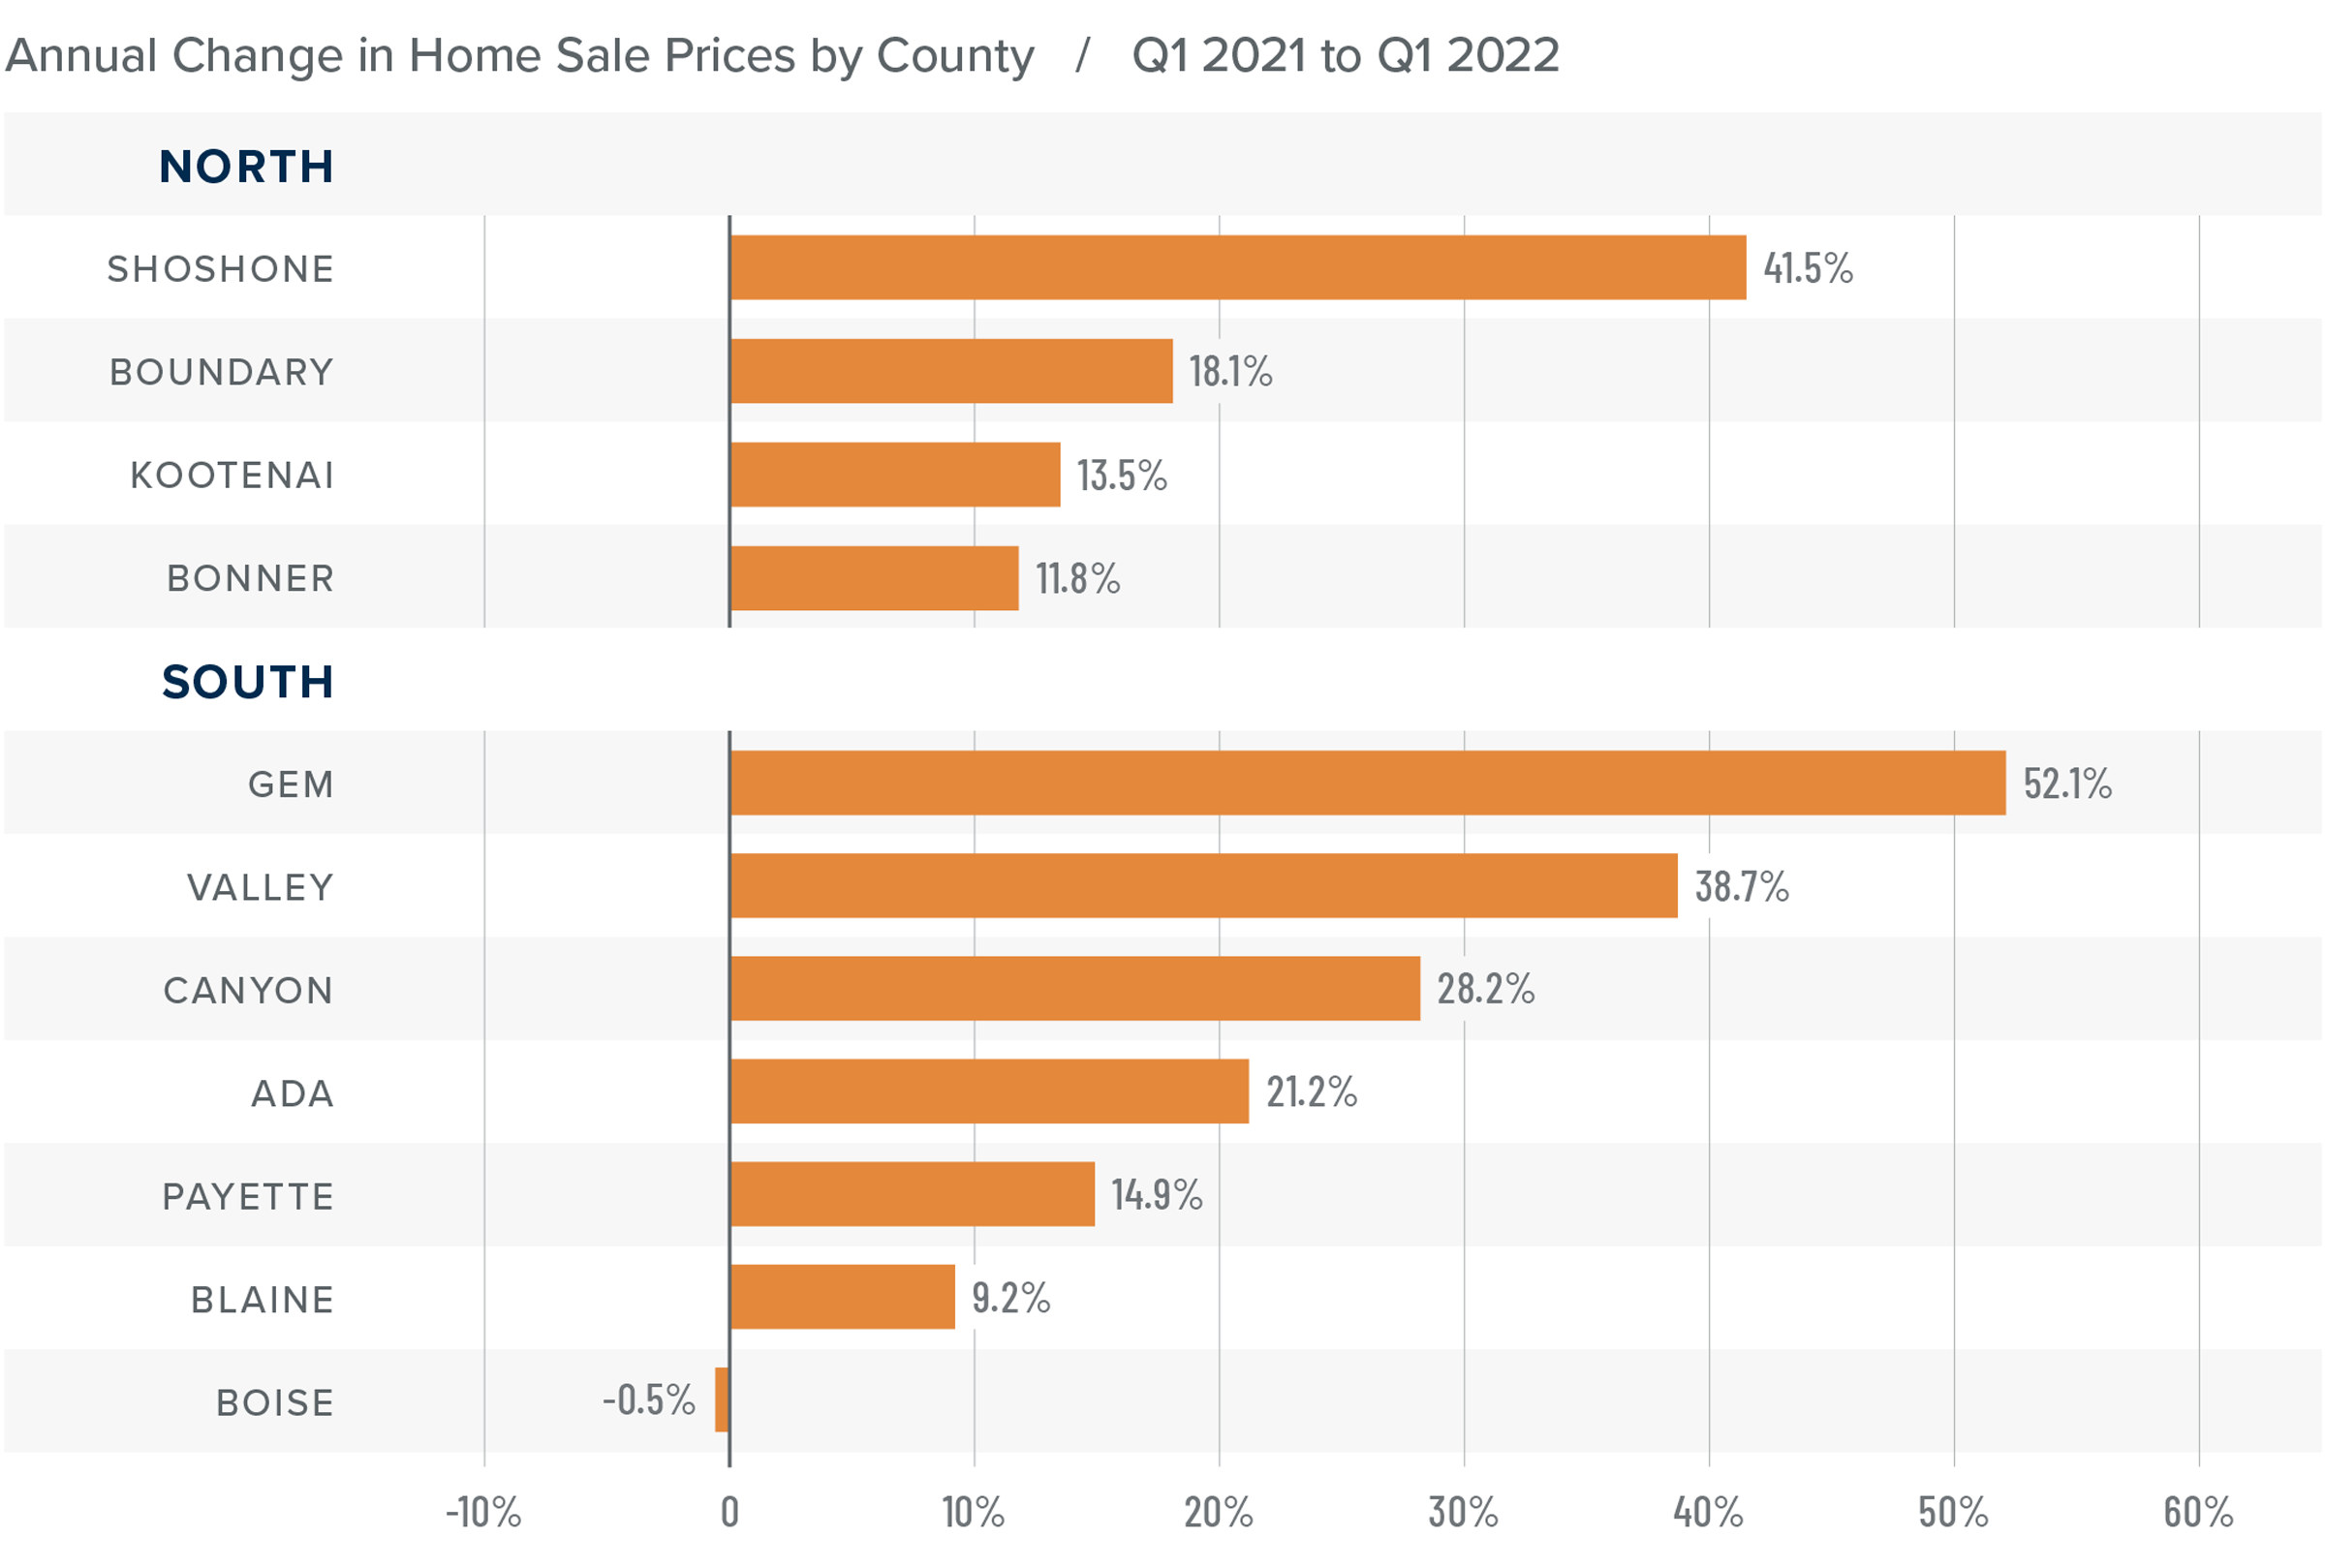
❱ The average home price in the region rose 15.6% year over year to $643,954. Sale prices were 5.1% higher than in first quarter of the year.
❱ Compared to the first quarter of 2022, prices were higher in Kootenai and Shoshone counties in the north, and all but Gem and Blaine counties in the southern part of the state.
❱ Prices rose by double digits in Kootenai and Shoshone counties but fell in Boundary and Bonner counties. Sale prices were higher than a year ago in all the southern counties contained in this report. In aggregate, home prices rose 2% in the Northern Idaho counties in this report and were 19.8% higher in the southern counties.
❱ I have been watching list prices, as they are a leading indicator of the health of the housing market. In second quarter, they rose in every county other than Boundary in the Northern Idaho markets, but the southern counties of Valley, Ada, Boise, and Canyon all had lower median list prices than in the previous quarter. This suggests that the rapid pace of price growth in the area may be starting to slow.
Mortgage Rates
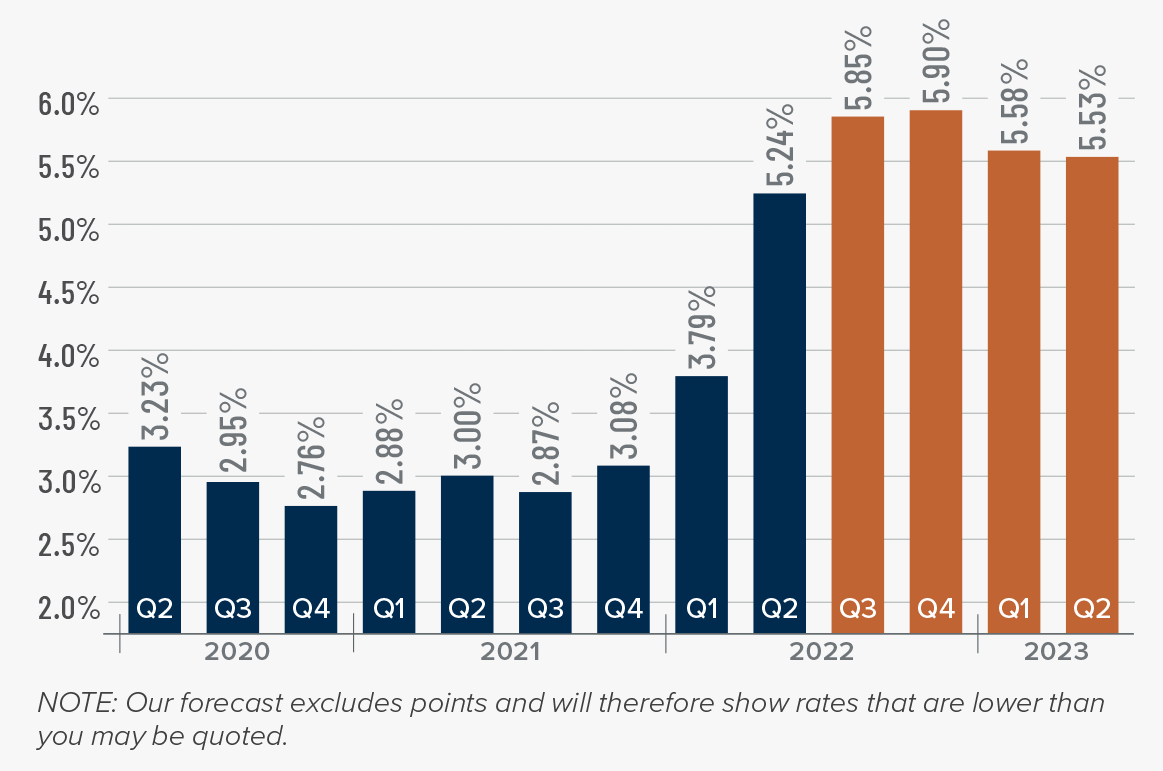
Although mortgage rates did drop in June, the quarterly trend was still moving higher. Inflation—the bane of bonds and, therefore, mortgage rates—has yet to slow, which is putting upward pressure on financing costs.
That said, there are some signs that inflation is starting to soften and if this starts to show in upcoming Consumer Price Index numbers then rates will likely find a ceiling. I am hopeful this will be the case at some point in the third quarter, which is reflected in my forecast.
Idaho Days on Market
❱ The average number of days it took to sell a home in the region matched the second quarter of 2021 but fell seven days compared to the first quarter of the year.
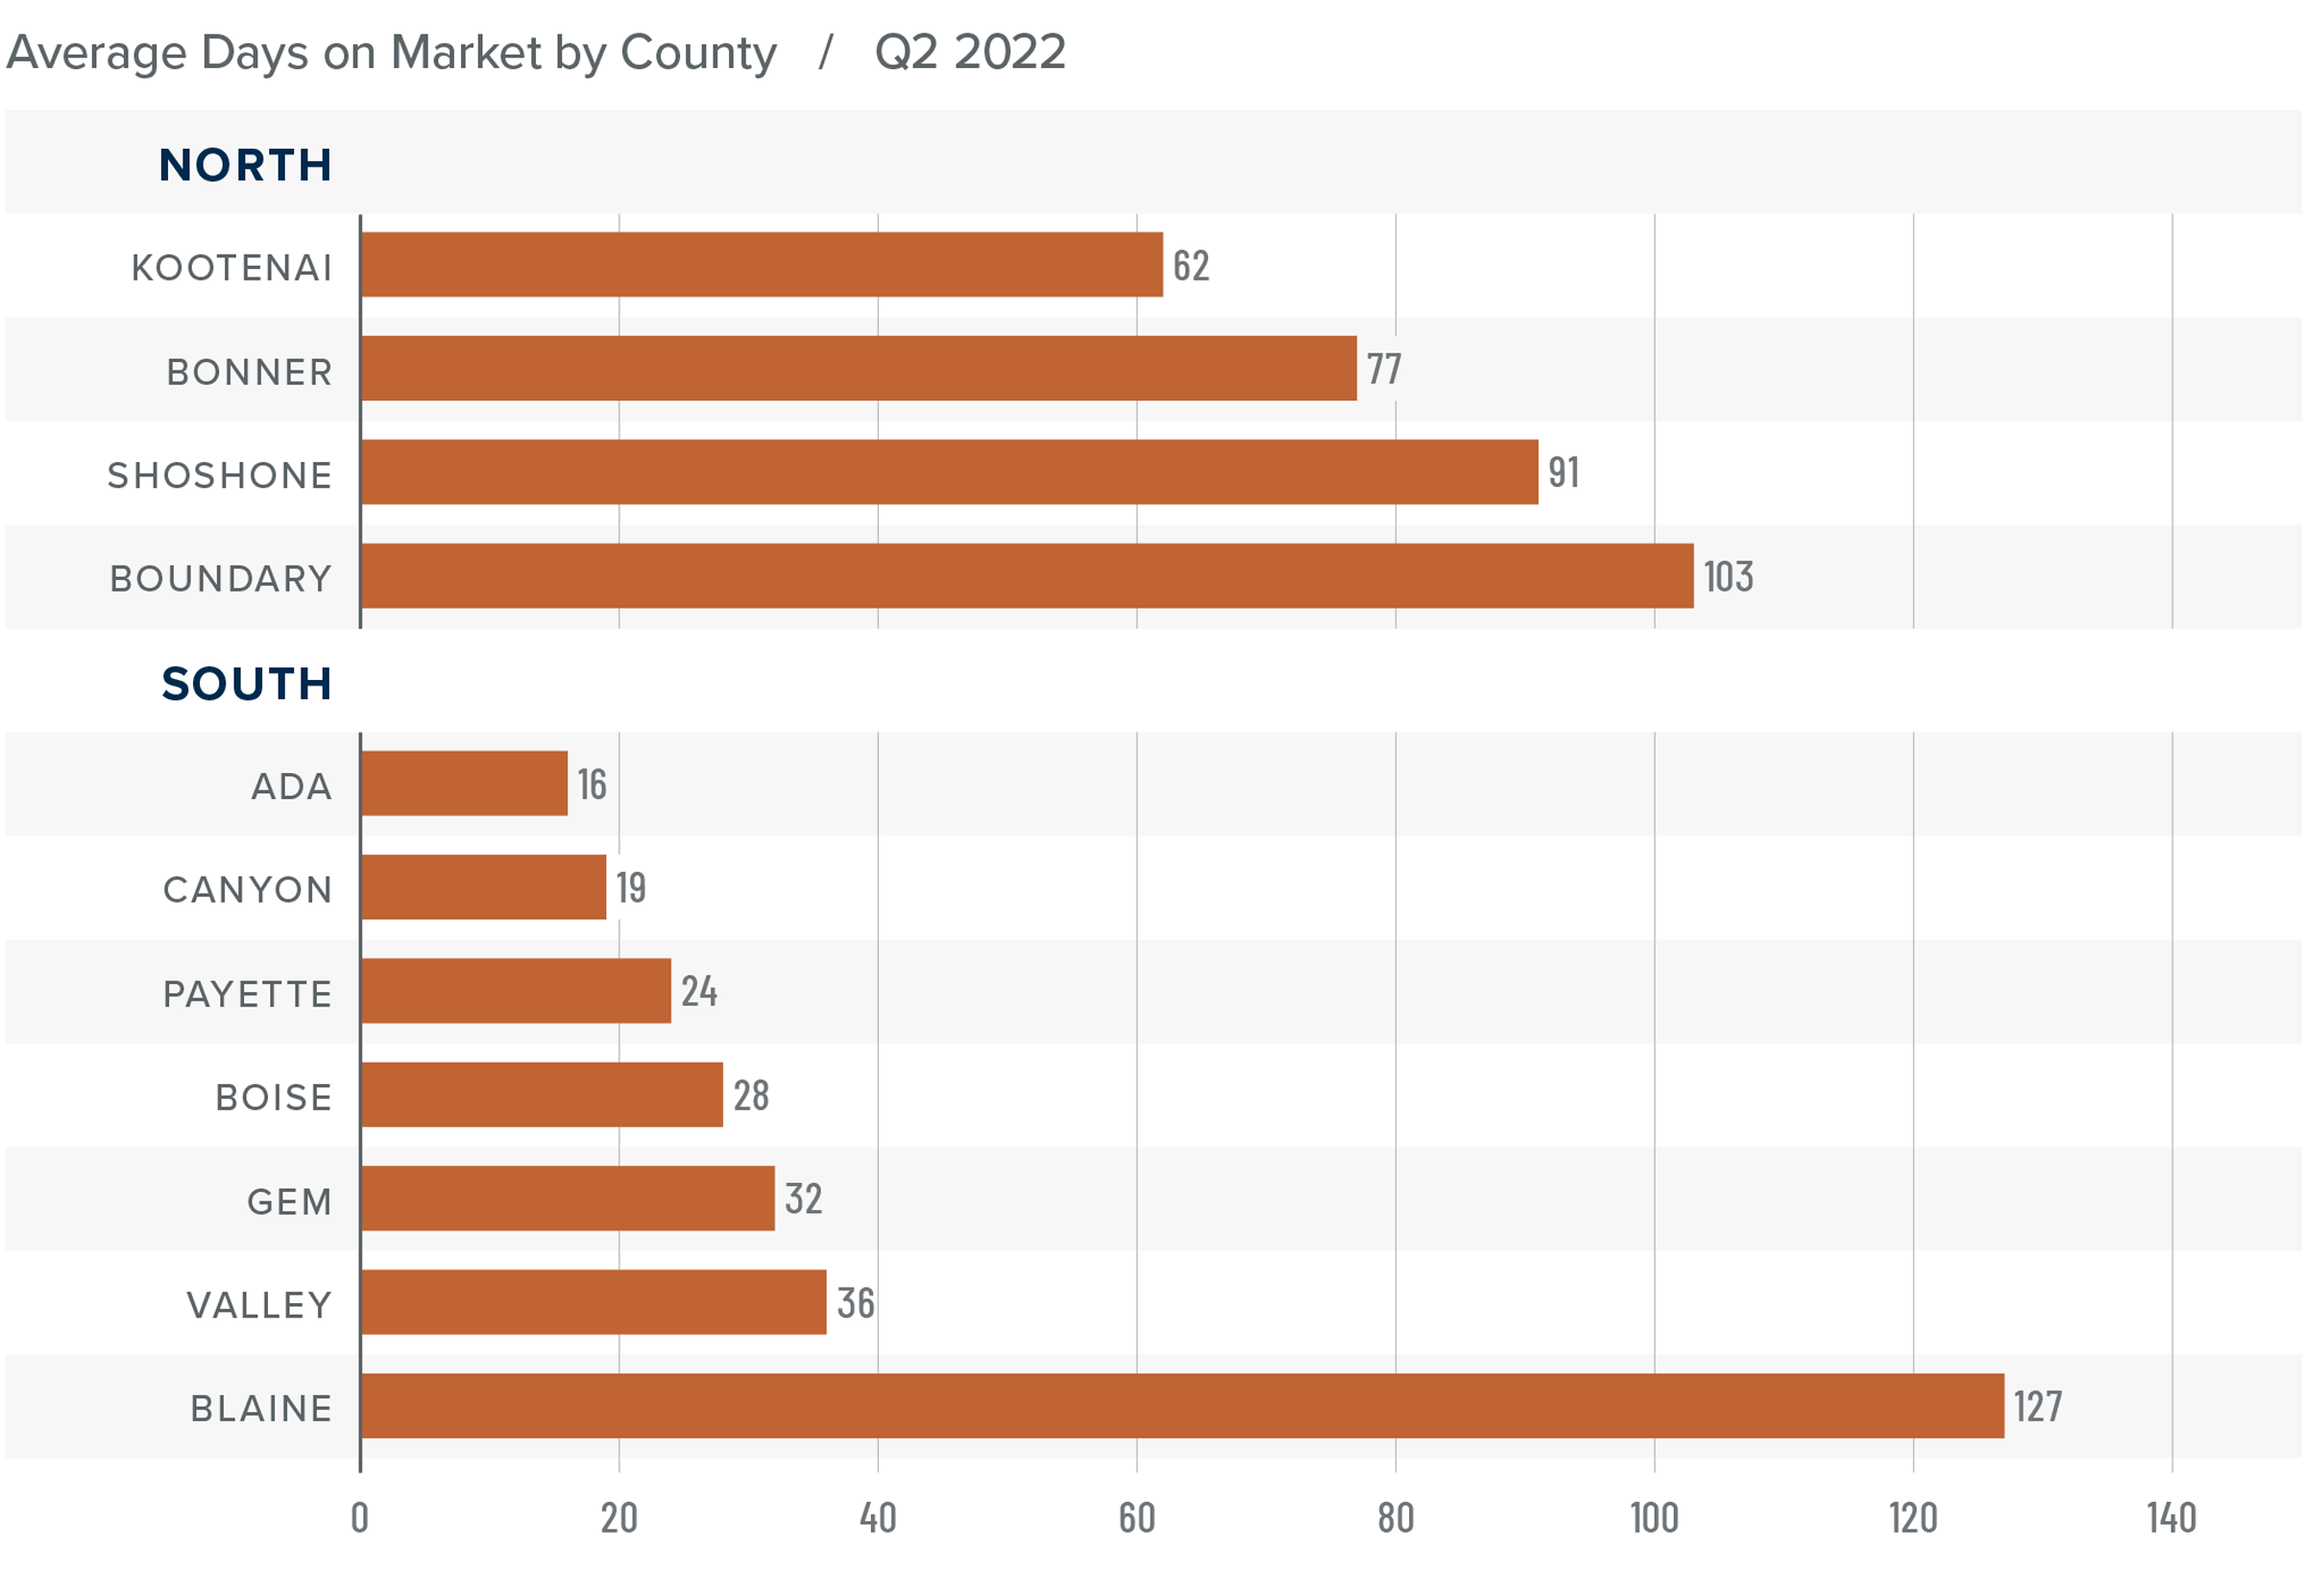
❱ In Northern Idaho, days on market rose in all counties except Kootenai compared to a year ago. Market time rose in every county other than Valley and Blaine in Southern Idaho.
❱ It took an average of 83 days to sell a home in Northern Idaho and 40 days in the southern part of the state covered by this report.
❱ Homes again sold the fastest in Ada County in the southern part of the state and in Kootenai County in Northern Idaho.
Conclusions
This speedometer reflects the state of the region’s real estate market using housing inventory, price gains, home sales, interest rates, and larger economic factors.
The economy continues to grow, albeit at a slower pace than over the past 18 months, and the labor market is still healthy. Even though the number of homes for sale has jumped significantly, which normally favors buyers, demand appears to still be robust. With list prices continuing to rise, sellers are clearly confident even as financing costs continue to increase. That said, the pace of price growth is slowing but overall sellers are still in control.

Given all the aforementioned factors, I have left the needle in the same position as last quarter. Even though the market is doing well, slipping list prices in several Southern Idaho counties suggest that those markets may have found a price ceiling. Even so, sellers remain in the driver’s seat.
About Matthew Gardner
As Chief Economist for Windermere Real Estate, Matthew Gardner is responsible for analyzing and interpreting economic data and its impact on the real estate market on both a local and national level. Matthew has over 30 years of professional experience both in the U.S. and U.K.
In addition to his day-to-day responsibilities, Matthew sits on the Washington State Governors Council of Economic Advisors; chairs the Board of Trustees at the Washington Center for Real Estate Research at the University of Washington; and is an Advisory Board Member at the Runstad Center for Real Estate Studies at the University of Washington where he also lectures in real estate economics.
Q1 2022 Idaho Real Estate Market Update

The following analysis of select counties of the Idaho real estate market is provided by Windermere Real Estate Chief Economist Matthew Gardner. We hope that this information may assist you with making better-informed real estate decisions. For further information about the housing market in your area, please don’t hesitate to contact your Windermere Real Estate agent.
Regional Economic Overview
Employment in Idaho rose 3.2% over the past 12 months and the latest data shows the number of jobs is 38,300 higher than the pre-pandemic peak. This is particularly notable as there are only nine other states that have exceeded their pre-Covid employment levels. The state unemployment rate was only 2.7%, down from 3.1% at the end of 2021, and lower than the March 2021 rate of 3.9%. There was a very modest decline in total employment between February and March of this year, but I do not see this as being an issue. The labor force continues to grow, and my current forecast calls for employment to rise 3% in 2022.
Idaho Home Sales
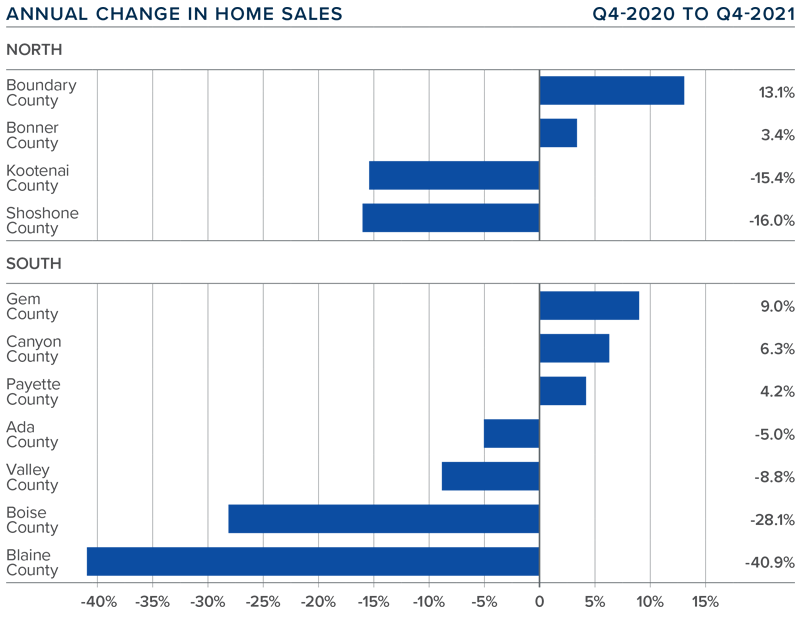
❱ In the first quarter of 2022, 5,183 homes sold, representing an increase of 4.2% compared to a year ago but 24.7% lower than in the fourth quarter of 2021.
❱ Quarter over quarter, sales fell in every county covered by this report.
❱ Sales fell in all the northern counties contained in this report compared to a year ago, but this was offset by rising sales in more than half of the counties in Southern Idaho.
❱ Pending sales were 2.7% lower than in the fourth quarter of 2021, but this is more than likely a function of inventory levels, which were down 28.4% from the last quarter. Supply is still very tight.
Idaho Home Prices
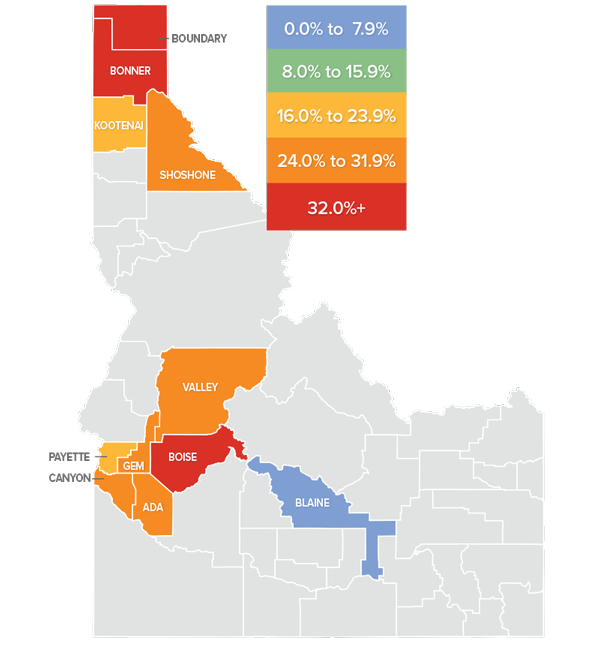
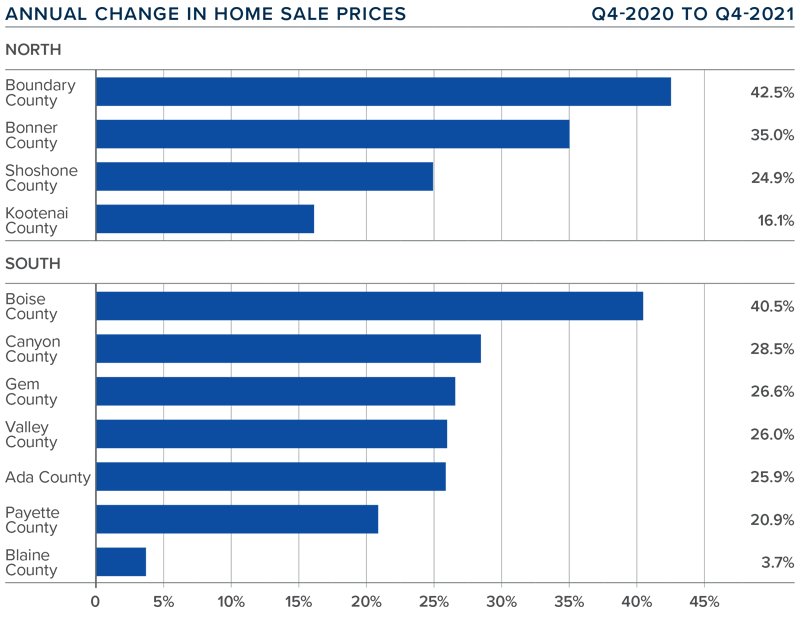
❱ The average home price in the region rose 18.6% year over year to $612,558 and was 3.1% higher than in the fourth quarter of 2021.
❱ Compared to the final quarter of 2021, prices were higher in Kootenai and Shoshone counties in the north. All counties in the southern part of the state saw sale prices increase from the prior quarter.
❱ Prices rose by double digits in all the northern counties contained in this report, and all but Boise County saw similar robust price appreciation in the southern part of the state. In total, prices rose 17.2% in the Northern Idaho counties and 19.5% in the southern counties.
❱ The market appears to have either shrugged off the significant increase in mortgage rates in the first quarter, or the impact has yet to be felt.
Mortgage Rates
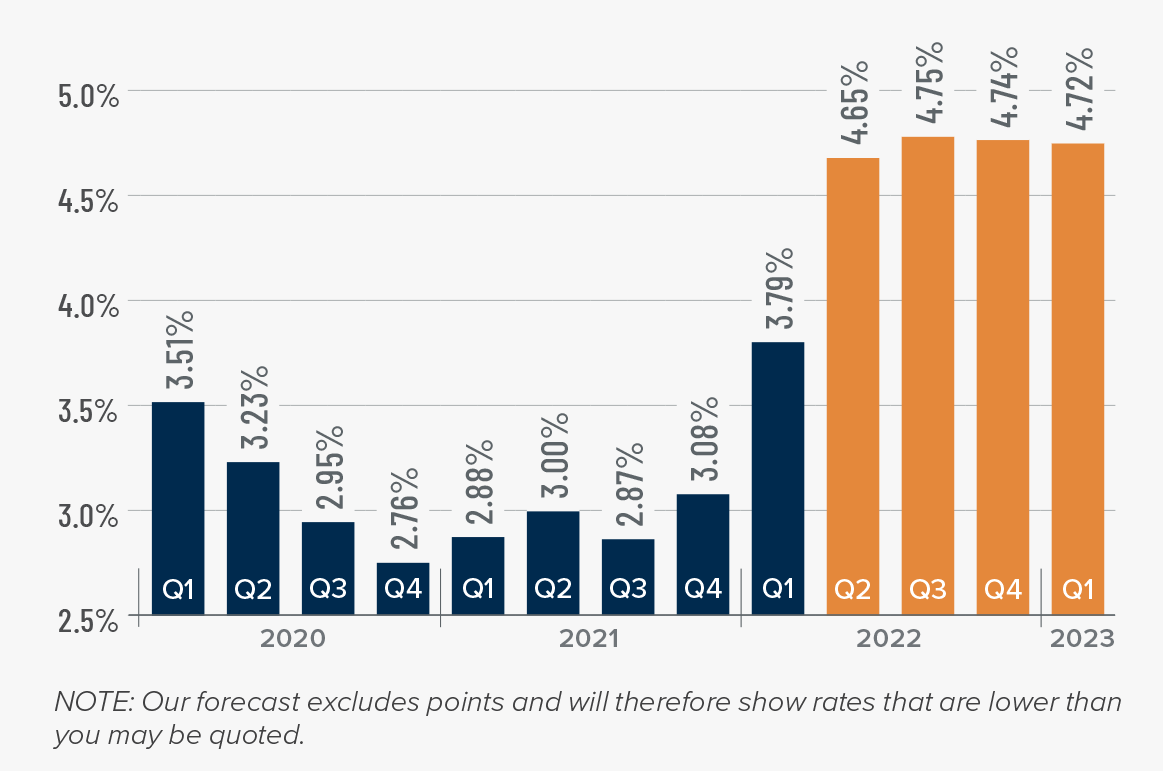
Average rates for a 30-year conforming mortgage were 3.11% at the end of 2021, but since then have jumped over 1.5%—the largest increase since 1987. The speed of the surge in rates is due to the market having quickly priced in the seven-to-eight rate increase that the Fed is expected to implement this year.
Because the mortgage market has priced this into the rates they are offering today, my forecast suggests that we are getting close to a ceiling in rates, and it is my belief that they will rise modestly in the second quarter before stabilizing for the balance of the year.
Idaho Days on Market
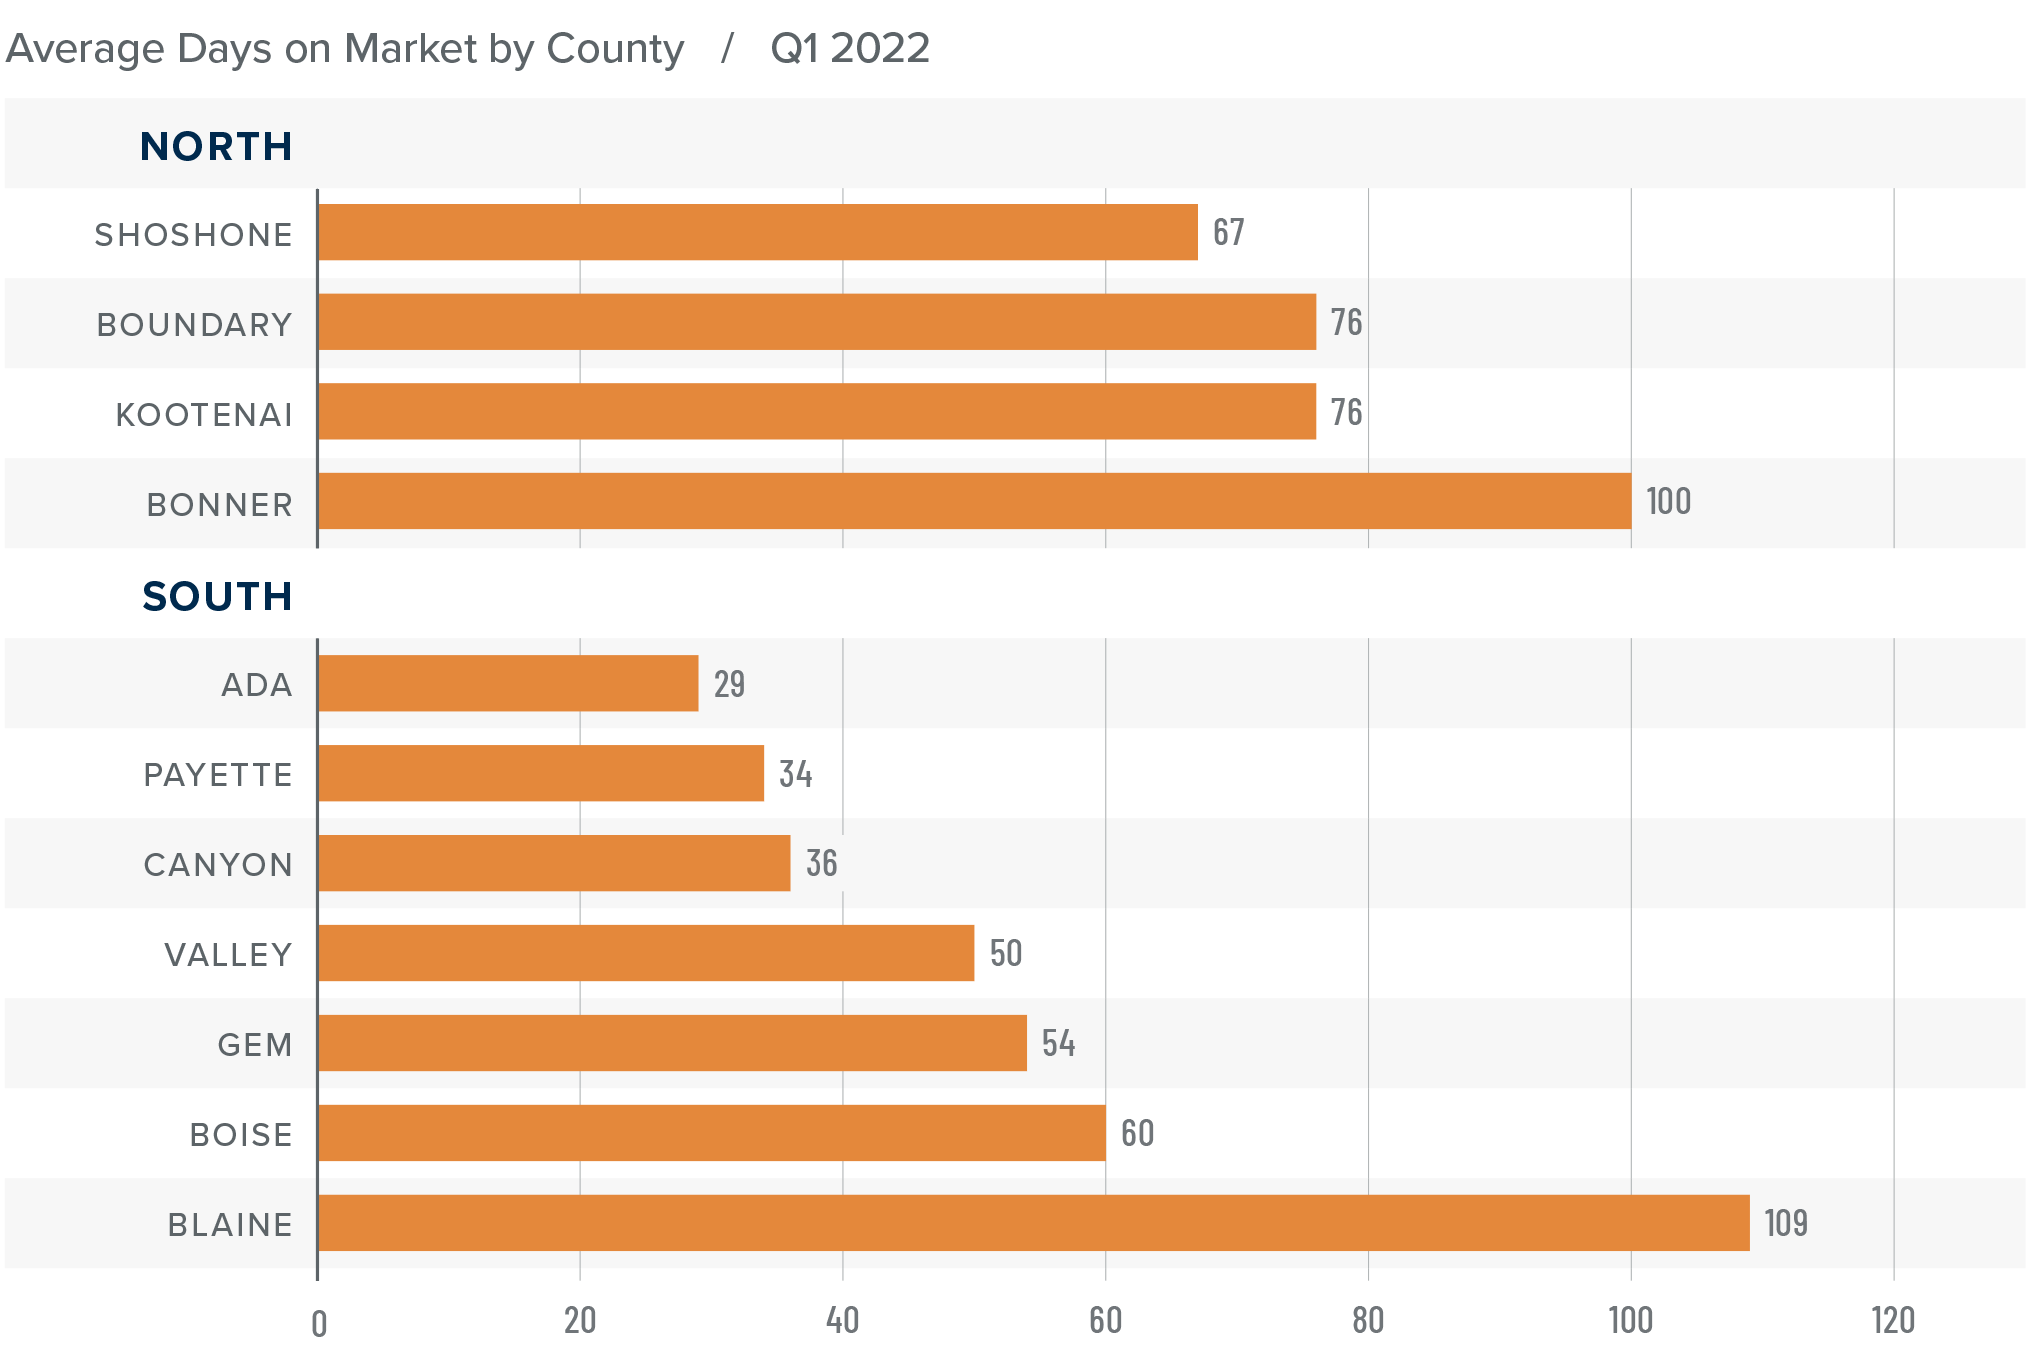
❱ It took an average of 80 days to sell a home in Northern Idaho, and 53 days in the southern part of the state covered by this report.
❱ The average number of days it took to sell a home in the region dropped ten days compared to a year ago but rose eight days compared to the fourth quarter of 2021.
❱ In Northern Idaho, days-on-market dropped in all counties from a year ago, and market time dropped or remained static in every county other than Bonner compared to the previous quarter. In Southern Idaho, average market time fell in all counties other than Canyon, Gem, and Ada compared to a year ago but rose across the board compared to the prior quarter.
❱ Homes sold the fastest in Ada County in the southern part of the state, and in Shoshone County in Northern Idaho.
Conclusions
This speedometer reflects the state of the region’s real estate market using housing inventory, price gains, home sales, interest rates, and larger economic factors.
The strong Idaho economy has helped the housing market continue its upward trajectory. We should see more homes come on the market as we move into the spring selling season, but this is unlikely to be sufficient to meet demand. The question remains whether rising mortgage rates will impact the pace of appreciation that home prices have experienced in recent years. The data suggests that it has yet to be a factor, but we will have to wait and see what the spring market shows us.

Given all these factors, I have decided to leave the needle in the same position as the previous quarter. It remains a strong seller’s market, but listing prices are softening somewhat in certain areas, which may be a pre-cursor to a slowdown in price appreciation.
About Matthew Gardner
As Chief Economist for Windermere Real Estate, Matthew Gardner is responsible for analyzing and interpreting economic data and its impact on the real estate market on both a local and national level. Matthew has over 30 years of professional experience both in the U.S. and U.K.
In addition to his day-to-day responsibilities, Matthew sits on the Washington State Governors Council of Economic Advisors; chairs the Board of Trustees at the Washington Center for Real Estate Research at the University of Washington; and is an Advisory Board Member at the Runstad Center for Real Estate Studies at the University of Washington where he also lectures in real estate economics.
Q4 2021 Idaho Real Estate Market Update

The following analysis of select counties of the Idaho real estate market is provided by Windermere Real Estate Chief Economist Matthew Gardner. We hope that this information may assist you with making better-informed real estate decisions. For further information about the housing market in your area, please don’t hesitate to contact your Windermere Real Estate agent.
Regional Economic Overview
The Idaho economy continues to impress with employment growing by 2.1% over the past year. Comparatively, the country as a whole has grown by 4.2% during the same period; however, the U.S. still needs to recover more than 3.7 million jobs that were lost due to COVID-19, while Idaho has already fully recovered. Moreover, state employment levels are 14,500 jobs higher than the pre-pandemic peak. Given the robust employment growth, it’s not surprising that the unemployment rate was a very impressive 2.8% in November (the most recent data available). New COVID-19 cases started rising again at the start of 2022, but it’s still unclear whether that will have an impact on the economy. Instinctively, I do not see it as a significant impediment, as the latest data suggests that infection rates may have already peaked.
idaho Home Sales
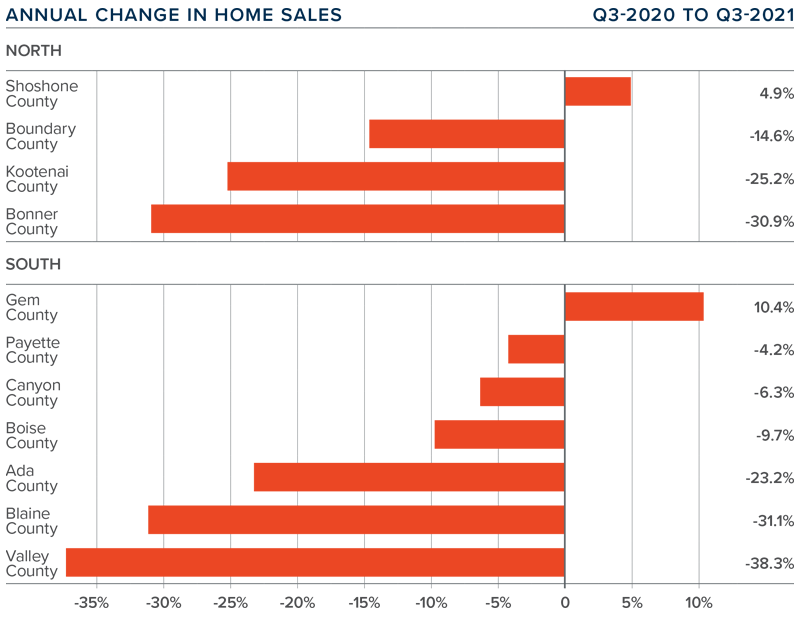
❱ In the final quarter of 2021, 6,887 homes sold. This was 5.7% lower than a year ago, and down 6.4% compared to the third quarter of last year.
❱ Quarter-over-quarter, sales rose in Bonner and Payette counties, but fell in the rest of the market areas covered by this report.
❱ Year-over-year, sales improved in Boundary and Bonner counties in the northern part of the state. Sales rose in Gem, Canyon, and Payette counties in Southern Idaho.
❱ Pending sales were 14% lower than in the third quarter, which suggests a slowing market, but this can be attributed to seasonality. Listing activity was up 41% compared to a year ago but fell 25.5% from the third quarter. The market remains very tight on the supply side.
idaho Home Prices
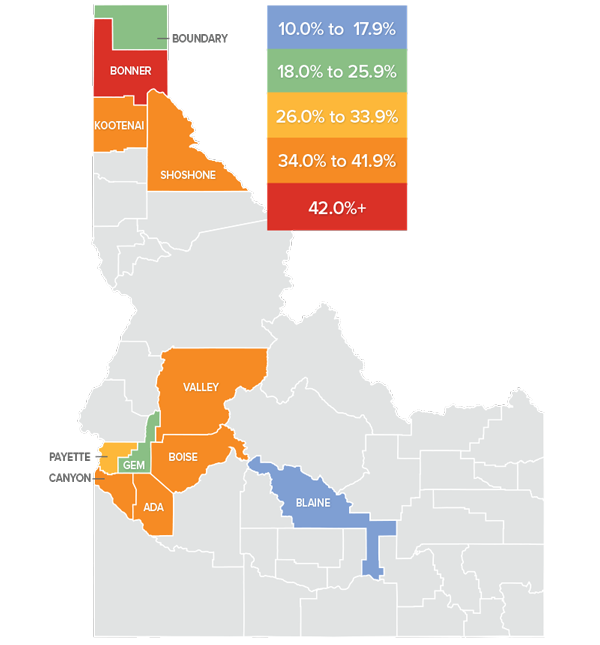
❱ The average home price in the region rose 19.6% year-over-year to $593,868 but fell 1.5% compared to the third quarter.
❱ When compared to the third quarter of 2021, prices were higher in Bonner and Boundary counties in the north, and in Payette, Canyon, and Gem counties in Southern Idaho.
❱ Prices rose by double digits in all of the northern counties in this report, while in the southern counties, all but Blaine County saw sale prices rise by more than ten percent. In aggregate, prices rose 29.1% in the Northern Idaho counties and were up 20.1% in the southern counties.
❱ Such aggressive price appreciation is impressive given that mortgage rates rose .3% during the quarter. It’s clear the housing market is still out of balance, even as sales growth slowed. This pace of appreciation can’t go on indefinitely, and it seems we’ve reached that end. I expect price growth will trend lower as we move through 2022 due to affordability constraints and rising mortgage rates.
Days on Market
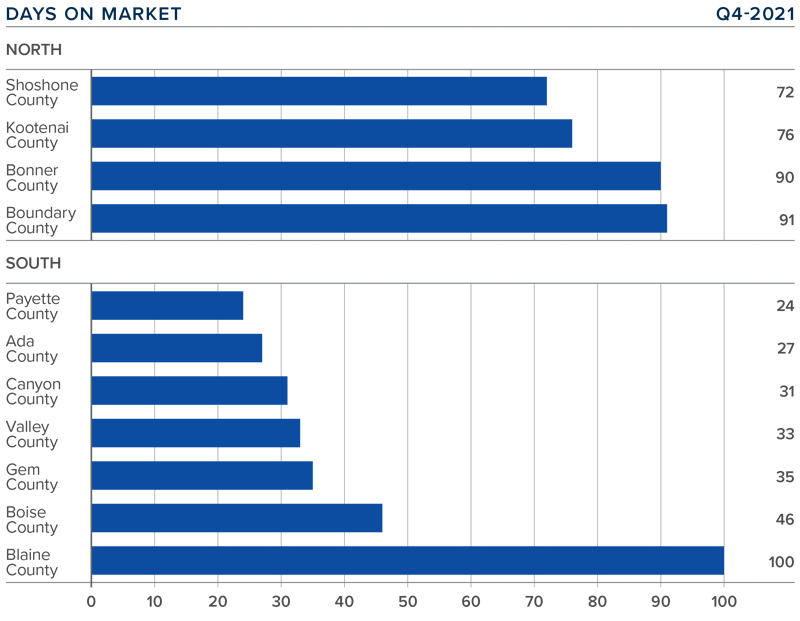
❱ It took an average of 82 days to sell a home in Northern Idaho and 42 days in the southern part of the state.
❱ The average number of days it took to sell a home in the region dropped 9 days compared a year ago but rose 11 days compared to the third quarter of 2021.
❱ In Northern Idaho, days on market dropped in all counties compared to a year ago but rose in all counties compared to the third quarter of 2021. In Southern Idaho, market time also dropped in Valley, Payette, and Blaine counties but rose in the other markets covered by this report.
❱ Homes sold the fastest in Payette County in the southern part of the state, and in Shoshone County in Northern Idaho.
Conclusions
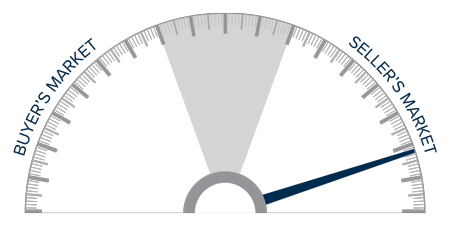
This speedometer reflects the state of the region’s real estate market using housing inventory, price gains, home sales, interest rates, and larger economic factors.
Idaho’s economy continues to fire on all cylinders. Such robust growth has caused the housing market to perform extremely well—as demonstrated by the rapid pace of home price appreciation.
In-migration to Idaho has been impressive. Much of this has been driven by the ability for employees to continue working remotely. For many workers leaving more expensive markets, price points in Idaho are a major draw. Although mortgage rates will continue to climb higher in 2022, my forecast calls for home prices in Idaho’s southern counties to see low double-digit percentage gains while the northern part of the state can expect increases in the high teens. Good news for sellers, but buyers will likely not be so happy.
Even with the prospect of more homes coming to market in the spring, Idaho remains staunchly a seller’s market and I am moving the needle a little more in their favor.
About Matthew Gardner

As Chief Economist for Windermere Real Estate, Matthew Gardner is responsible for analyzing and interpreting economic data and its impact on the real estate market on both a local and national level. Matthew has over 30 years of professional experience both in the U.S. and U.K.
In addition to his day-to-day responsibilities, Matthew sits on the Washington State Governors Council of Economic Advisors; chairs the Board of Trustees at the Washington Center for Real Estate Research at the University of Washington; and is an Advisory Board Member at the Runstad Center for Real Estate Studies at the University of Washington where he also lectures in real estate economics.
Q3 2021 Idaho Real Estate Market Update

The following analysis of select counties of the Idaho real estate market is provided by Windermere Real Estate Chief Economist Matthew Gardner. We hope that this information may assist you with making better-informed real estate decisions. For further information about the housing market in your area, please don’t hesitate to contact your Windermere Real Estate agent.
Regional Economic Overview
On top of having recovered all the jobs lost to COVID-19 by the end of 2020—a remarkable feat in itself—the Idaho economy continues to strengthen. Current employment levels are up by 15,400 jobs from the pre-pandemic peak. With the labor market continuing to expand, the unemployment rate was 2.9% in August (the most recent data available). Equally impressive was that the rate dropped even as the labor force grew—no easy task. New COVID-19 cases remain higher than I would like, but this does not appear to have impacted the state’s economy to any significant degree given the robust employment picture. As we move, hopefully, toward a time when the impacts of the pandemic wane further, I see nothing but an upward trajectory for the state’s economy.
idaho Home Sales
❱ In the third quarter, 7,354 existing homes sold, representing a drop of 19.9% from a year ago. However, given that the country was experiencing a massive housing rebound following the outbreak of COVID-19, any comparison with data from 12 months ago is not very informative. More useful is that sales rose 22.1% compared to the second quarter of 2021.
❱ As mentioned, comparing current data to a year ago does not provide an accurate picture, but comparing it with the second quarter data shows sales higher across the board. Sales were up by double digits in every county covered by this report.
❱ Year-over-year sales improved in Shoshone County in Northern Idaho. Sales also rose in Gem County in the southern part of the state.
❱ Pending sales rose 16.5% from the second quarter of 2021, suggesting that closed sales in the final quarter of the year are also likely to show improvement from current levels. This is also supported by the fact that listing inventory has risen almost 36%. I predict more listings will lead to more sales.
idaho Home Prices
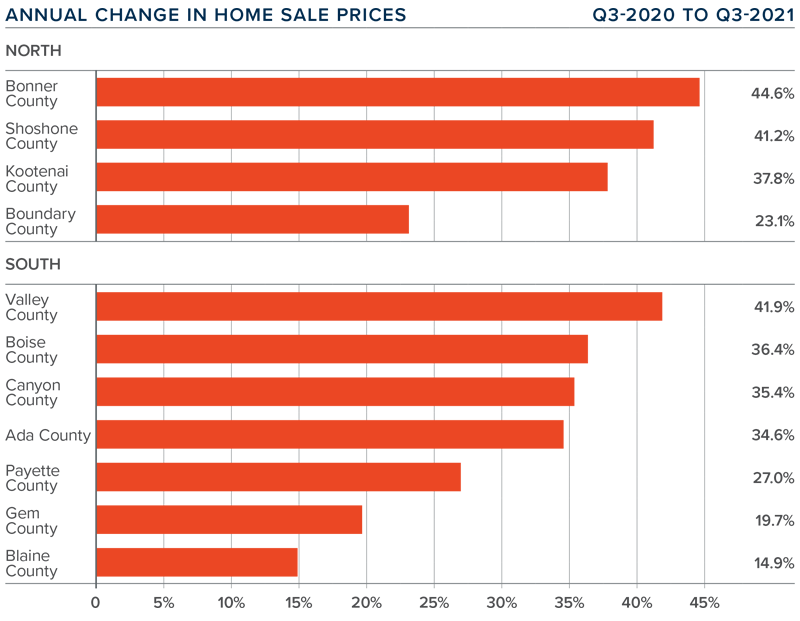
❱ The average home price in the region rose 30.9% year over year to $603,066. Prices were also up 8% compared to the second quarter of this year.
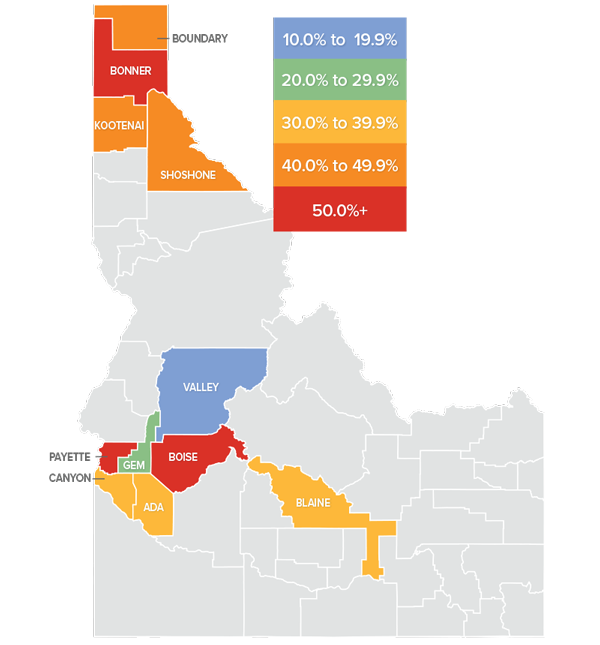
❱ Compared to the previous quarter, home prices were up 8.9% in both the northern and southern counties in this report. Sizable gains were seen in Shoshone County (+33.7%) and Bonner County (+22.7%) in the north, and Valley County (+22.6%) and Blaine County (+17.2%) in the south.
❱ Prices rose by double-digits across the board. Sale prices were up 37% in the North Idaho counties covered by this report, and up 27.7% in the southern counties.
❱ With far more buyers than sellers, home prices continue their upward march. As prices are rising at a far faster pace than wages, this cannot continue indefinitely. I expect to see the pace of appreciation start to slow, but probably not until next year.
Days on Market
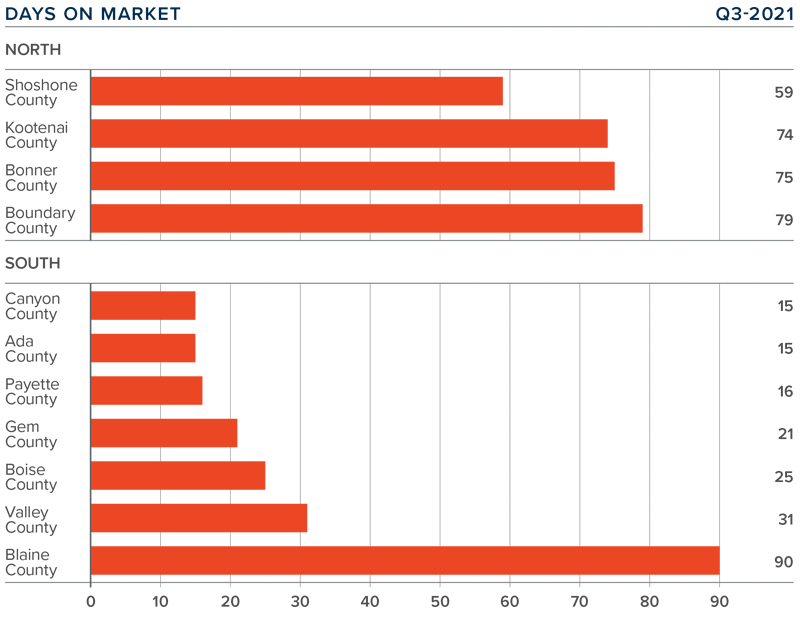
❱ It took an average of 72 days to sell a home in Northern Idaho, and 31 days in the southern part of the state.
❱ The average number of days it took to sell a home in the region dropped 23 days compared to the third quarter of 2020 but rose 2 days compared to the second quarter of this year.
❱ In Northern Idaho, days on market dropped in all counties versus a year ago but rose in all counties compared to the second quarter of this year. Market time in Southern Idaho was also lower than a year ago, but it was up from the prior quarter in Valley, Gem, and Blaine counties.
❱ Homes sold the fastest in Ada and Canyon counties in the southern part of the state. Sales were again fastest in Shoshone County in the northern part of the state.
Conclusions
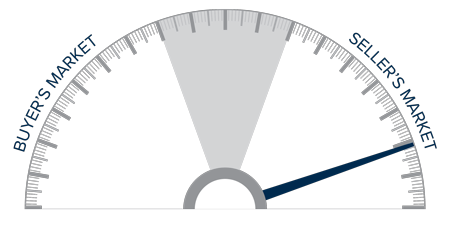
This speedometer reflects the state of the region’s real estate market using housing inventory, price gains, home sales, interest rates, and larger economic factors.
Idaho’s economy appears to be powering forward and job recovery is well ahead of almost every other state. The result is clearly an increasing number of buyers who feel comfortable buying a new home, even given the dramatic price growth of late.
That said, the only factors favoring buyers right now are that there are significantly more homes to choose from and mortgage rates remain very low by historic standards. All other factors support sellers more than buyers. As such, I am moving the needle a little more in their favor, even as affordability concerns continue to rise.
About Matthew Gardner
As Chief Economist for Windermere Real Estate, Matthew Gardner is responsible for analyzing and interpreting economic data and its impact on the real estate market on both a local and national level. Matthew has over 30 years of professional experience both in the U.S. and U.K.
In addition to his day-to-day responsibilities, Matthew sits on the Washington State Governors Council of Economic Advisors; chairs the Board of Trustees at the Washington Center for Real Estate Research at the University of Washington; and is an Advisory Board Member at the Runstad Center for Real Estate Studies at the University of Washington where he also lectures in real estate economics.
Q2 2021 Idaho Real Estate Market Update

The following analysis of select counties of the Idaho real estate market is provided by Windermere Real Estate Chief Economist Matthew Gardner. We hope that this information may assist you with making better-informed real estate decisions. For further information about the housing market in your area, please don’t hesitate to contact your Windermere Real Estate agent.
Regional Economic Overview
The post-COVID job recovery continues at an impressive rate. As discussed in last quarter’s Gardner Report, the state has not only recovered all of the 79,600 jobs that were shed during the pandemic but has added 16,300 new positions. Utah remains the only other state that can make this claim. With such a strong recovery, and additional new hiring, it is no surprise to see the unemployment rate continuing to trend lower. It currently stands at only 3%—almost half the national rate of 5.9%. New COVID-19 cases have risen in recent weeks, but not to a level that is likely to slow down the state’s robust rate of economic growth. That said, if there are significant increases in infections, it may take some of the momentum away. I remain hopeful this will not be the case.
idaho Home Sales
❱ In the second quarter, 6,023 existing homes sold, representing a drop of 4.7% year over year. However, because the pandemic was in full swing a year ago, I think it’s more meaningful to consider the second quarter sales increase of 21.7% relative to the first quarter of this year.
❱ Due to the pandemic, comparing the current quarter to a year ago does not give an accurate picture, but compared to first-quarter data, home sales showed solid growth in all counties. Bonner and Kootenai led the way in the north, and Boise and Blaine in the south.
❱ Year-over-year sales showed significant growth in all of the Northern Idaho counties contained in this report. In the southern part of the state, sales soared in Blaine County, were modestly higher in Boise and Gem counties, but were lower in all other markets.
❱ Pending sales rose 3.4% from the first quarter of this year, suggesting that the third quarter will be positive. This may also be aided by higher levels of inventory, which were up almost 55% compared to the first quarter.

idaho Home Prices
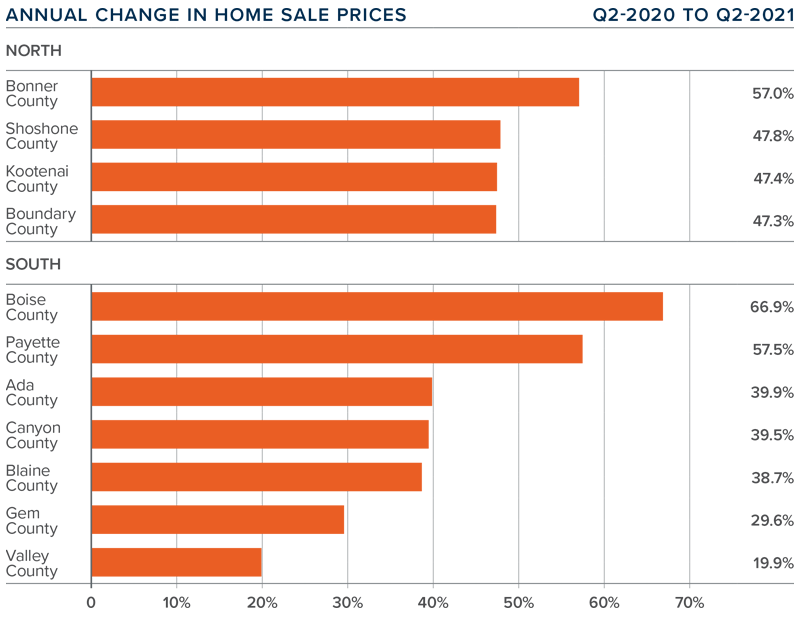
❱ Compared to a year ago, the average home price in the region rose 44.4% to $558,161. Prices were also up 8% compared to the prior quarter.
❱ Southern Idaho also saw significant year-over-year gains. Boise County jumped almost 67%. Of additional note was that prices were only .6% higher in Southern Idaho compared to the prior quarter.
❱ Prices rose year over year by at least 47% in all Northern Idaho counties covered by this report, and they were 9% higher than in the first quarter of this year. Some suspect that prices are being driven up by an increase in buyers from nearby Spokane, Washington moving to Northern Idaho where prices and supply are better, and it’s close enough to commute to Spokane for work.
❱ Buyers still outnumber sellers, which resulted in steep price increases. This may also be a function of mortgage rates rising in the first quarter, which nudged more buyers off the fence even as inventory levels remained very weak.
Days on Market
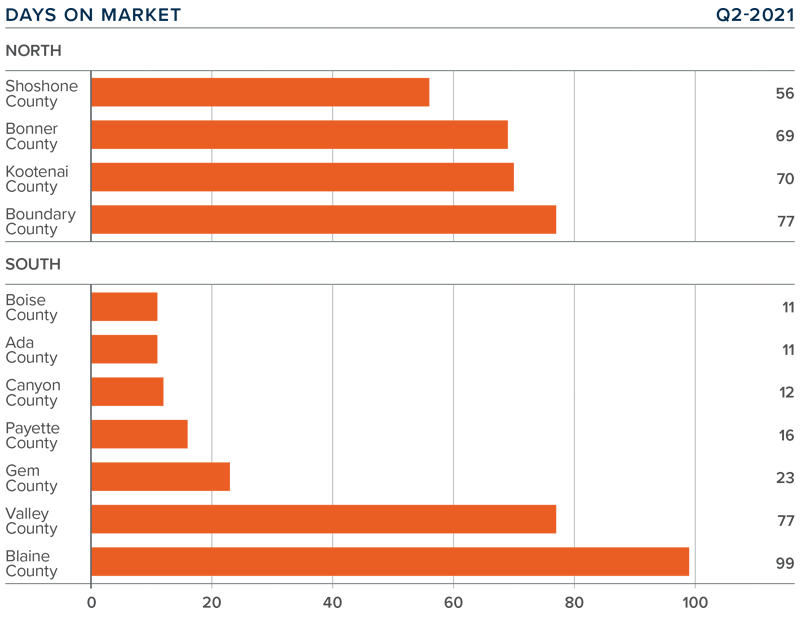
❱ It took an average of 68 days to sell a home in Northern Idaho, and 36 days in the southern part of the state covered by this report.
❱ The average number of days it took to sell a home in the region dropped 29 days compared to the second quarter of 2020 and was down 27 days compared to the first quarter of this year.
❱ In Northern Idaho, days-on-market dropped in all counties compared to a year ago, and market time was also lower than in the previous quarter. In Southern Idaho, market time dropped in all counties other than Valley, where it took five more days to sell a home than in the second quarter of 2020. Market time was down across the state compared to the first quarter of this year.
❱ Homes sold fastest in Boise and Ada counties in the southern part of the state, and in Shoshone County in the northern part of the state.
Conclusions
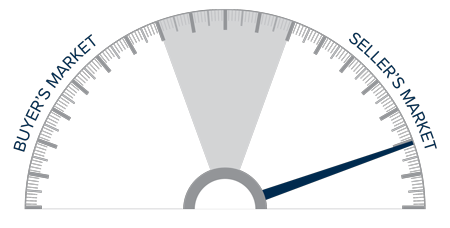
This speedometer reflects the state of the region’s real estate market using housing inventory, price gains, home sales, interest rates, and larger economic factors.
The economy continues to perform very admirably, and this is allowing buyers to become even more confident in their decision to buy a home. Mortgage rates have pulled back, and while I expect them to tick higher as we move through the year, they will still be remarkably low from a historic standpoint. Inventory levels have risen, but demand is still outpacing supply. Therefore, I have moved the needle more in favor of home sellers.
About Matthew Gardner
As Chief Economist for Windermere Real Estate, Matthew Gardner is responsible for analyzing and interpreting economic data and its impact on the real estate market on both a local and national level. Matthew has over 30 years of professional experience both in the U.S. and U.K.
In addition to his day-to-day responsibilities, Matthew sits on the Washington State Governors Council of Economic Advisors; chairs the Board of Trustees at the Washington Center for Real Estate Research at the University of Washington; and is an Advisory Board Member at the Runstad Center for Real Estate Studies at the University of Washington where he also lectures in real estate economics.
")


