
 Facebook
 X
X
 Pinterest
 Copy Link

ECONOMIC OVERVIEW
The State of Oregon has added 37,400 new jobs over the past 12 months, with solid gains in Construction (+11,600), Education & Health Services (+9,000), and Trade, Transportation & Utilities (+8,000) sectors. Year-over-year, employment in Oregon has risen 2.0%.
In September, the state unemployment rate was 4.2%—up from 3.7% at the end of the second quarter but down from 4.9% in September 2016. The civilian labor force continues to grow and I fully anticipate that the state’s economy will perform well in 2018, though somewhat slower than 2017.
HOME SALES ACTIVITY
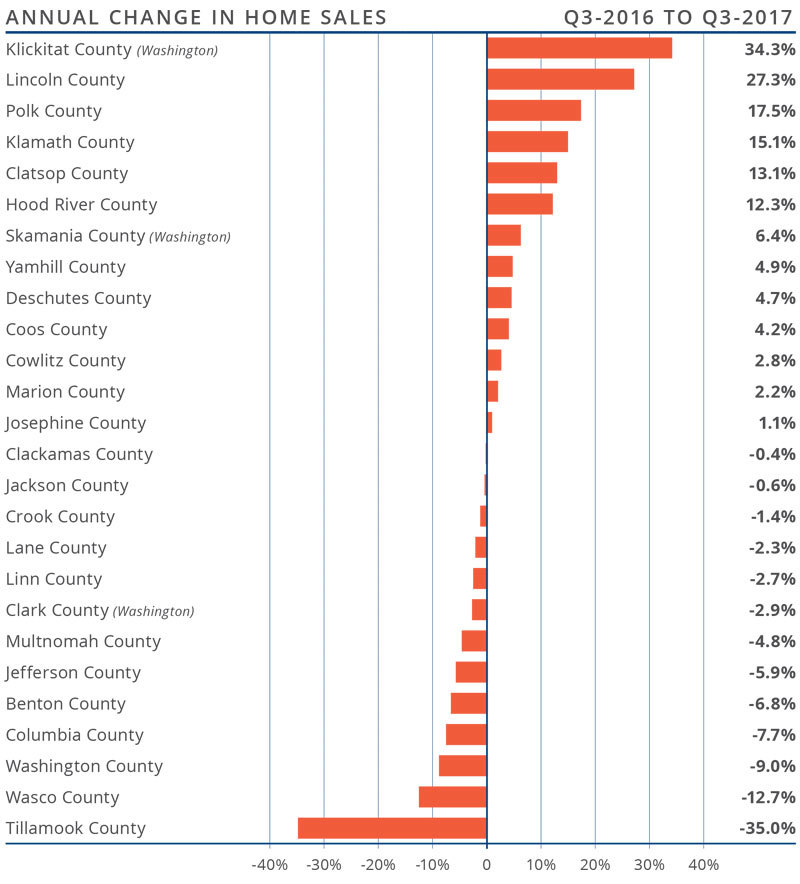
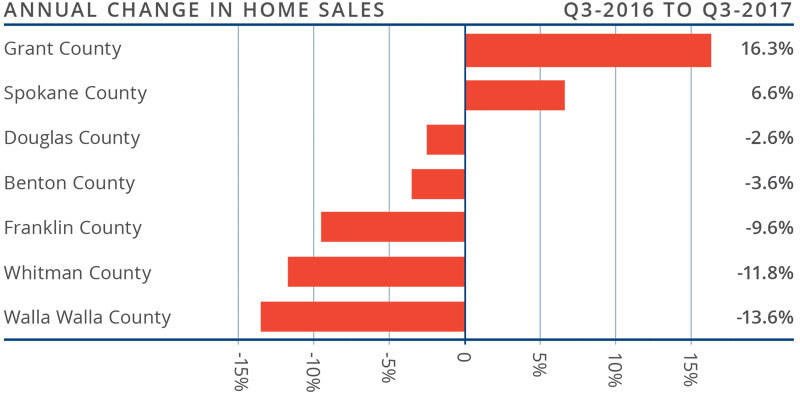
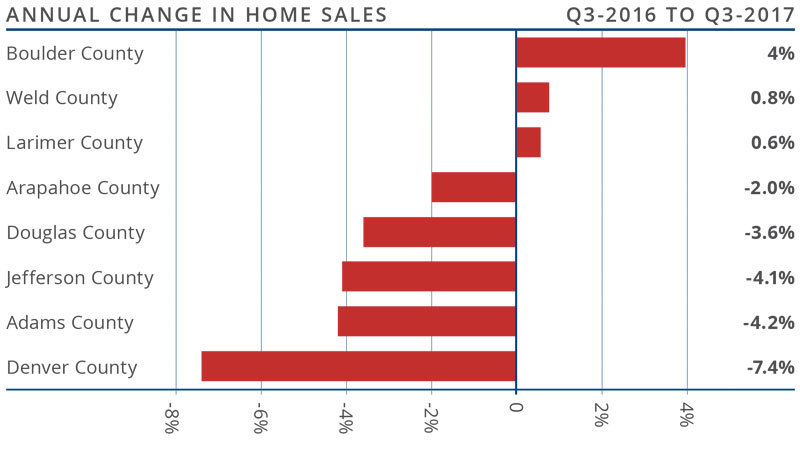
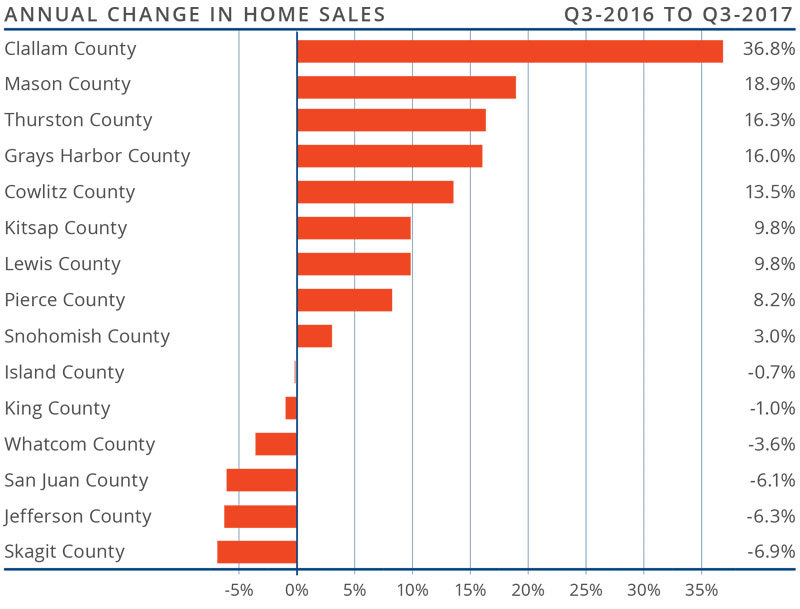
- Third quarter home sales dropped by a very modest 1.5% when compared to the same period last year, with a total of 18,724 homes sold.
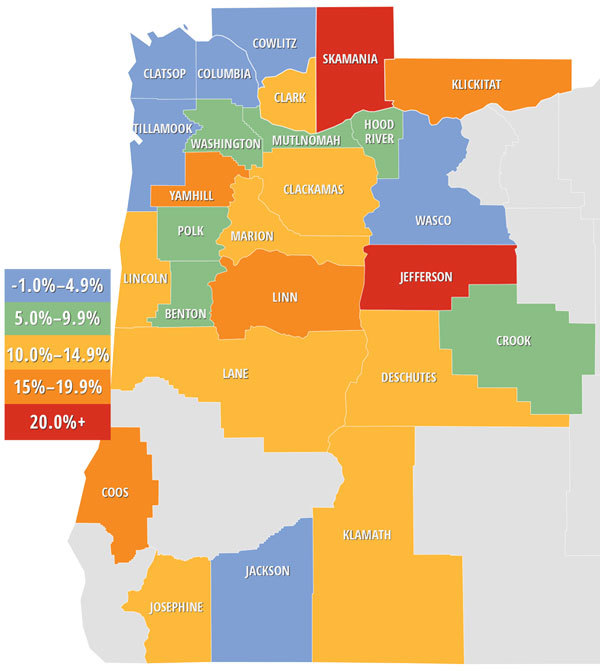
- Sales rose the fastest in Klickitat County, which had a 34.3% increase over the third quarter of 2016. There were also noticeable sales increases in Lincoln, Polk, Klamath, Clatsop, and Hood River Counties. Home sales fell the most in Tillamook, Washington, and Wasco Counties.
- Year-over-year sales rose in 13 counties, but dropped in the other 13.
- The low level of available inventory continues to affect the market, causing sales to slow.
HOME PRICES
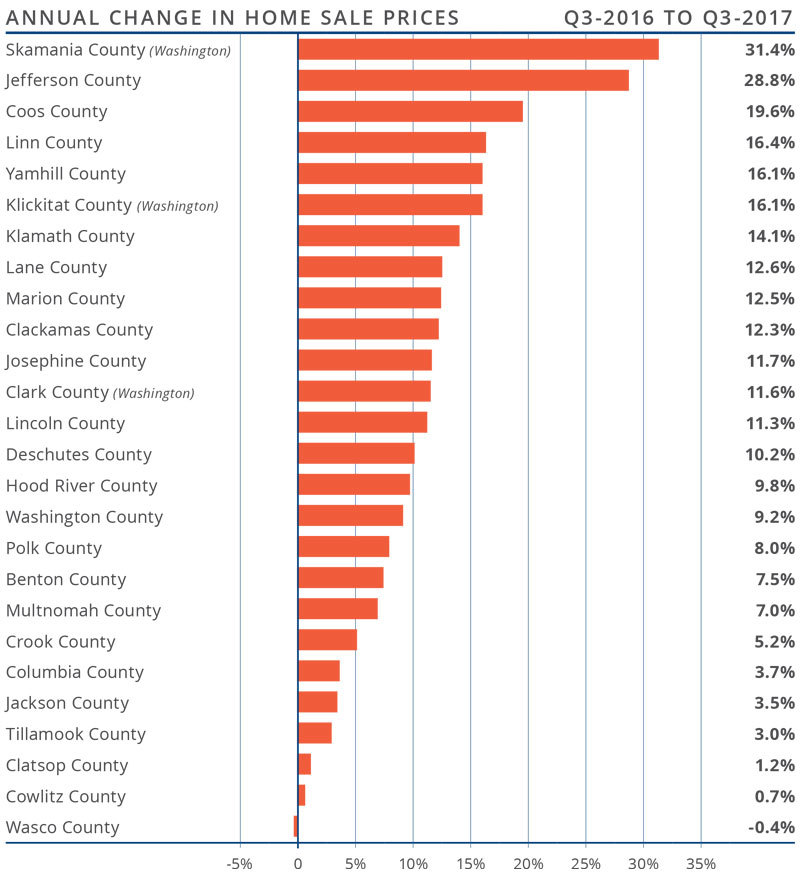
- The average home price in the region rose 9.4% year-over-year to $368,292. This is also up 1.5% from the second quarter of 2017.
- Skamania County led the market with the strongest annual price growth. Homes there sold for 31.4% more than a year ago.
- All counties other than Wasco County experienced rising prices when compared to the third quarter of 2016, and a majority saw significant, double-digit increases.
- Interest rates in the third quarter dropped by one tenth of a point from Q2, which likely allowed home price growth to rise at a faster rate than earlier in the year.
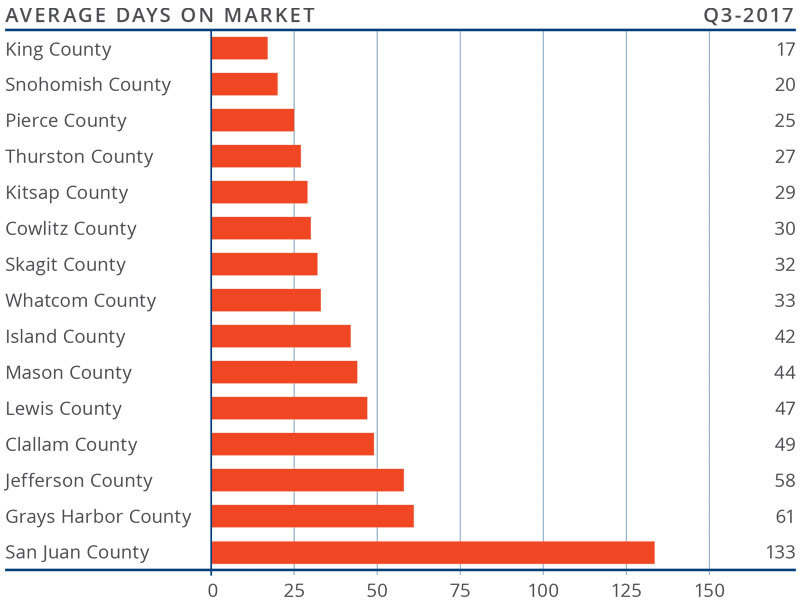
DAYS ON MARKET
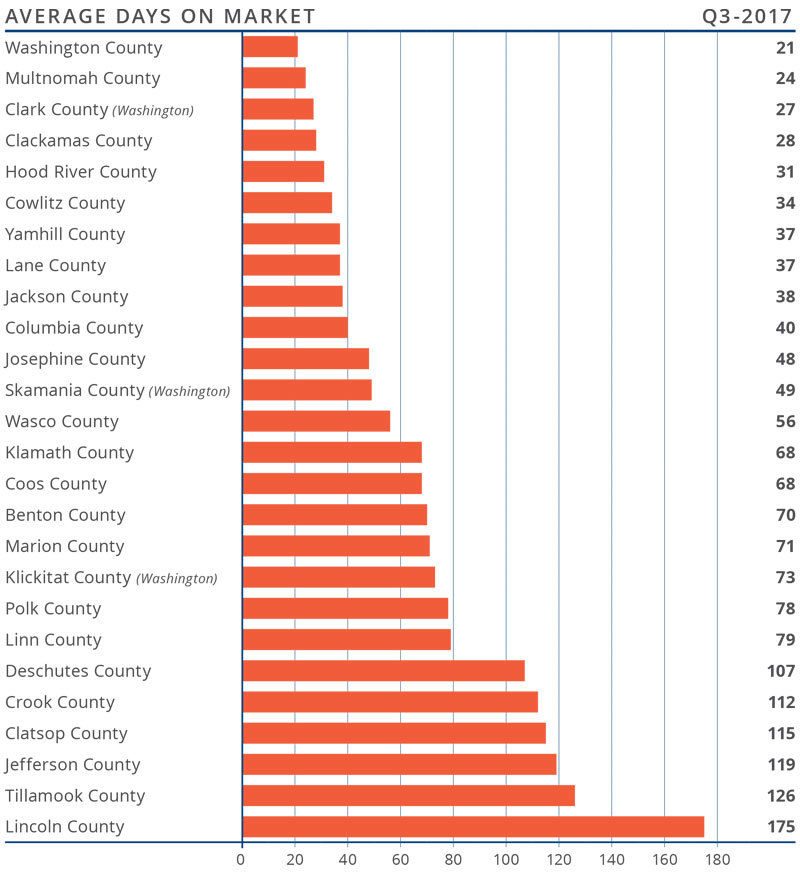
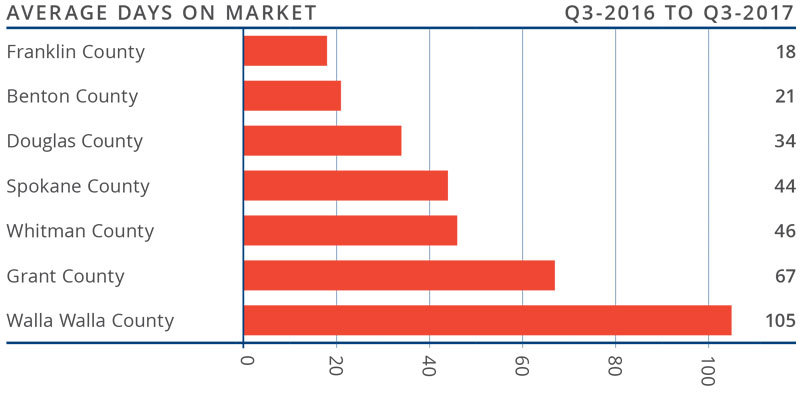
- The average number of days it took to sell a home in the region dropped by 14 days compared to the third quarter of 2016, and was down 9 days from the second quarter of this year.
- The average time it took to sell a home in the region last quarter was 67 days.
- Only four counties saw the length of time it took to sell a home rise compared to a year ago, but I do not see this as a major issue.
- Homes sold the fastest in Washington and Multnomah Counties, where it took an average of just 21 and 24 days, respectively, for homes to sell.
CONCLUSIONS
 The speedometer reflects the state of the region’s housing market using housing inventory, price gains, home sales, interest rates, and larger economic factors. Housing markets throughout Oregon continue to benefit greatly from the healthy regional economy.
The Oregon/SW Washington housing market remains remarkably strong and, given that inventory levels are unlikely to increase as we head toward the end of the year, sellers remain in the driver’s seat. I have, therefore, moved the needle slightly more toward sellers for the third quarter.

Matthew Gardner is the Chief Economist for Windermere Real Estate, specializing in residential market analysis, commercial/industrial market analysis, financial analysis, and land use and regional economics. He is the former Principal of Gardner Economics, and has more than 30 years of professional experience both in the U.S. and U.K.
If you are in the market to buy or sell, we can connect you with an experienced agent here.

 Year-over-year, the average home price in the region rose by 7.8% to $249,238, and prices were up by 3% compared to last quarter. Price growth has been moderating across the region, but several counties continue to see well-above-average appreciation.
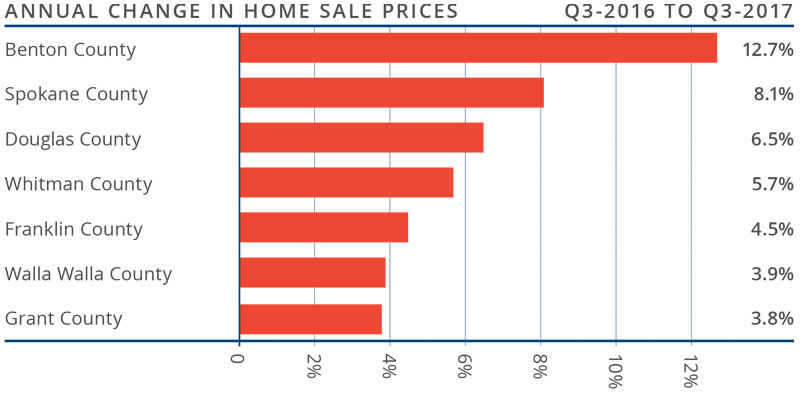
 This speedometer reflects the state of the region’s housing market using housing inventory, price gains, home sales, interest rates, and larger economic factors. Given the drop in listings, increase in pending and closed sales, and rising home prices in third quarter, I moved the needle a little more in favor of sellers. The fall and winter months will continue favoring sellers with demand exceeding supply.
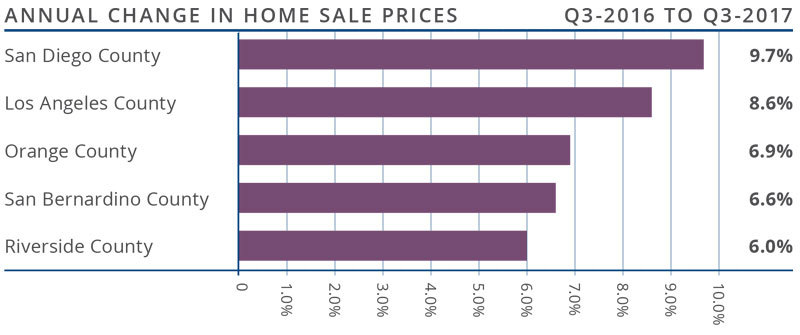
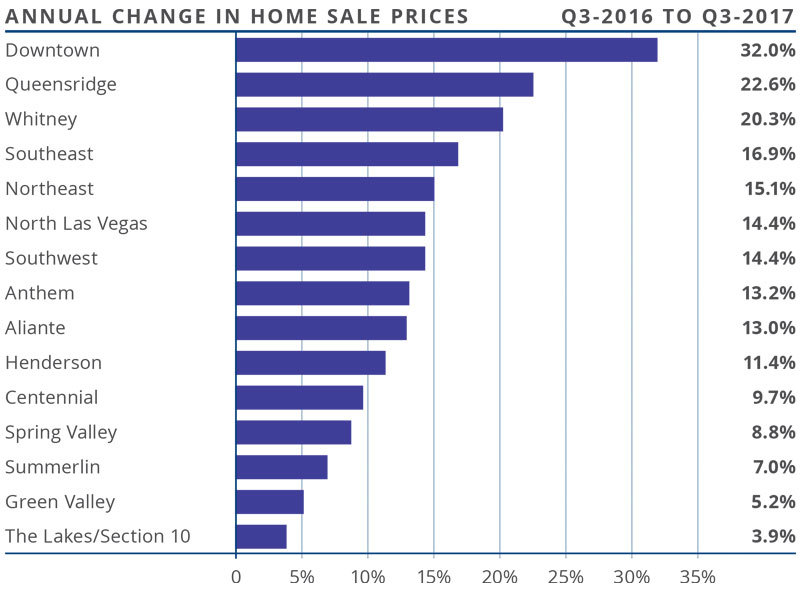
 With substantial competition for the few available homes, prices continue to rise. Average prices were up 7.5% year-over-year to a regional average of $428,602.
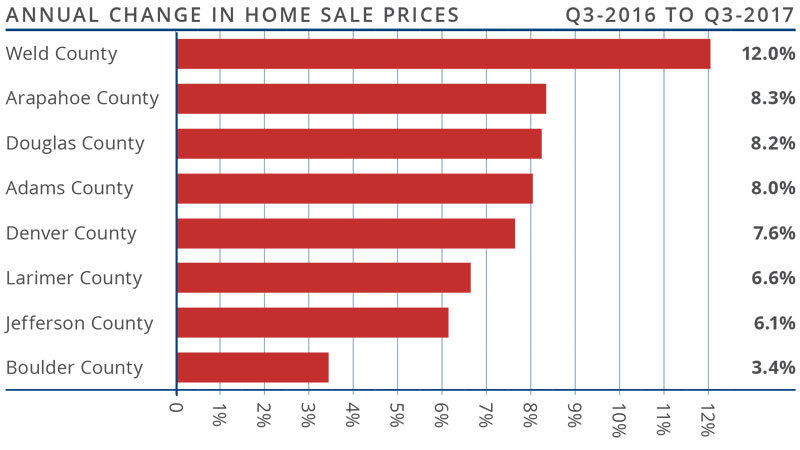

 This speedometer reflects the state of the region’s housing market using housing inventory, price gains, home sales, interest rates, and larger economic factors.


 There were 51,906 home sales in the third quarter of this year. This was 0.5% lower than the same period in 2016, and 4.8% lower than in the second quarter of this year.
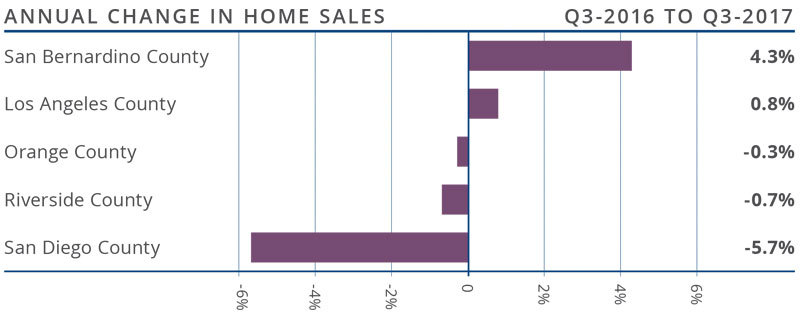
 The speedometer reflects the state of the region’s housing market using housing inventory, price gains, home sales, interest rates, and larger economic factors.
 Employment in the Las Vegas metropolitan area continues to moderate from the substantial growth of the past few years, but the region still experienced impressive annual employment growth of 3%. The market has added 28,400 new jobs over the past 12 months. With this growth in employment, the unemployment rate came in at 5.2%.
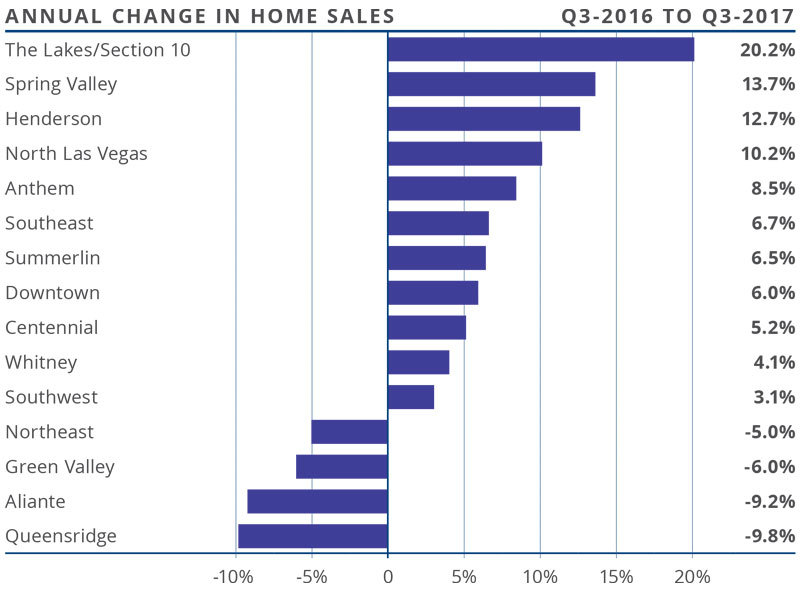
 The speedometer reflects the state of the region’s housing market using housing inventory, price gains, home
 Given tight supply levels, it is unsurprising to see very solid price growth across the Western Washington counties. Year-over-year, average prices rose 12.3% to $474,184. This is 0.9% higher than seen in the second quarter of this year.
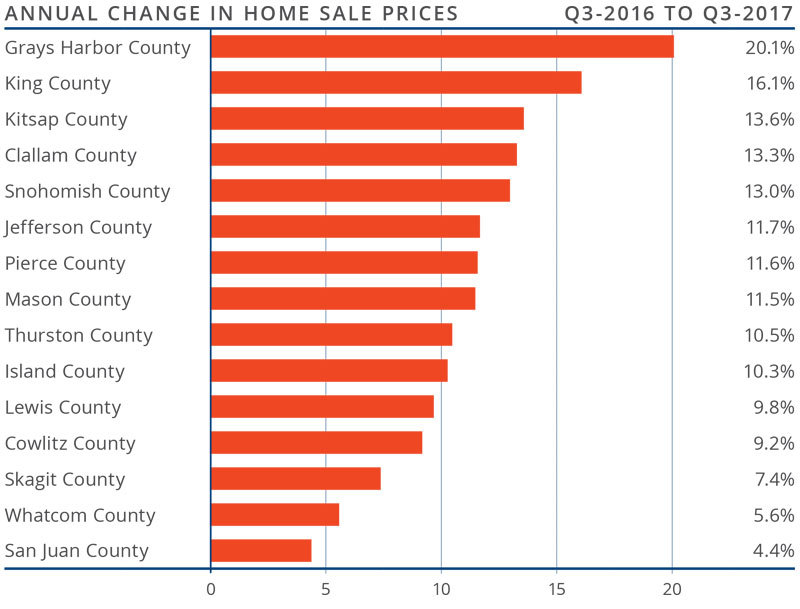
 This speedometer reflects the state of the region’s housing market using housing inventory, price gains, home sales, interest rates, and larger economic factors. For the third quarter of 2017, I have left the needle at the same point as the second quarter. Though price growth remains robust, sales activity has slowed very slightly and listings jumped relative to the second quarter. That said, the market is very strong and buyers will continue to find significant competition for accurately priced and well-located homes.


")


