
 Facebook
 X
X
 Pinterest
 Copy Link
Q3 2023 Southern California Real Estate Market Update

The following analysis of select counties of the Southern California real estate market is provided by Windermere Real Estate. We hope that this information may assist you with making better-informed real estate decisions. For further information about the housing market in your area, please don’t hesitate to contact your Windermere Real Estate agent.
Regional Economic Overview
The Southern California market areas contained in this report have been experiencing a fairly significant slowdown in job growth. That said, the region has added 164,700 jobs since the third quarter of 2022, representing a growth rate of 1.7%. The end of the writers’ strike will add a little boost to the Los Angeles area, which has still added over 89,000 jobs over the past 12 months. Orange County employment has grown by 34,100 jobs; San Diego County is higher by 31,400; and employment was up 9,700 jobs in Riverside.
The region’s unemployment rate in August was 5.2%, which was up from 4.2% in the third quarter of 2022. The lowest jobless rate was in San Diego County, where it was 4.3%. The highest rate was in Los Angeles County, where 5.8% of the workforce was without a job.
Southern California Home Sales
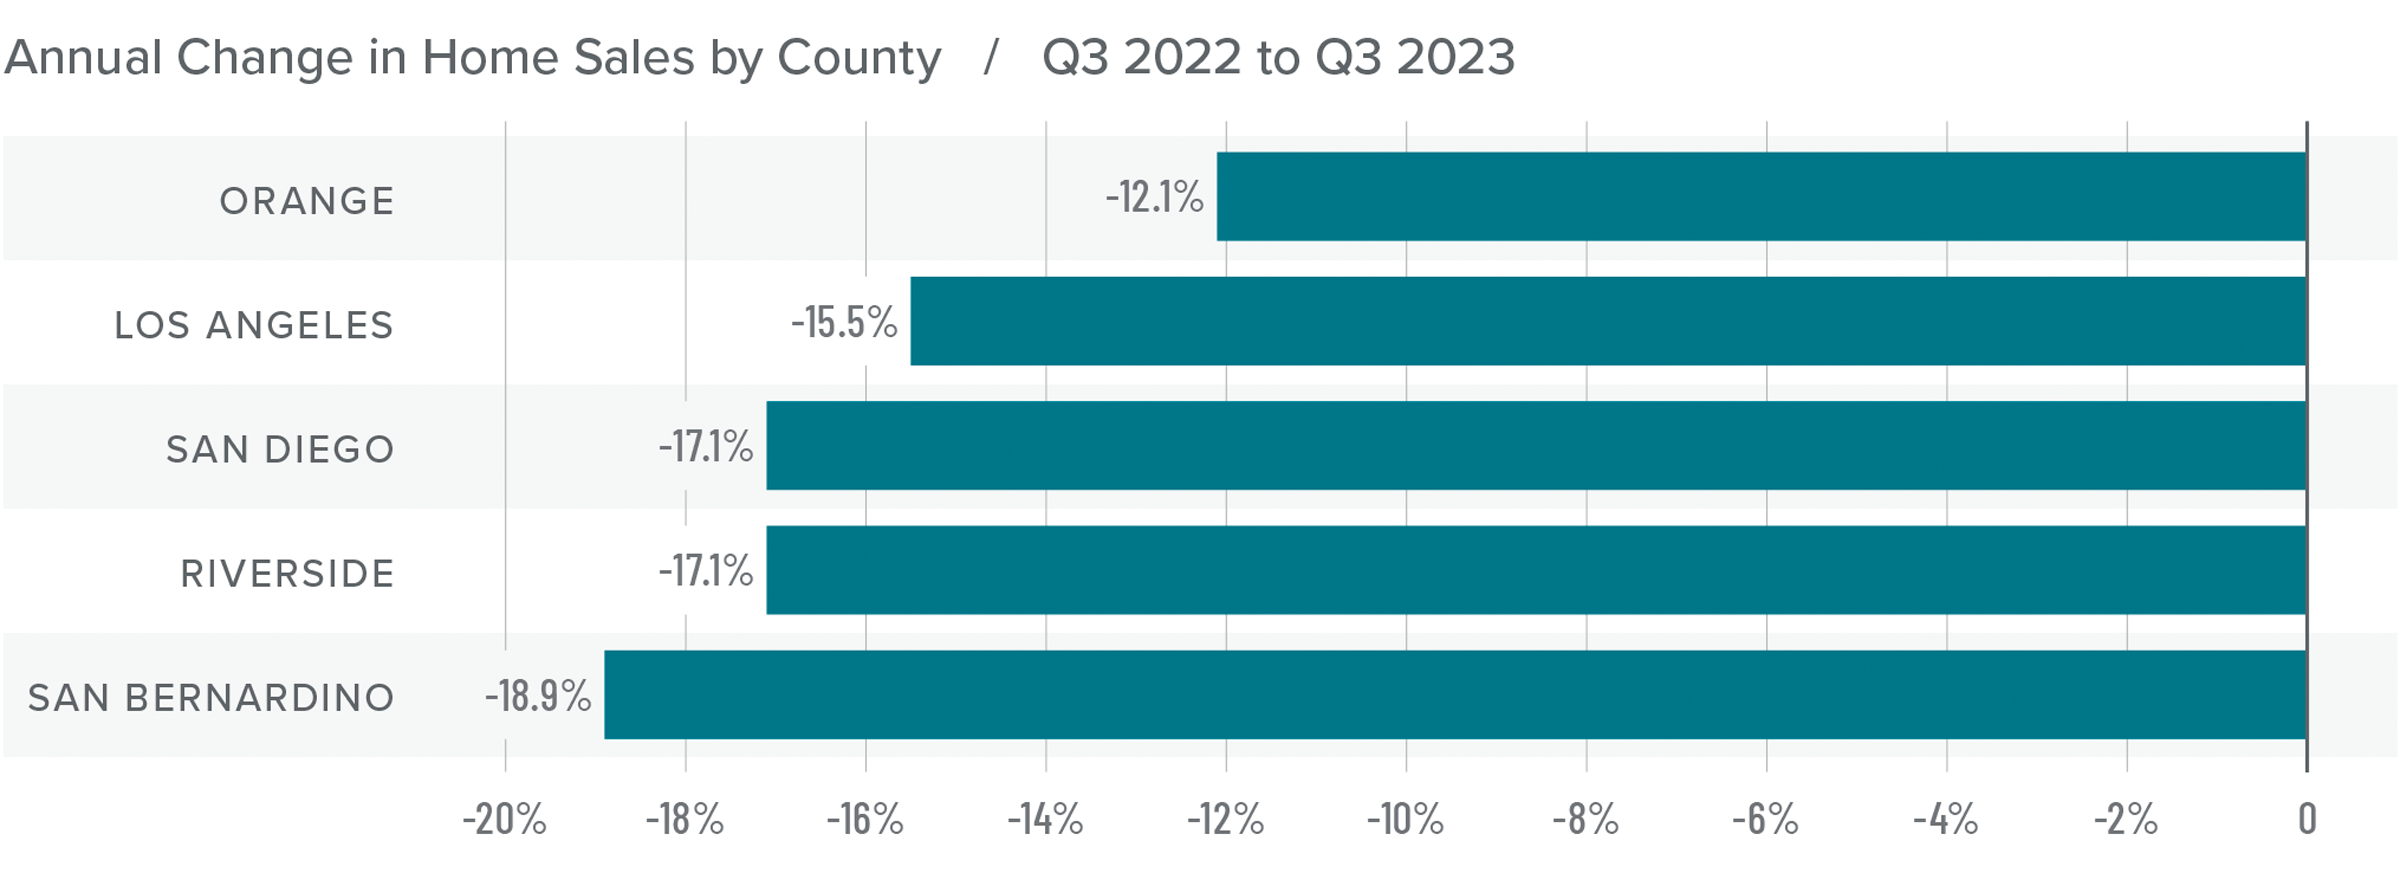
❱ In the third quarter of 2023, 32,398 homes sold, which was 16% lower than in the third quarter of 2022 and down 8.6% compared to the second quarter of this year.
❱ Pending home sales, which are an indicator of future closings, were 8.2% lower than in the second quarter, suggesting that closing numbers may be down in the final quarter of 2023.
❱ Compared to the third quarter of 2022, sales fell the most in San Bernardino County, though there was a significant decline in all markets. The quarter-over-quarter decline was disconcerting given that the number of homes for sale rose more than 14%. Rising mortgage rates are clearly taking their toll on the market.
❱ It’s discouraging that there were fewer sales despite rising inventory levels. Mortgage rates are definitely hobbling the market and until they start to drop, I think things will continue to be lackluster. List prices have started to pull back in response, as sellers realize that the market is not what it once was.
Southern California Home Prices
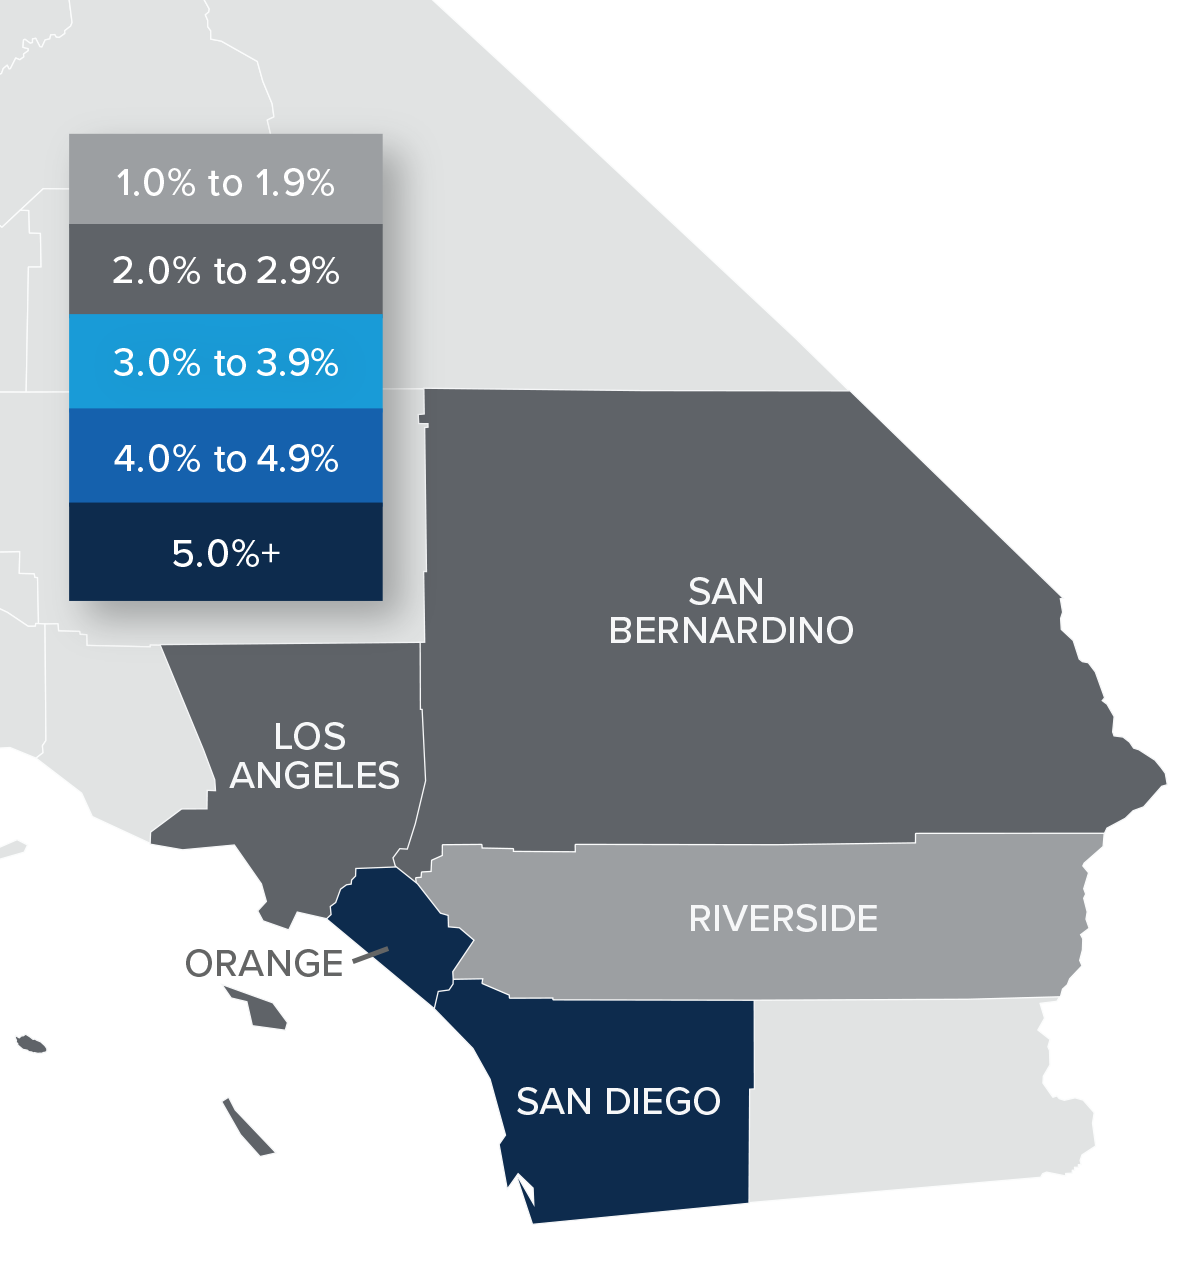
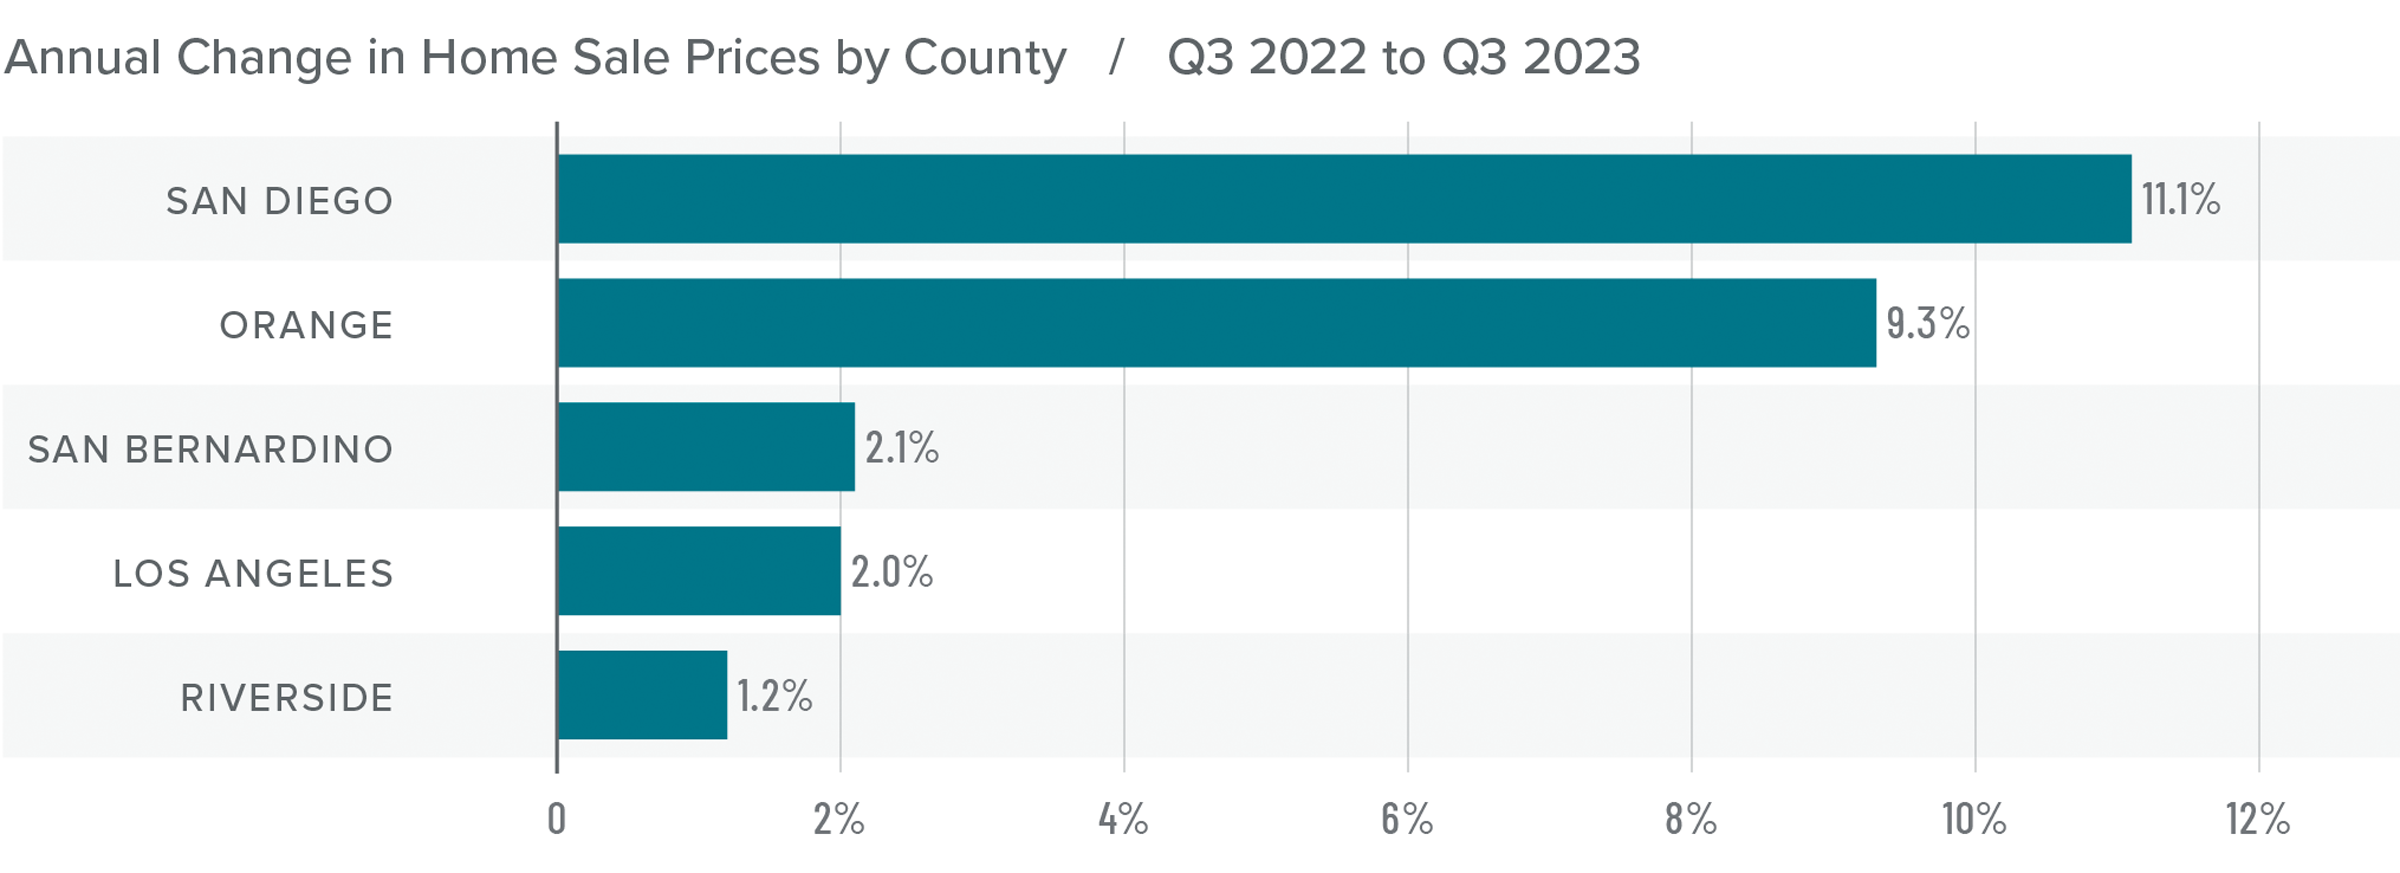
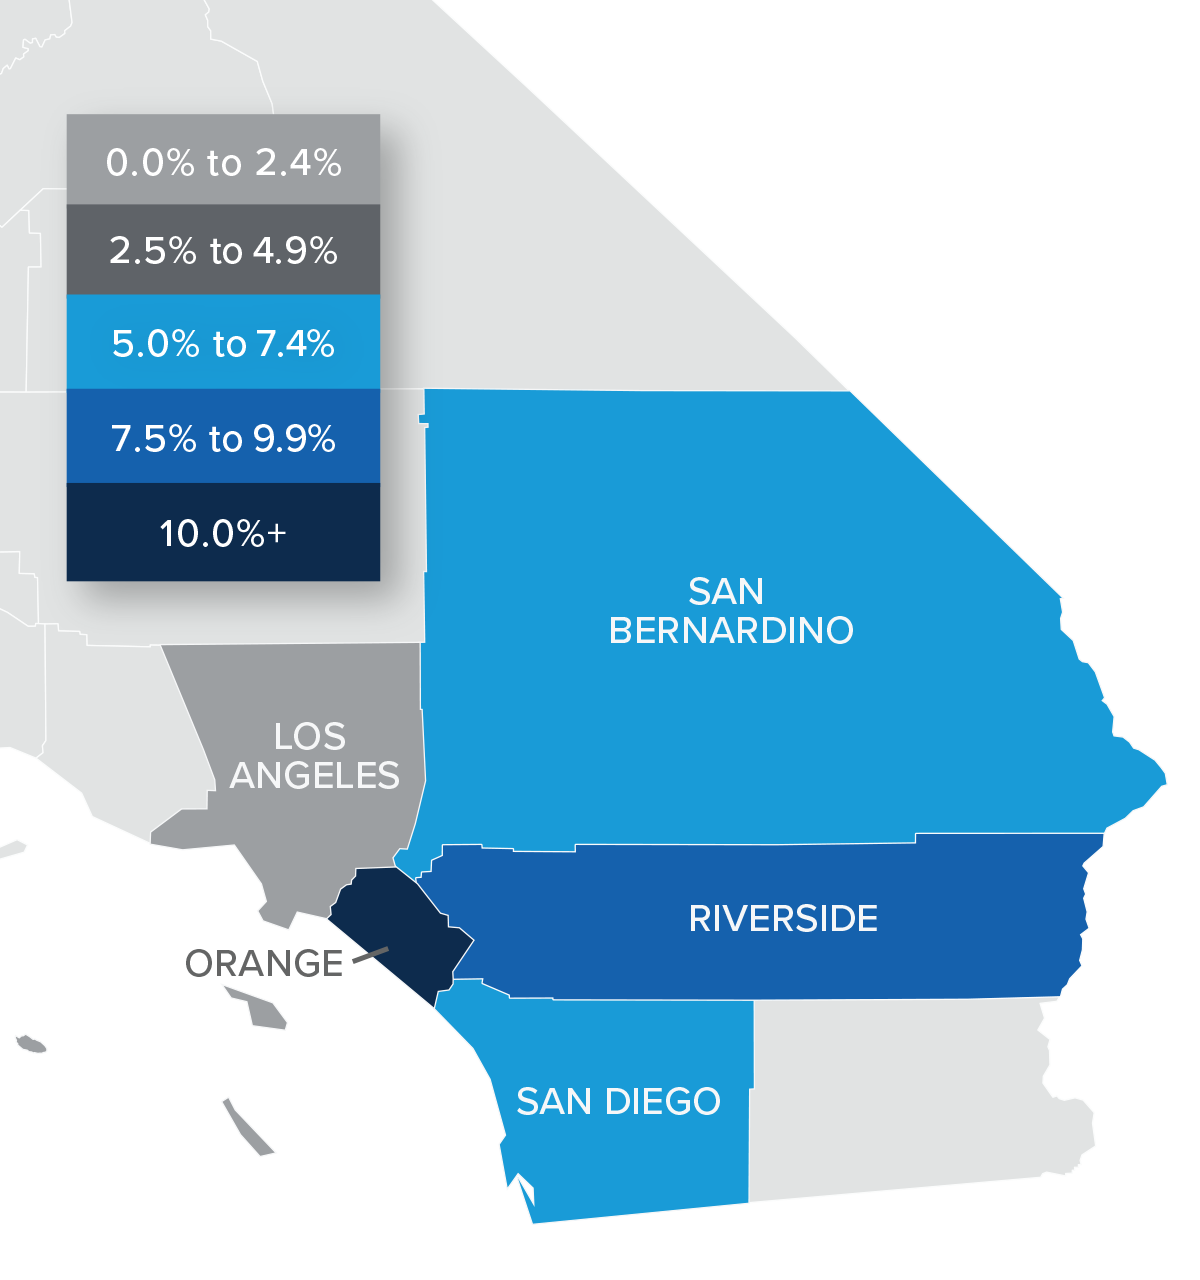
❱ Home sale prices were up 5.7% from the third quarter of 2022 and were 3.8% higher than in the second quarter of 2023.
❱ Affordability continues to be a major constraint in the region, which is being magnified by persistently high mortgage rates. Prices are holding, but growth has slowed significantly.
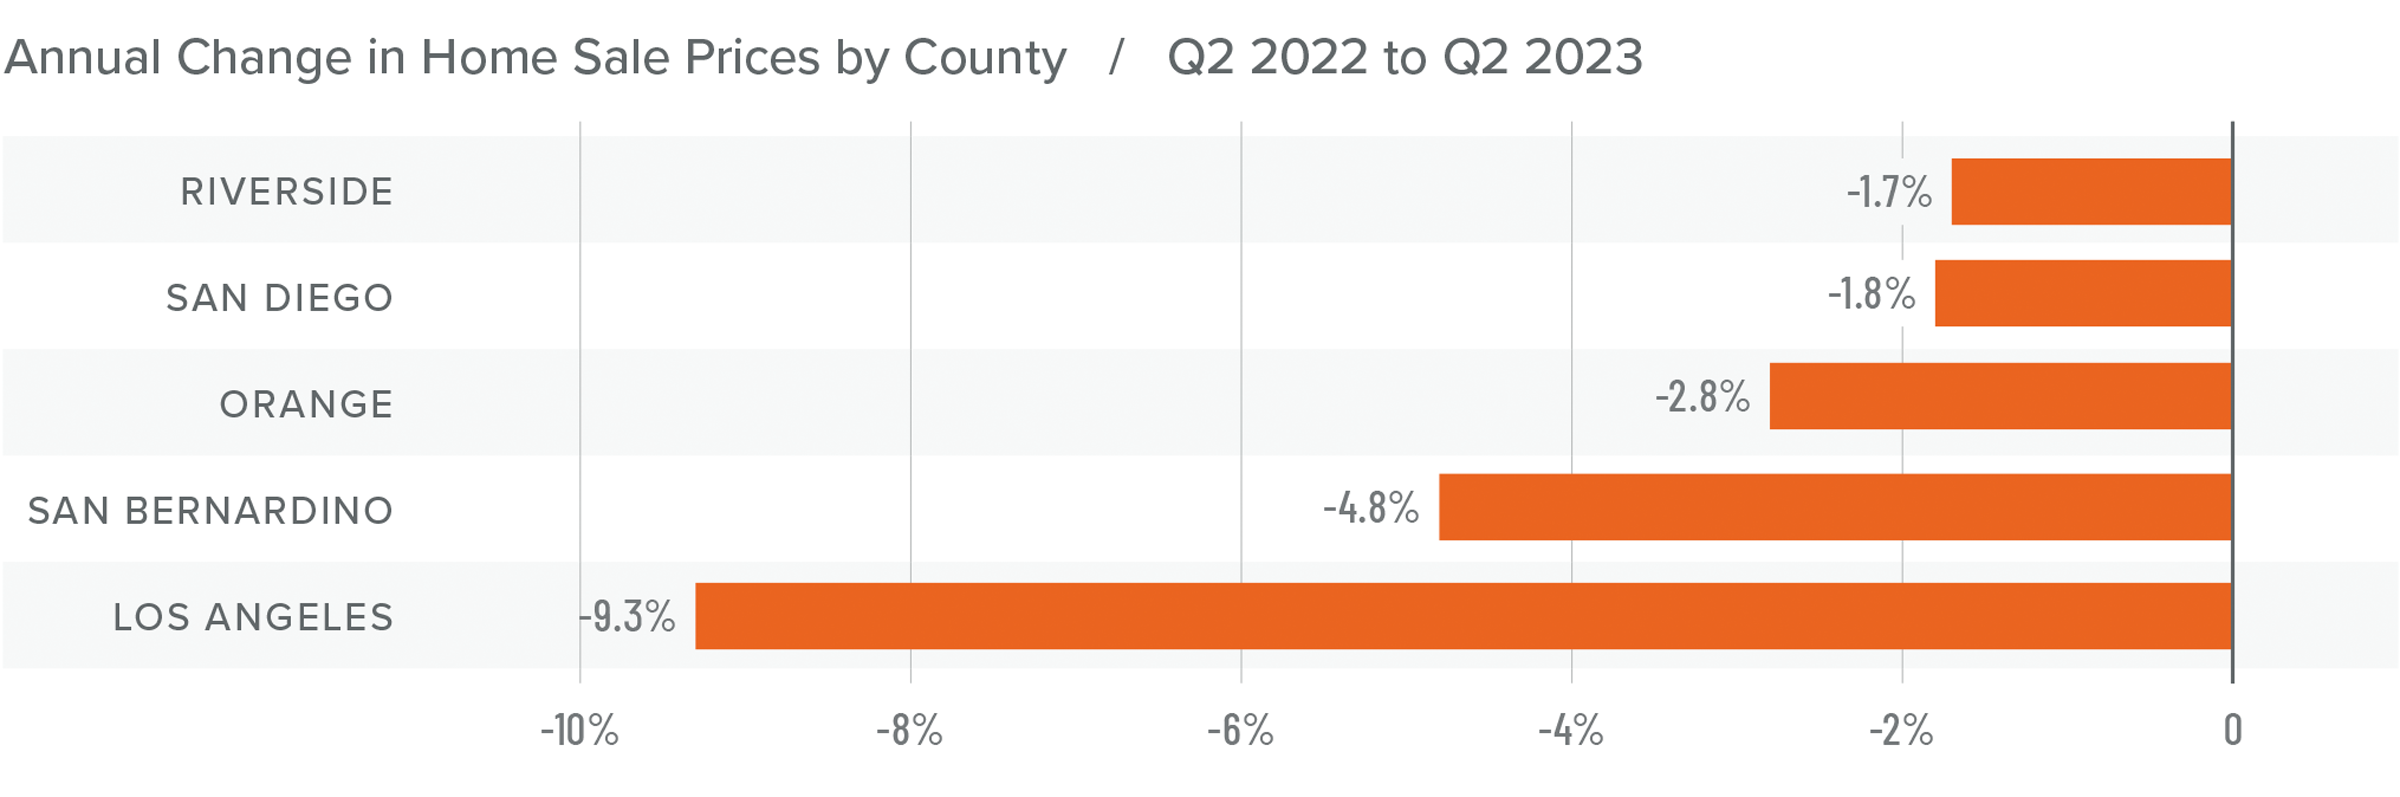
❱ Year over year, prices rose in all the markets contained in this report, with significant increases in San Diego and Orange counties. Compared to the second quarter of 2023, Riverside County saw prices fall by 5.8%, but they rose in the balance of the market areas.
❱ I expect price growth in Southern California to hold at or near the current pace. However, it’s very possible that home sale prices could drop a little if list prices fall further.
Mortgage Rates
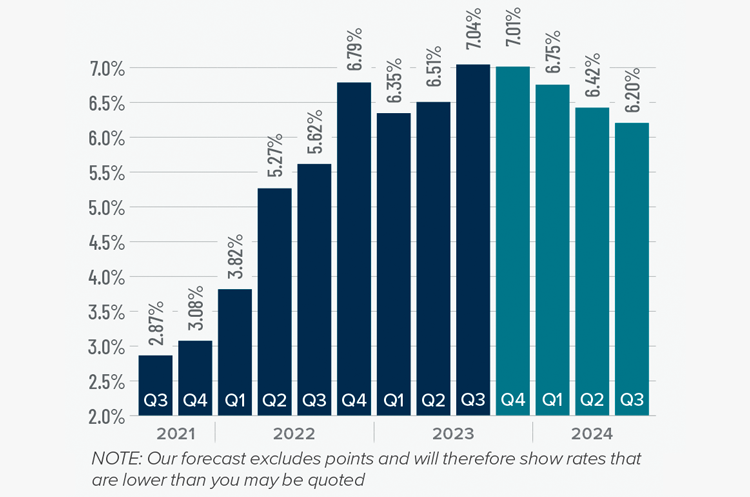
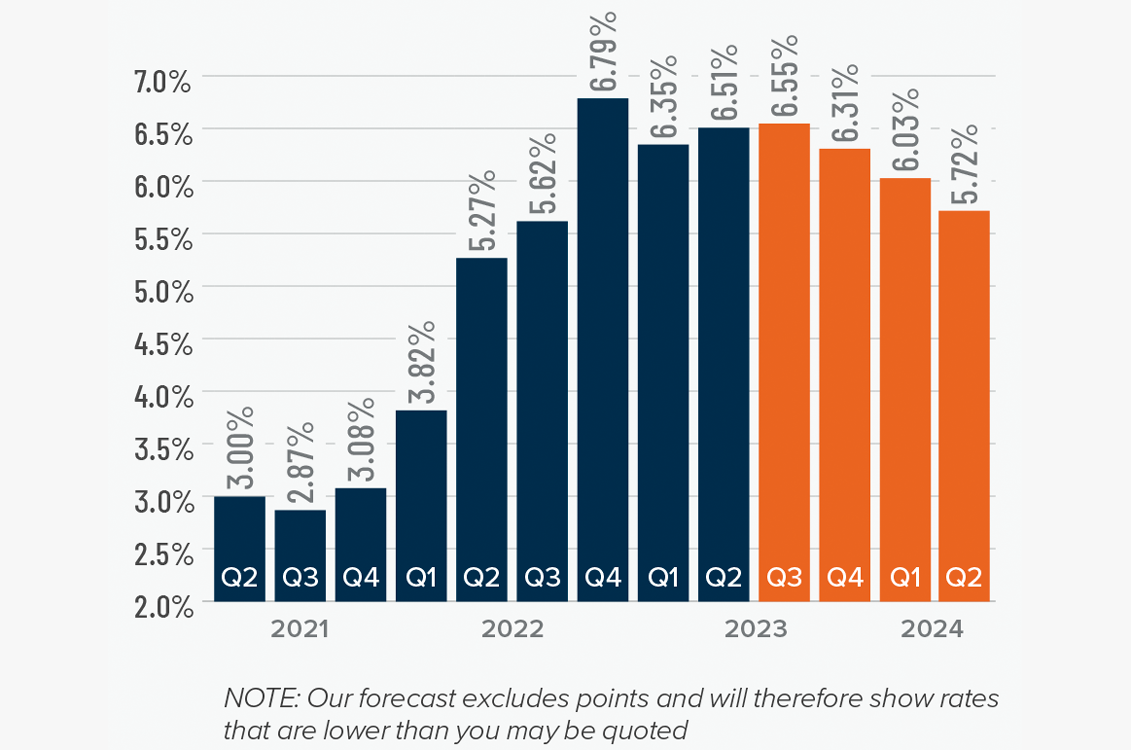
Mortgage rates continued trending higher in the third quarter of 2023 and are now at levels we have not seen since the fall of 2000. Mortgage rates are tied to the interest rate (yield) on 10-year treasuries, and they move in the opposite direction of the economy. Unfortunately for mortgage rates, the economy remains relatively buoyant, and though inflation is down significantly from its high, it is still elevated. These major factors and many minor ones are pushing Treasury yields higher, which is pushing mortgage rates up. Given the current position of the Federal Reserve, which intends to keep rates “higher for longer,” it is unlikely that home buyers will get much reprieve when it comes to borrowing costs any time soon.
With such a persistently positive economy, I have had to revise my forecast yet again. I now believe rates will hold at current levels before starting to trend down in the spring of next year.
Southern California Days on Market
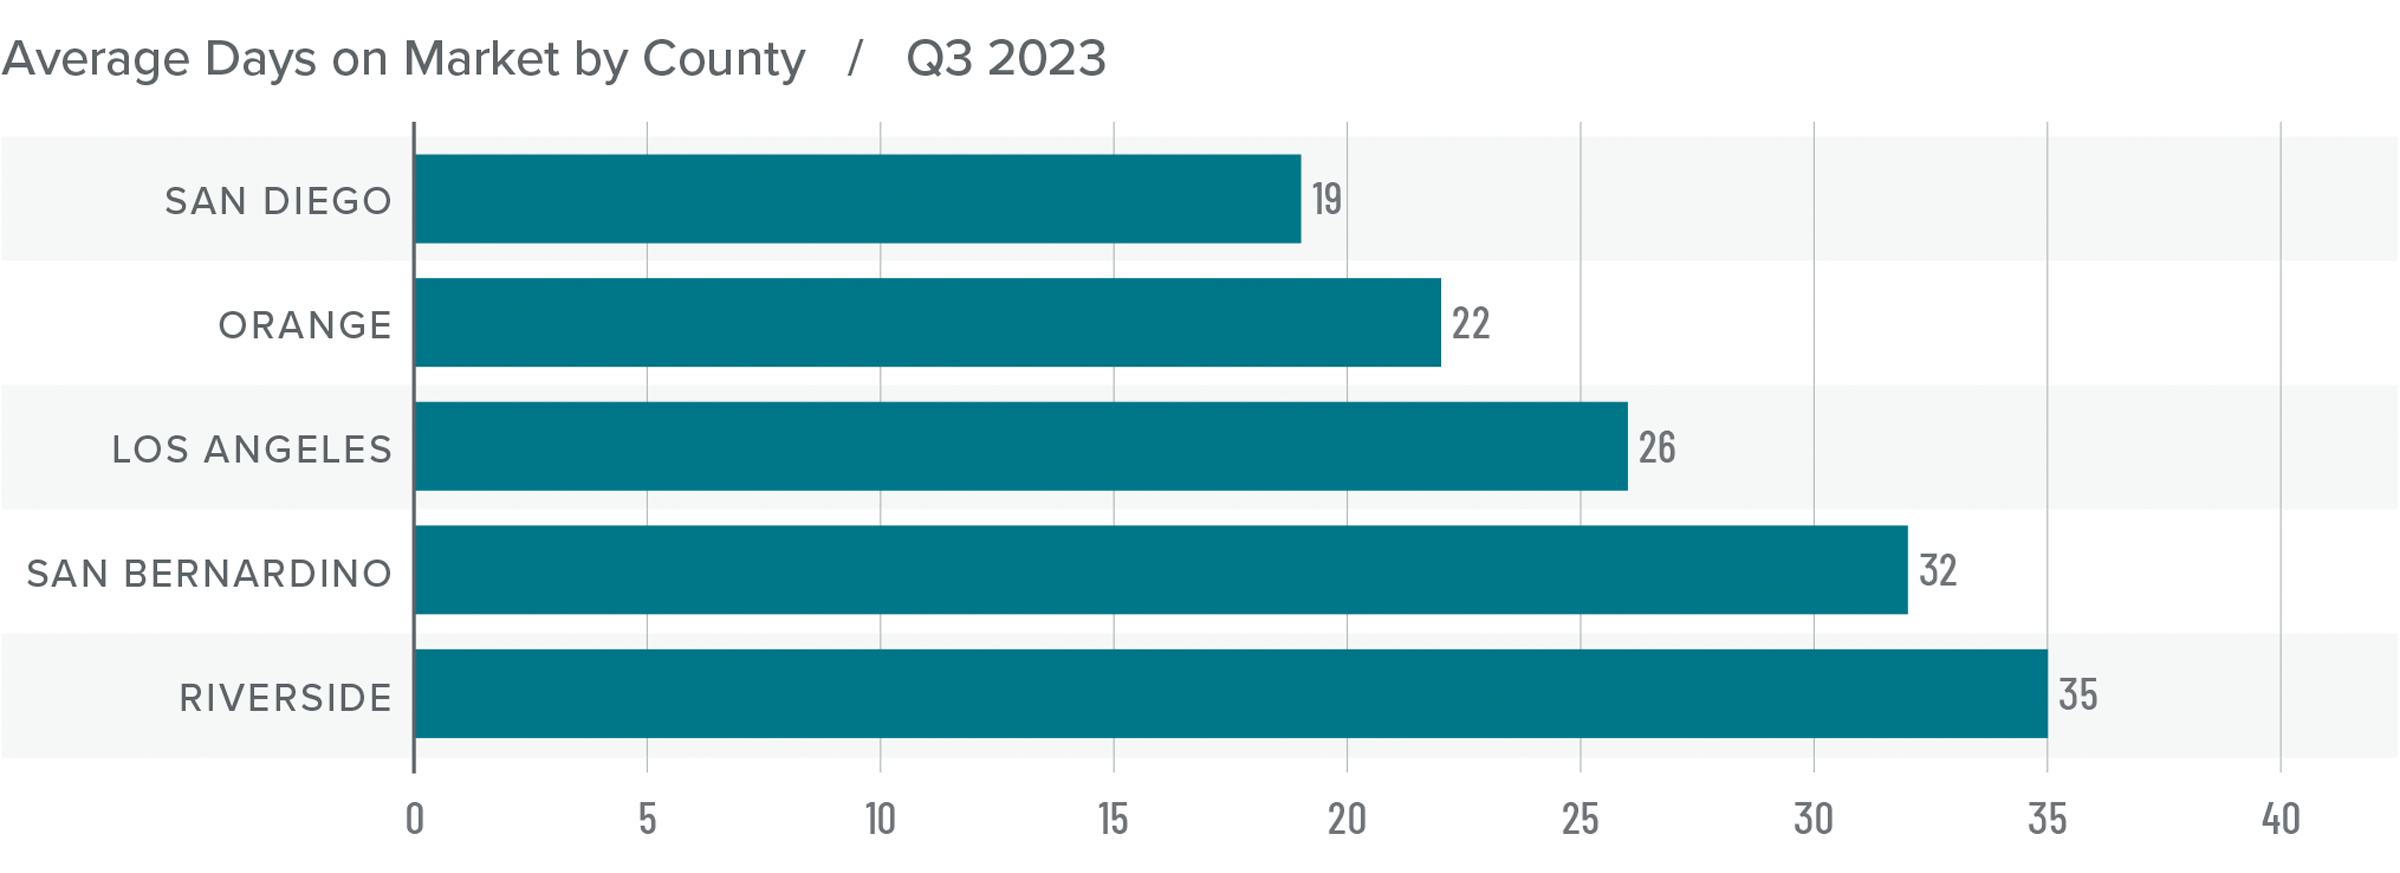
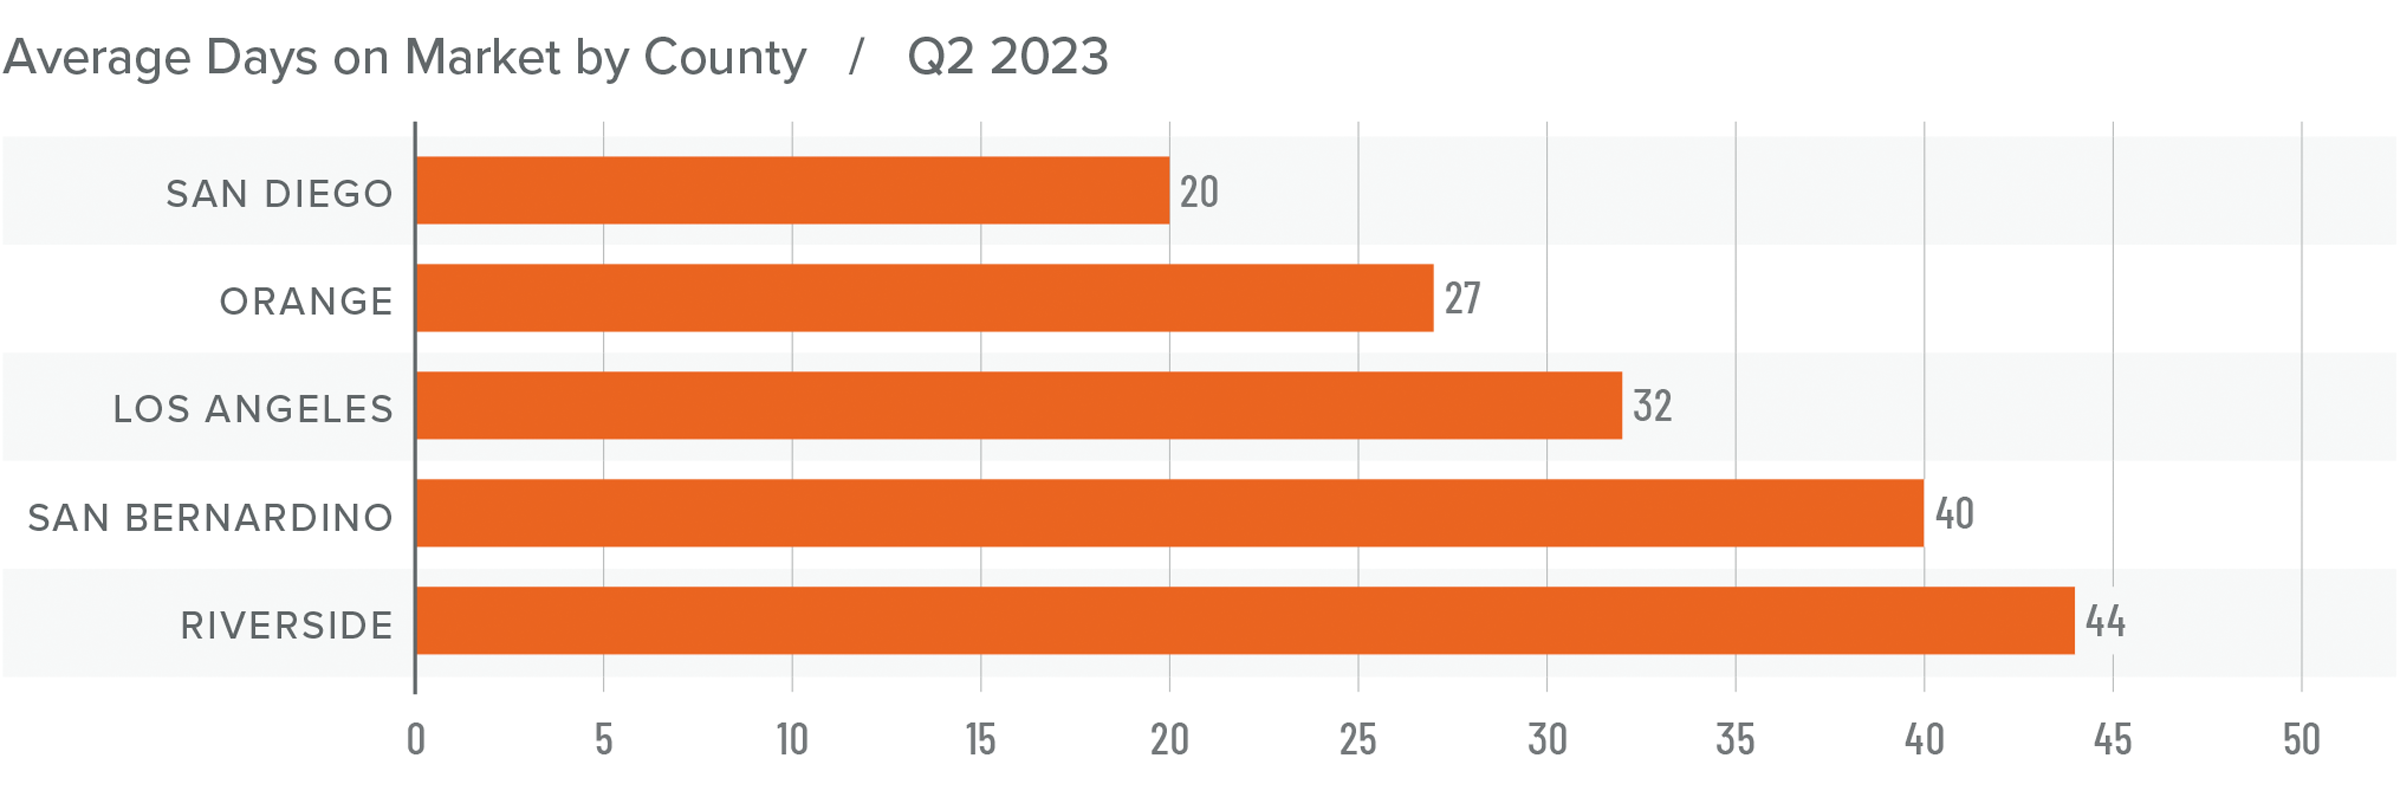
❱ In the third quarter of 2023, the average time it took to sell a home in the region was 27 days. This was up two days compared to the same period of 2022.
❱ Compared to the second quarter of 2023, market time fell six days and was lower across all counties covered by this report.
❱ Homes in San Diego County continue to sell at a faster rate than other markets in the region, but it took two fewer days to sell a home than it did in the third quarter of 2022. Orange County saw days on market fall by one day compared to the third quarter of 2022, but market time rose everywhere else.
❱ Homebuyers saw rising inventories, and those who chose to make offers did so relatively quickly, even though the total number of sales fell. If the number of homes for sale continues to rise, it may also cause market time to rise as buyers become more selective.
Conclusions
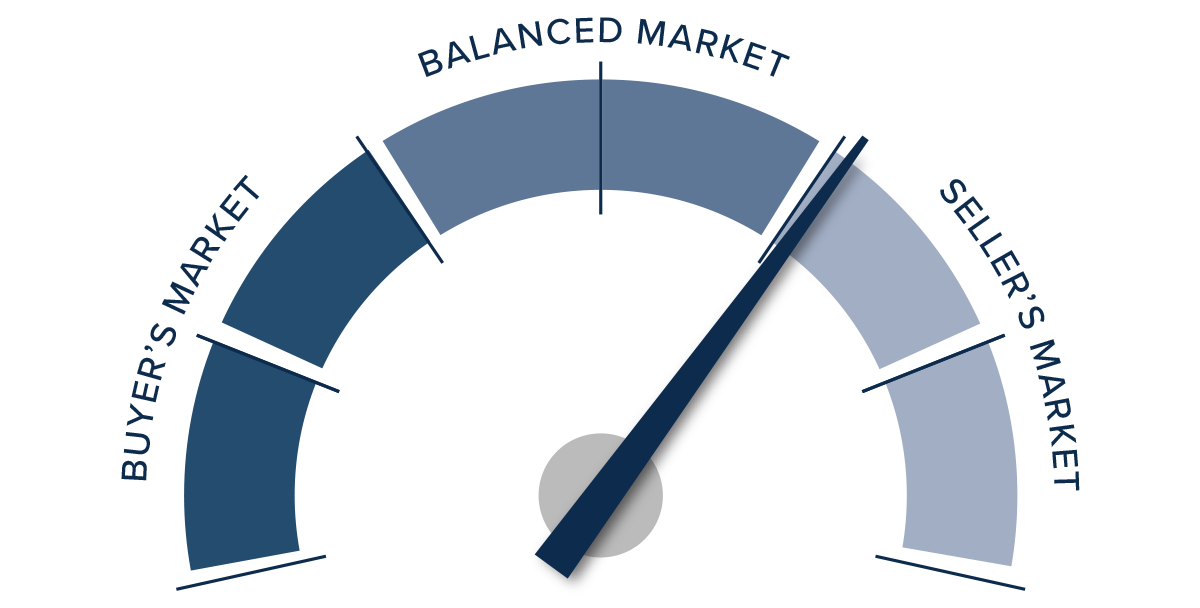
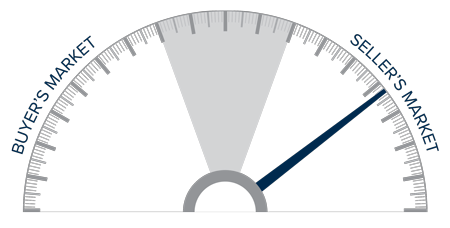
This speedometer reflects the state of the region’s real estate market using housing inventory, price gains, home sales, interest rates, and larger economic factors.
With inventory levels rising, and sales and asking prices falling, it would be easy to suggest that home buyers have the upper hand. However, home prices are still rising, albeit slowly, which tends to favor sellers.
The quandary really comes down to the fact that while inventory levels have risen, they remain remarkably low compared to historic averages. It’s also likely that the buyers who are still in the market are looking to move more from necessity than desire, which makes sense given today’s high mortgage rates.
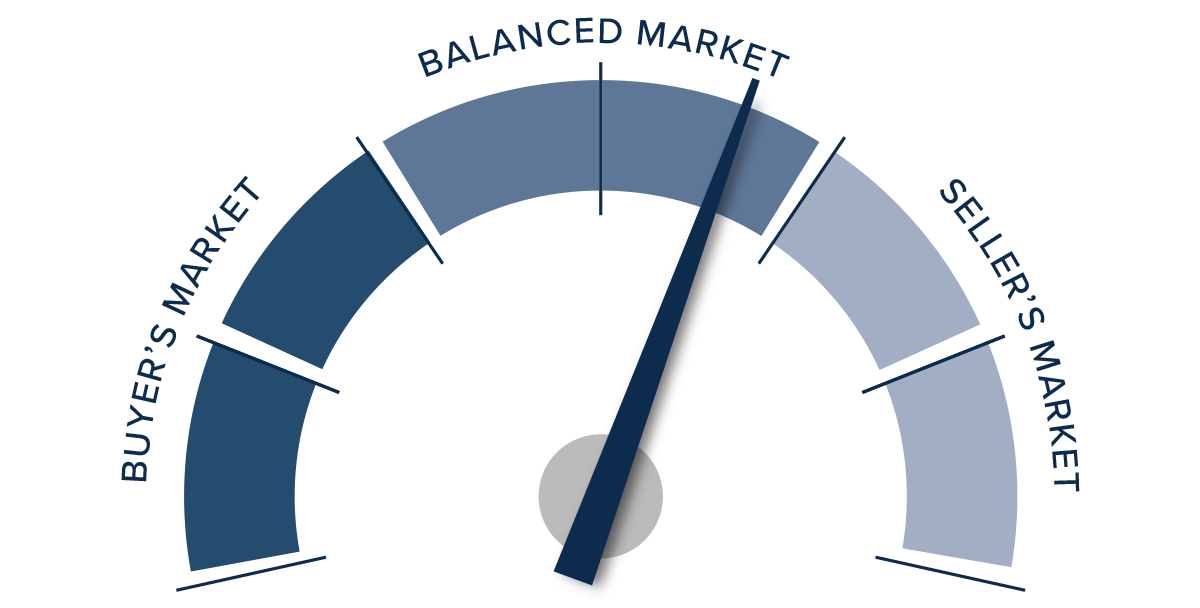
That has put us in a very unusual situation. Although sellers are being a little more competitive, as evidenced by the drop in list prices, they have not totally capitulated. Taking all these factors into consideration, the needle moves back to the middle of the speedometer. We simply don’t see either side as having the upper hand at the present time.
Q2 2023 Southern California Real Estate Market Update

The following analysis of select counties of the Southern California real estate market is provided by Windermere Real Estate Chief Economist Matthew Gardner. We hope that this information may assist you with making better-informed real estate decisions. For further information about the housing market in your area, please don’t hesitate to contact your Windermere Real Estate agent.
Regional Economic Overview
The Southern California market areas contained in this report added 222,700 jobs over the past 12 months, representing a decent growth rate of 2.4%. Although layoffs in the tech sector and the writers’ strike have been dominating headlines, payrolls in Southern California continue to expand. The Los Angeles market has added over 60,000 jobs through the first five months of this year. This was followed by Orange County, which added 19,000 jobs. San Diego County added 16,600 jobs, and employment grew by 6,700 jobs in Riverside County. The region has seen the pace of employment growth slow, but this appears to be more an issue of labor supply rather than a lack of demand. The region’s unemployment rate in May was 4.3%, up from 3.7% in the same quarter of 2022. The lowest jobless rates were in Orange County (3.2%) and San Diego County (3.5%). The highest rate was in Los Angeles County, where 4.8% of the workforce was without a job.
Southern California Home Sales
❱ In the second quarter of 2023, 35,381 homes sold, which was 25.9% lower than in the second quarter of 2022 but up an impressive 27.7% compared to the first quarter of 2023.
❱ Pending home sales, an indicator of future closings, were 13.9% higher than in the first quarter, suggesting that sales activity has room to rise further as we move into the second half of the year.
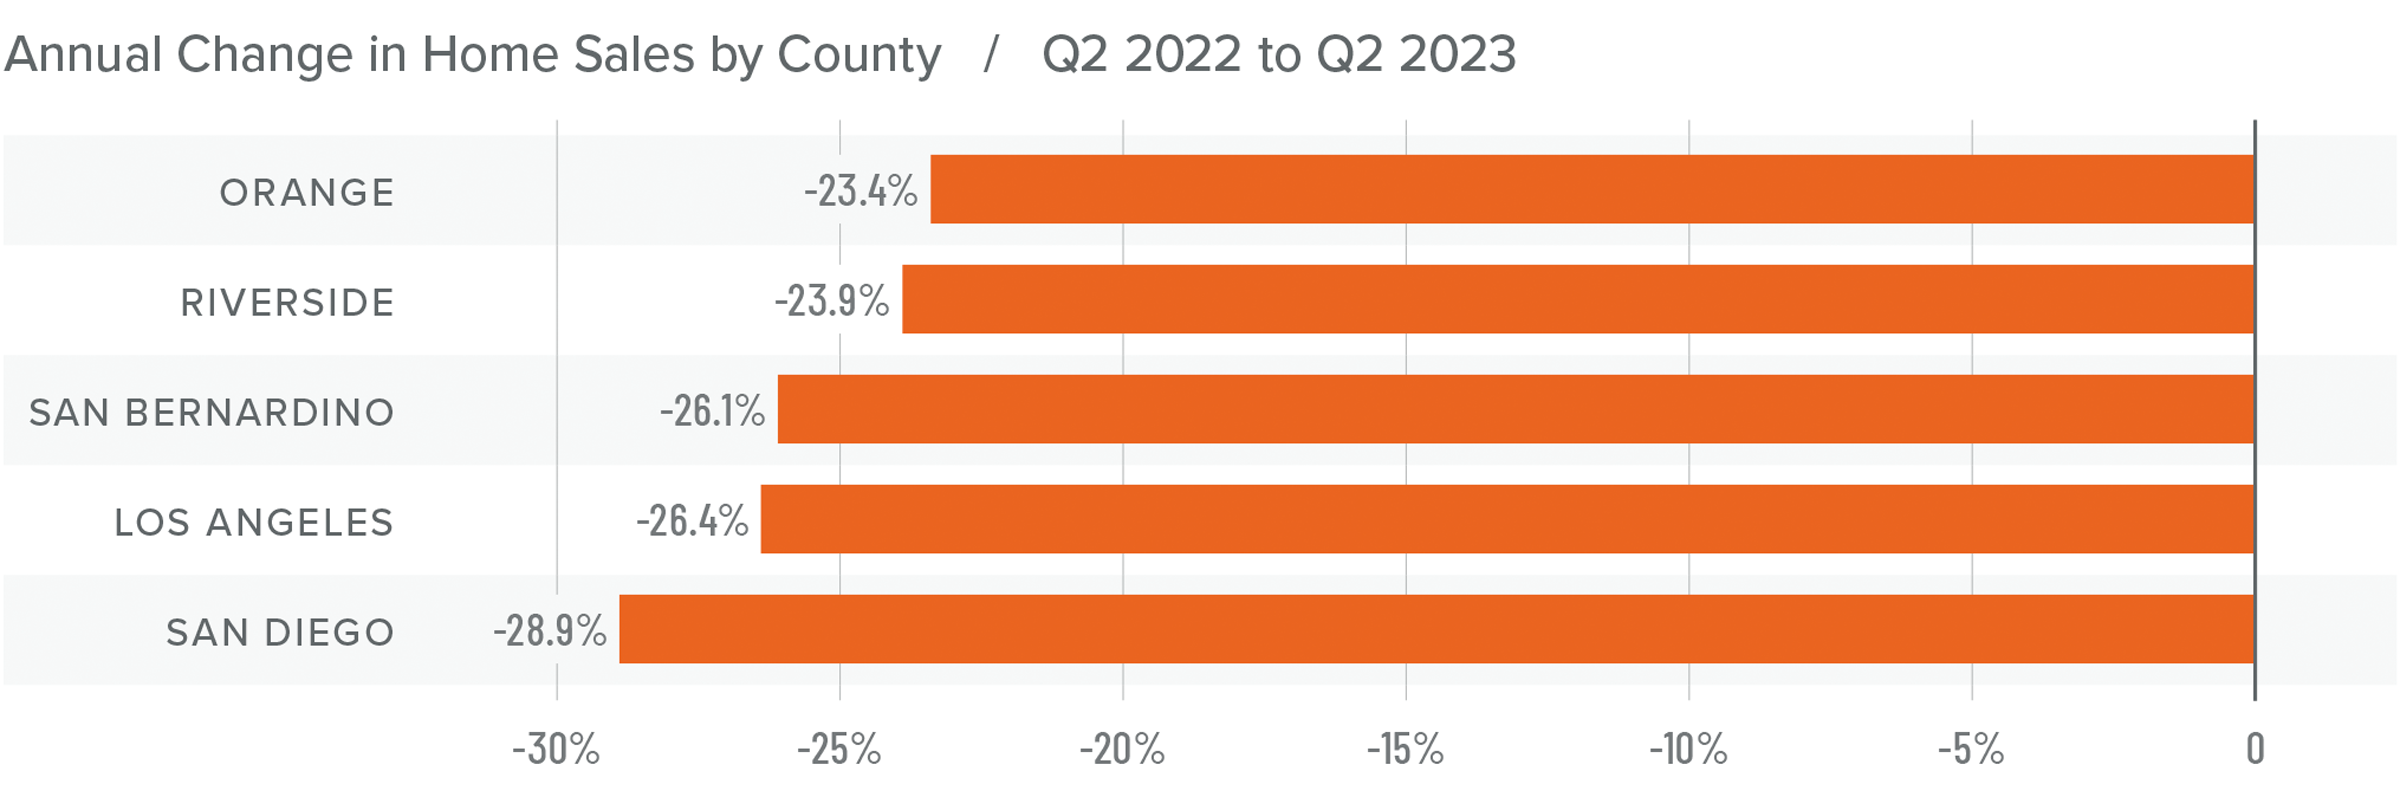
❱ Compared to the same quarter in 2022, sales fell across the board. However, the market heated up in the second quarter compared to the first quarter of 2023: sales were up 36% in Orange County, 29.6% in Los Angeles County, 28.4% in San Bernardino County, 24.3% in Riverside County, and 20.5% in San Diego County.
❱ The growth in sales was even more impressive given significantly rising financing costs in the second quarter.
Southern California Home Prices
❱ Compared to the second quarter of 2022, home sale prices were 5.5% lower. However, they were 2.1% higher than in the first quarter of 2023.
❱ Affordability continues to be a significant constraint in the region. With median list prices rising 21% in San Diego County and 20% in Los Angeles County compared to the first quarter, it appears that sellers’ confidence levels continue to rise, which will further impact housing affordability.
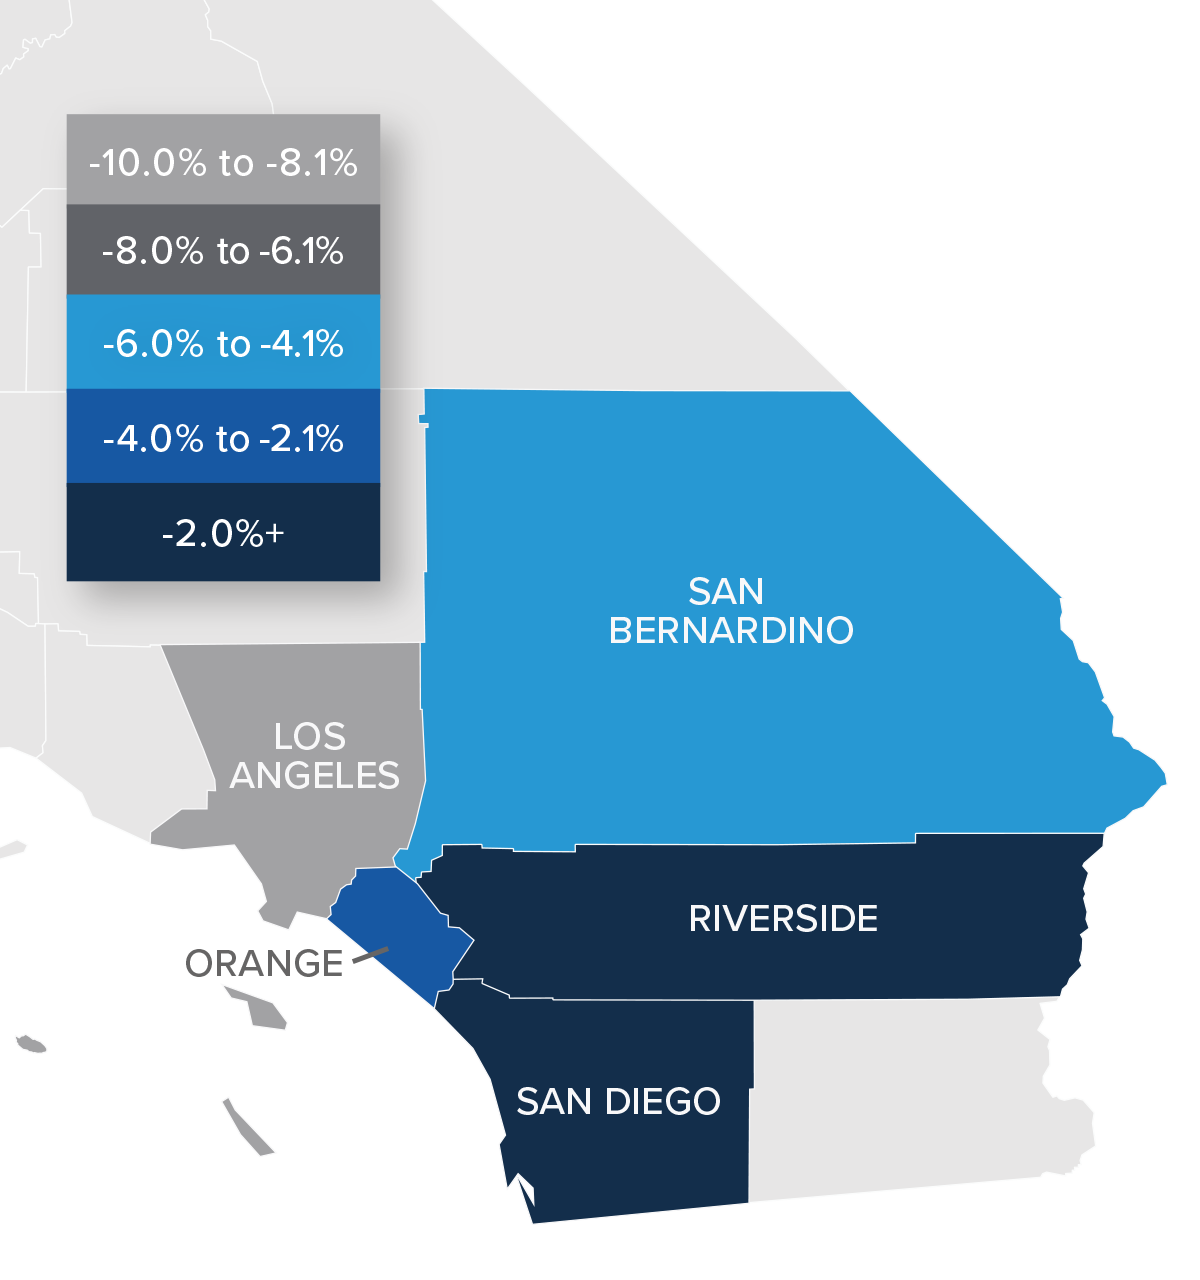
❱ Year over year, prices pulled back across the region, with a significant drop in Los Angeles County. Compared to the first quarter of 2023, Los Angeles prices fell 4.1%. Closed sale prices rose in the rest of the market areas.
❱ The region has demonstrated significantly more resilience to higher financing costs than expected. As we move through the balance of 2023, I expect prices to rise further, but at a very modest pace.
Mortgage Rates
Although they were less erratic than the first quarter, mortgage rates unfortunately trended higher and ended the quarter above 7%. This was due to the short debt ceiling impasse, as well as several economic datasets that suggested the U.S. economy was not slowing at the speed required by the Federal Reserve.
While the June employment report showed fewer jobs created than earlier in the year, as well as downward revisions to prior gains, inflation has not sufficiently slowed. Until it does, rates cannot start to trend consistently lower. With the economy not slowing as fast as expected, I have adjusted my forecast: Rates will hold at current levels in third quarter and then start to trend lower through the fall. Although there are sure to be occasional spikes, my model now shows the 30-year fixed rate breaking below 6% next spring.
Southern California Days on Market
❱ In the second quarter of 2023, the average time it took to sell a home in the region was 32 days, which was 16 more than in the second quarter of 2022 but 13 fewer days than in the first quarter of 2023.
❱ Compared to the first quarter of 2023, market time fell in all counties covered by this report.
❱ Homes in San Diego County continue to sell at a faster rate than other markets in the region, but all counties saw market time increase from a year ago.
❱ Home buyers appear to be resigned to the fact that supply levels are unlikely to improve any time soon and believe that prices are not going to fall further. This is leading them to pursue buying a home even if mortgage rates remain very high, with the hope they will be able to refinance when rates eventually fall.
Conclusions
This speedometer reflects the state of the region’s real estate market using housing inventory, price gains, home sales, interest rates, and larger economic factors.
Home prices have stabilized and are starting to trend higher again. This is counterintuitive, especially given that mortgage rates are higher than the market has seen in over 15 years. However, the reason for this is straightforward: a lack of supply is bolstering home values. It will only be when supply levels rise to match demand that we will start to move toward a more balanced market. The issue, though, is that 85.7% of California homeowners with a mortgage have an average interest rate below 5%, and 30% have rates at or below 3%. I find it highly unlikely that homeowners will give up their current rate unless they absolutely have to, which is holding back supply.
Homeowners who do decide to sell are aware of this and are increasingly confident in their ability to sell their homes regardless of mortgage rates. Given these factors, I have moved the needle into the seller’s sector of the speedometer.
About Matthew Gardner

As Chief Economist for Windermere Real Estate, Matthew Gardner is responsible for analyzing and interpreting economic data and its impact on the real estate market on both a local and national level. Matthew has over 30 years of professional experience both in the U.S. and U.K.
In addition to his day-to-day responsibilities, Matthew sits on the Washington State Governors Council of Economic Advisors; chairs the Board of Trustees at the Washington Center for Real Estate Research at the University of Washington; and is an Advisory Board Member at the Runstad Center for Real Estate Studies at the University of Washington where he also lectures in real estate economics.
Q1 2023 Southern California Real Estate Market Update

The following analysis of select counties of the Southern California real estate market is provided by Windermere Real Estate Chief Economist Matthew Gardner. We hope that this information may assist you with making better-informed real estate decisions. For further information about the housing market in your area, please don’t hesitate to contact your Windermere Real Estate agent.
Regional Economic Overview
Following annual revisions to the data, the Southern California market added only 194,000 jobs in 2022, which was far fewer than the over 676,000 added in 2021. The first two months of data for 2023 showed a net loss of 14,800 jobs. Because the data is not adjusted for seasonality, I am not overly concerned by this decline, but I will be watching as we move through the spring to see if declining job growth is becoming pervasive. Total employment in the counties covered by this report is still 266,400 jobs shy of the pre-pandemic peak. Los Angeles County continues to have the largest shortfall of jobs (-260,000), followed by Orange County (-37,100). Job levels in San Diego County match their pre-pandemic peak, while employment levels in the Riverside and San Bernardino markets are each higher by more than 15,000 jobs. The region’s unemployment rate in February was 4.6%, down from 5% at the same time in 2022. The lowest jobless rates were in Orange County (3.4%) and San Diego County (3.7%). The highest was in Los Angeles County, where 5.3% of the workforce was without a job.
Southern California Home Sales
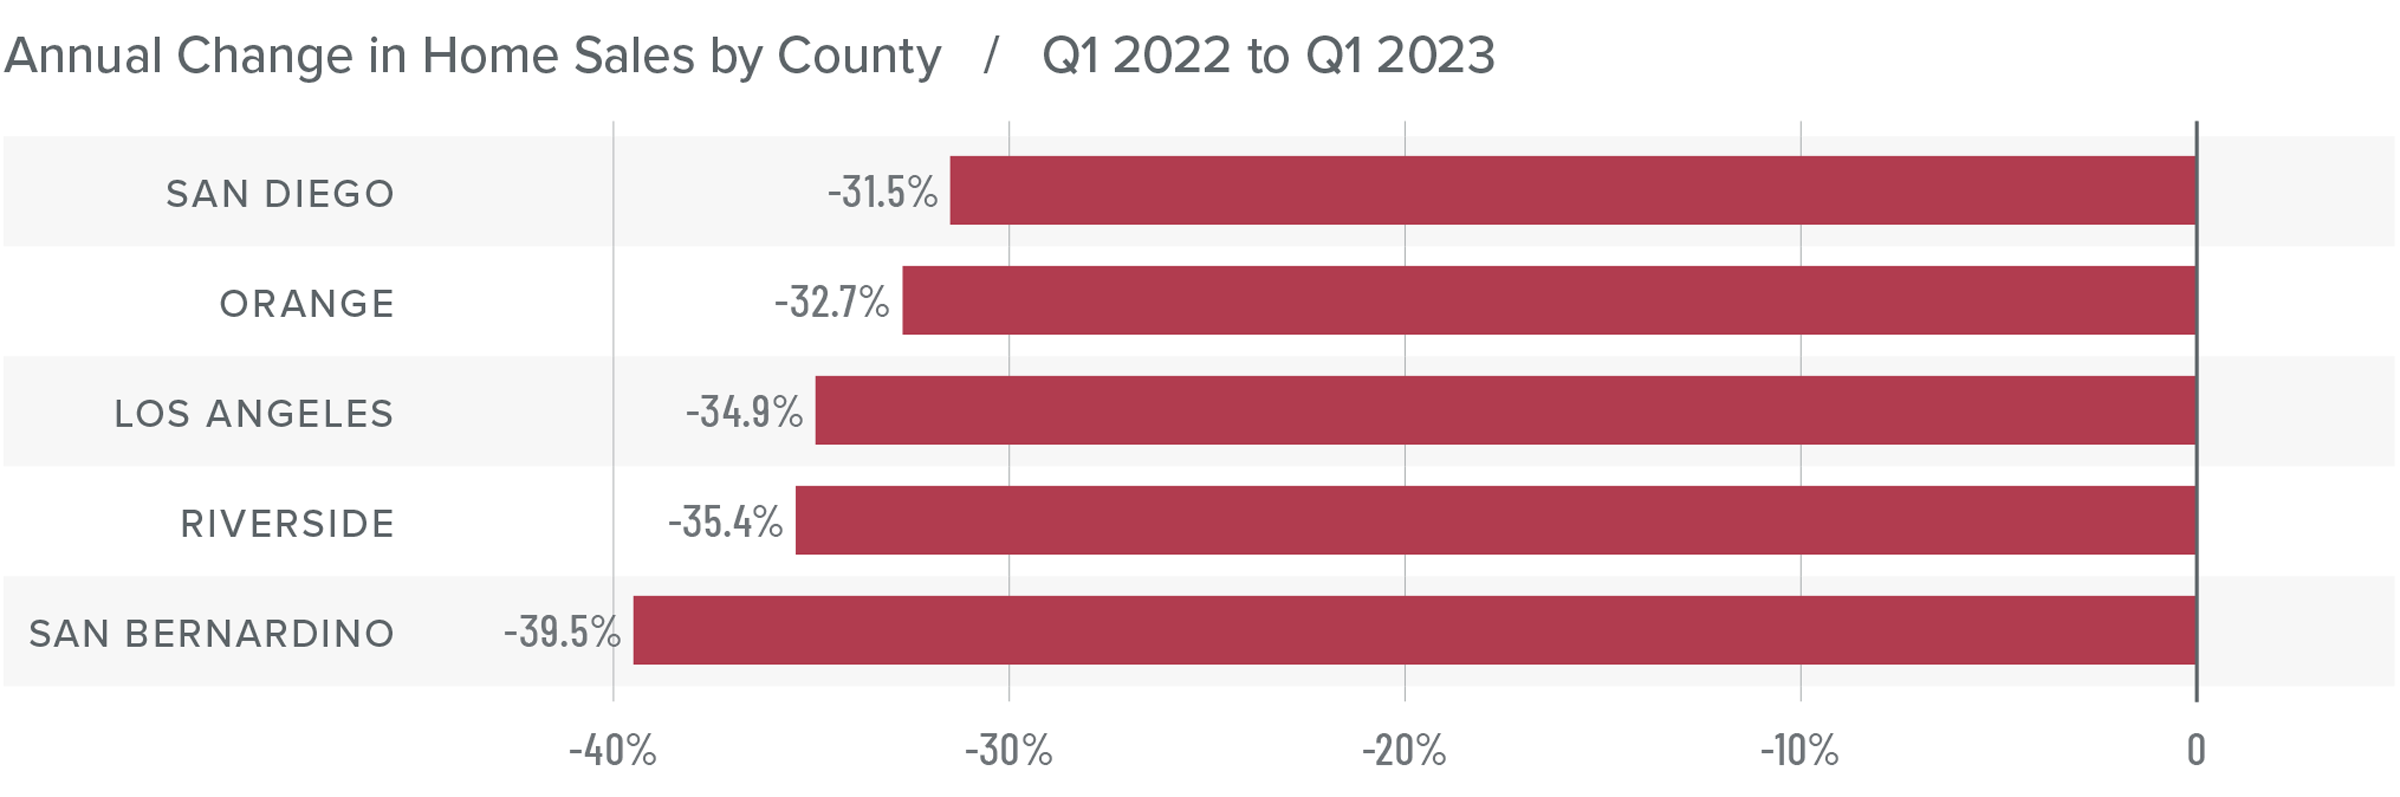
❱ In the first quarter of 2023, 27,577 homes sold, which is down 34.8% from the first quarter of 2022 and is 5.2% lower than in the final quarter of 2022.
❱ Pending home sales, which are an indicator of future closings, were 25.4% higher than in the fourth quarter, suggesting that sales activity in the second quarter of this year may pick up.
❱ On a percentage basis, sales fell the most in San Bernardino County, but all markets pulled back significantly. Compared to the fourth quarter, sales were higher in Riverside County (+7.1%) but fell across the balance of the market.
❱ The drop in sales can mainly be attributed to a lack of inventory: the number of homes for sale was down 27.6% from the final quarter of 2022. Additionally, mortgage rates rose by more than a full percentage point in February, which likely also impacted sales.
Southern California Home Prices
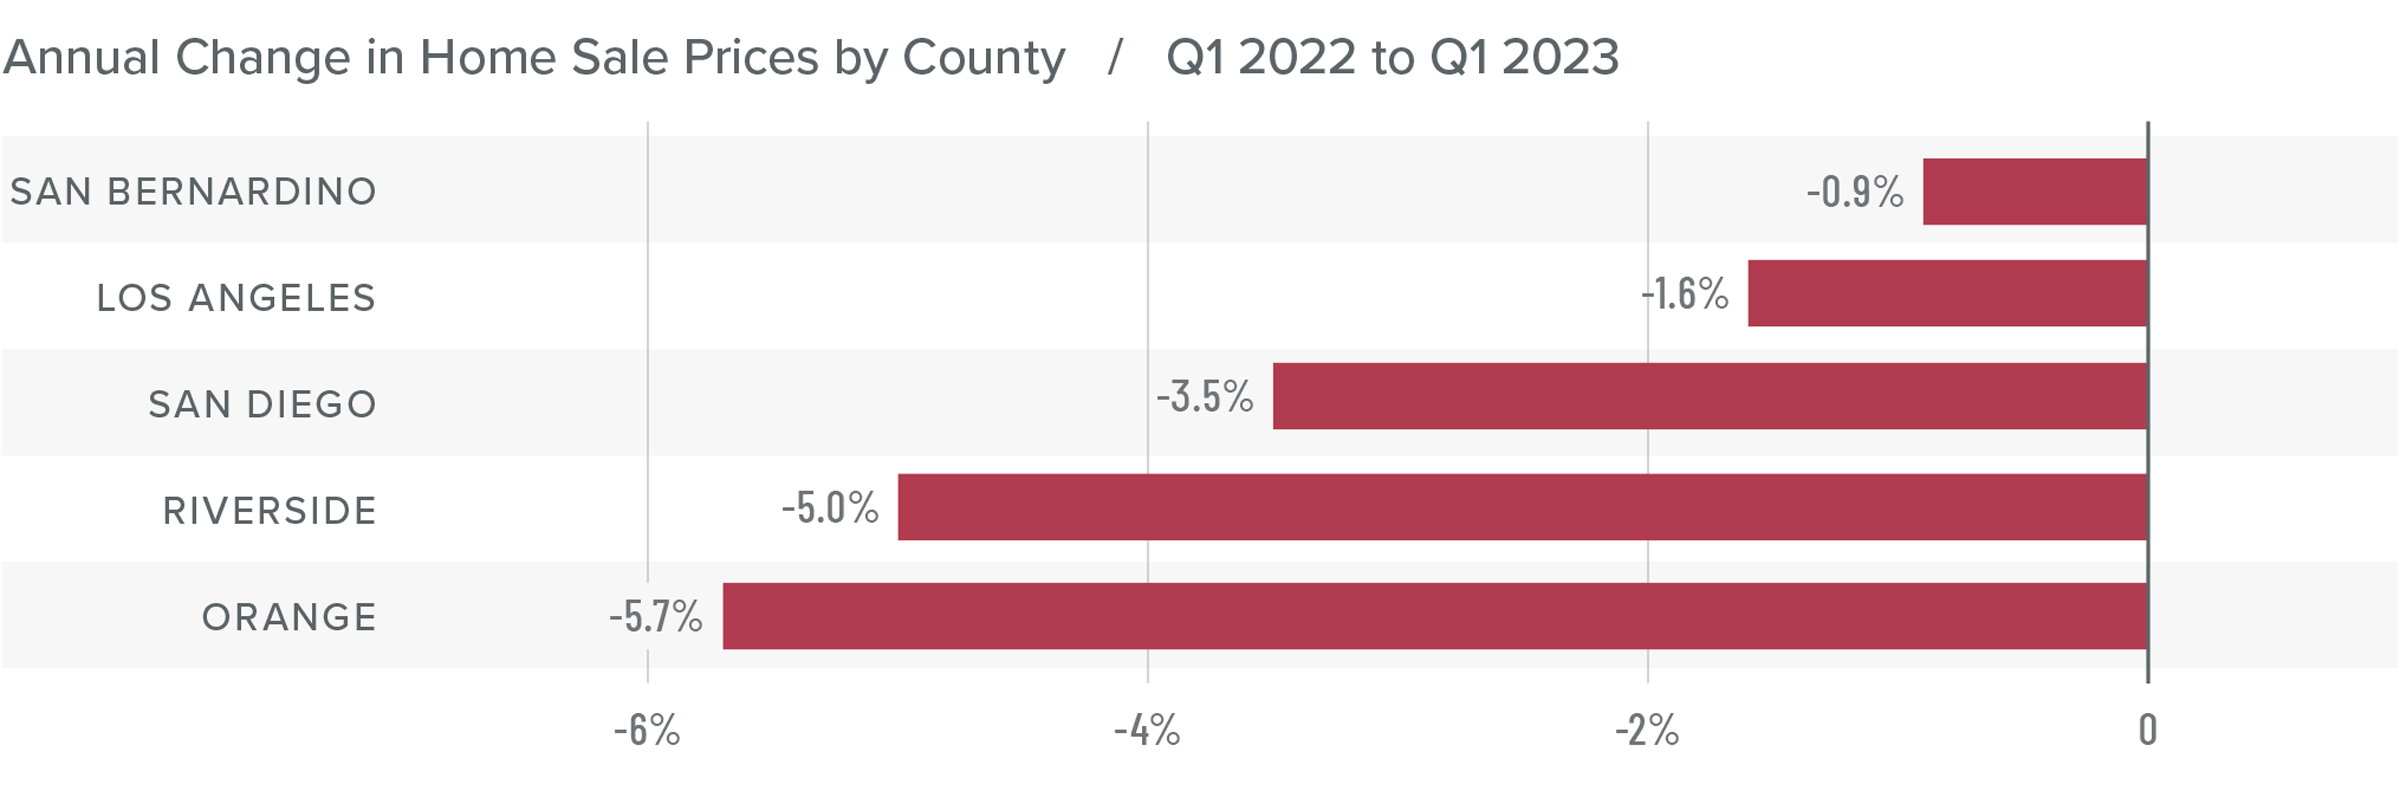
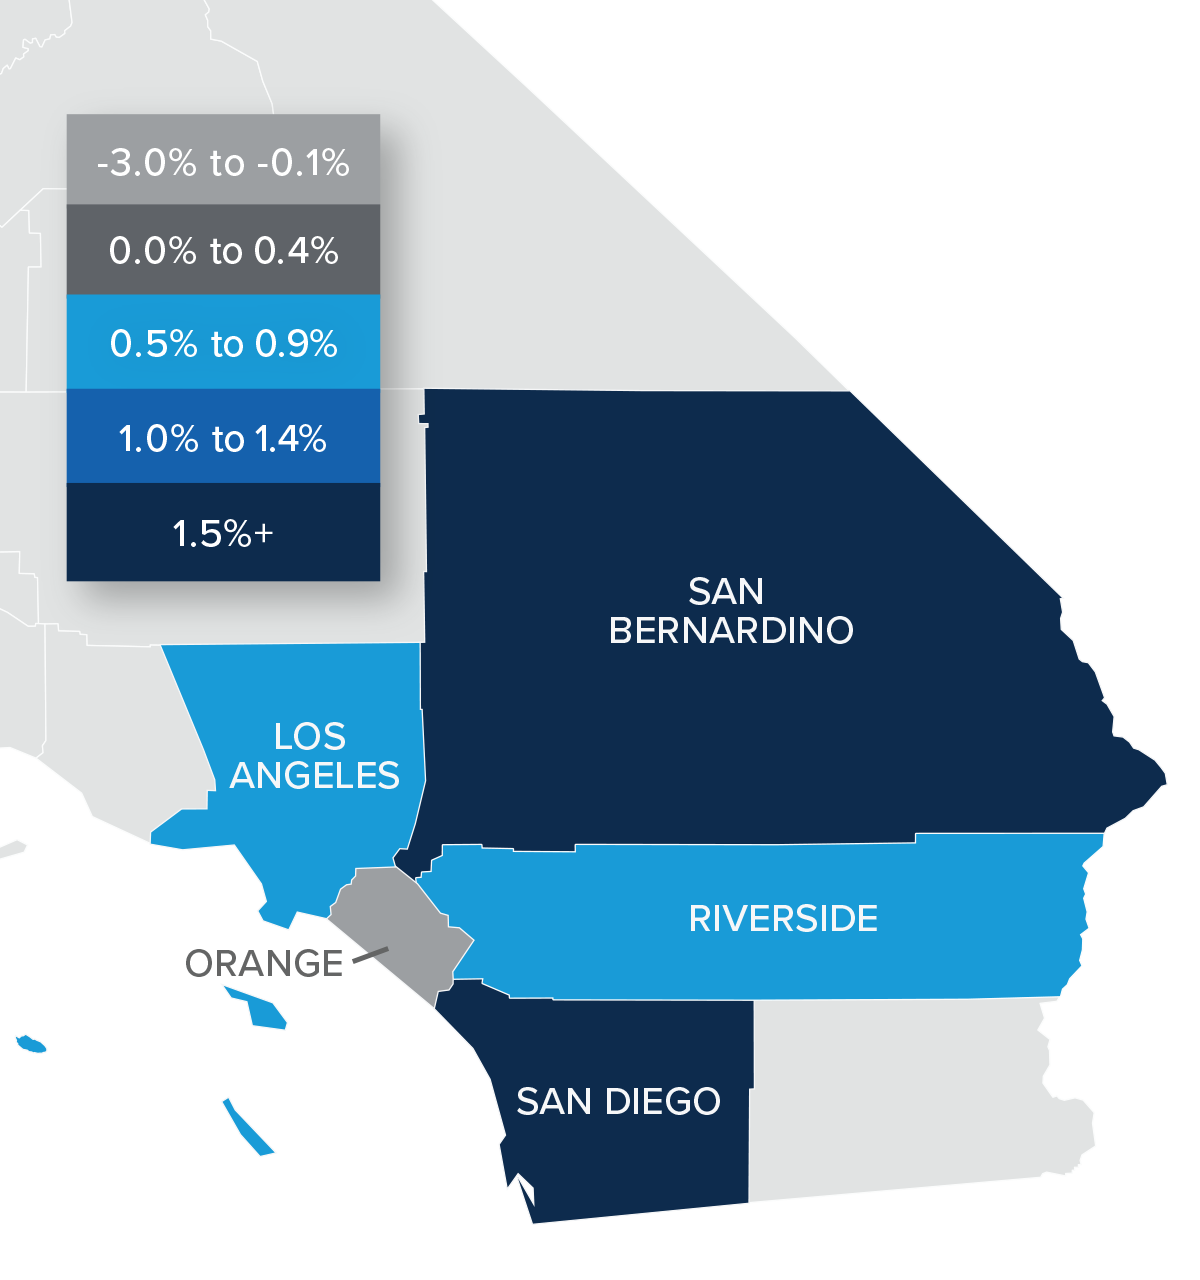
❱ Compared to the same period last year, home prices fell 2.5%. However, prices were 1.9% higher than in the fourth quarter of 2022.
❱ Affordability remains a significant issue, which has been exacerbated by elevated financing costs. That said, median listing prices in the quarter are up in every market other than San Bernardino, which suggests that home sellers may be starting to think that the worst of the price correction is behind them.
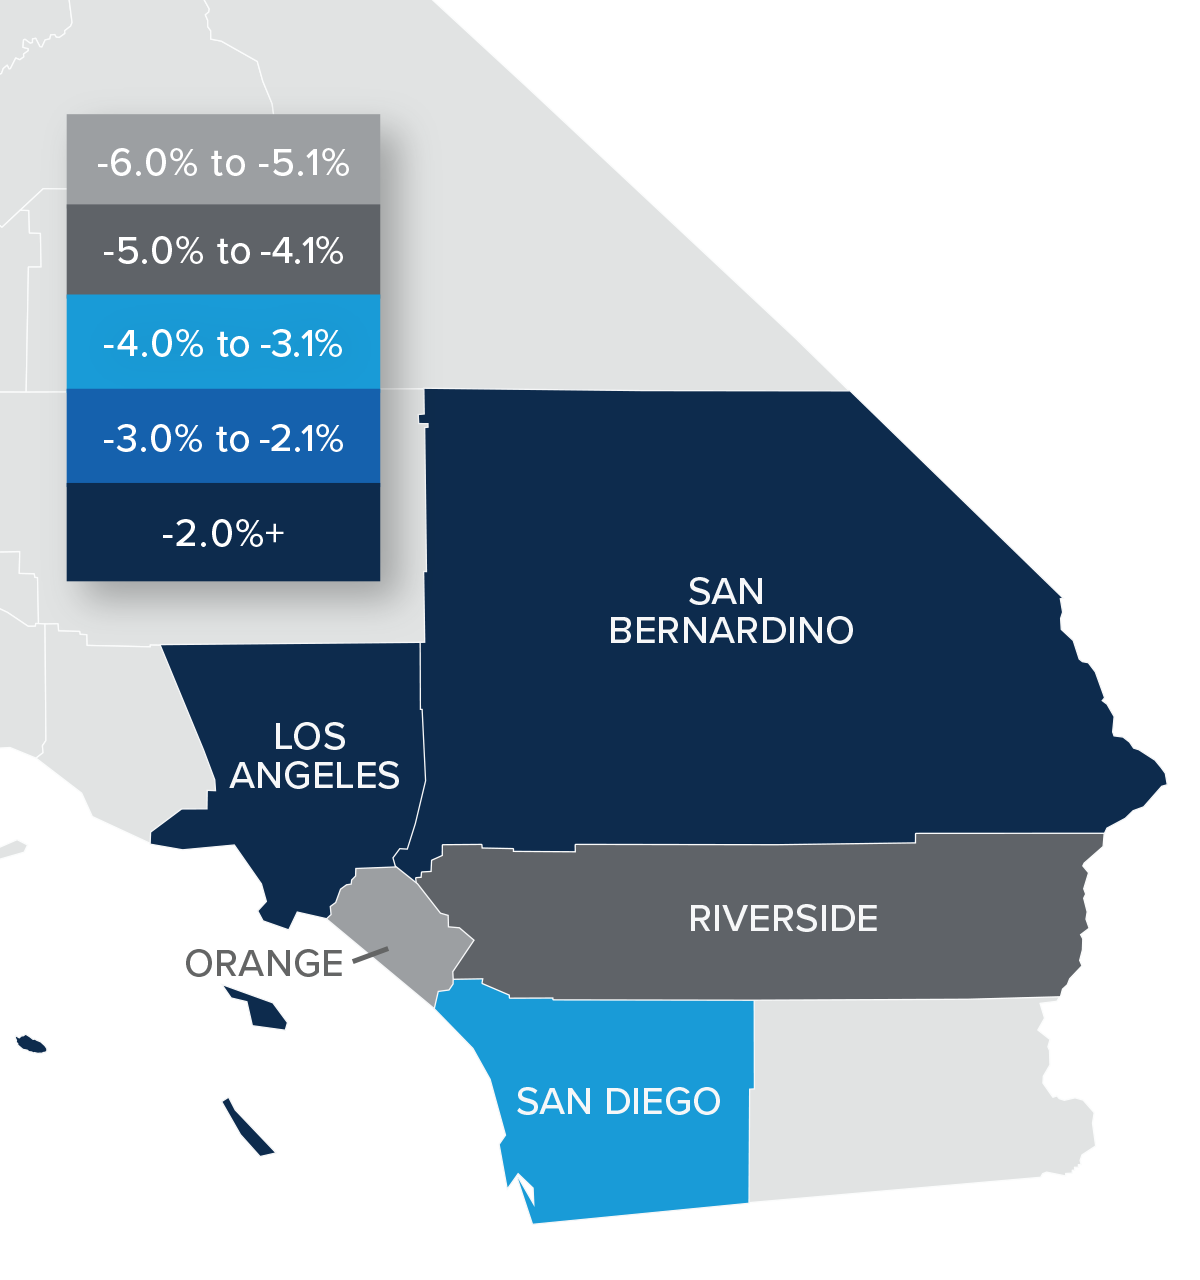
❱ Year over year, prices fell across the region but rose in all markets compared to the final quarter of 2022. Of note is that price growth was very solid in San Diego, Riverside, and Orange counties.
❱ While I expect mortgage rates to start stabilizing as we move toward summer, I think there will be some additional downward pressure on home prices. That said, things should start to turn around again in the second half of the year with a return to rising home prices.
Mortgage Rates
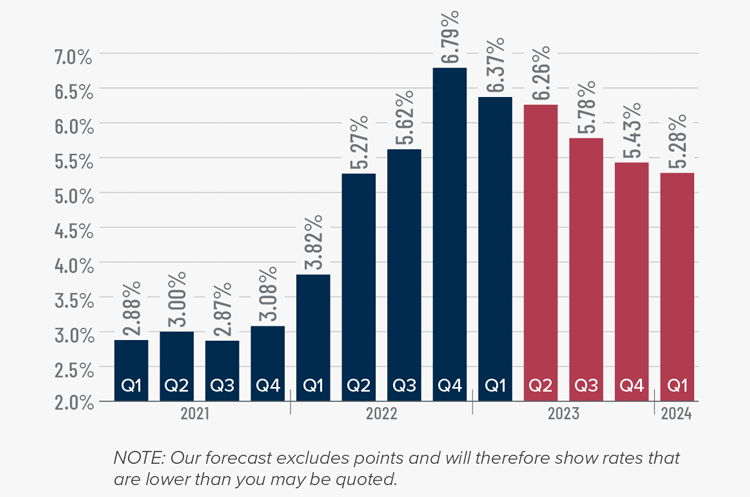
Rates in the first quarter of 2023 were far less volatile than last year, even with the brief but significant impact of early March’s banking crisis. It appears that buyers are jumping in when rates dip, which was the case in mid-January and again in early February.
Even with the March Consumer Price Index report showing inflation slowing, I still expect the Federal Reserve to raise short-term rates one more time following their May meeting before pausing rate increases. This should be the catalyst that allows mortgage rates to start trending lower at a more consistent pace than we have seen so far this year. My current forecast is that rates will continue to move lower with occasional spikes, and that they will hold below 6% in the second half of this year.
Southern California Days on Market
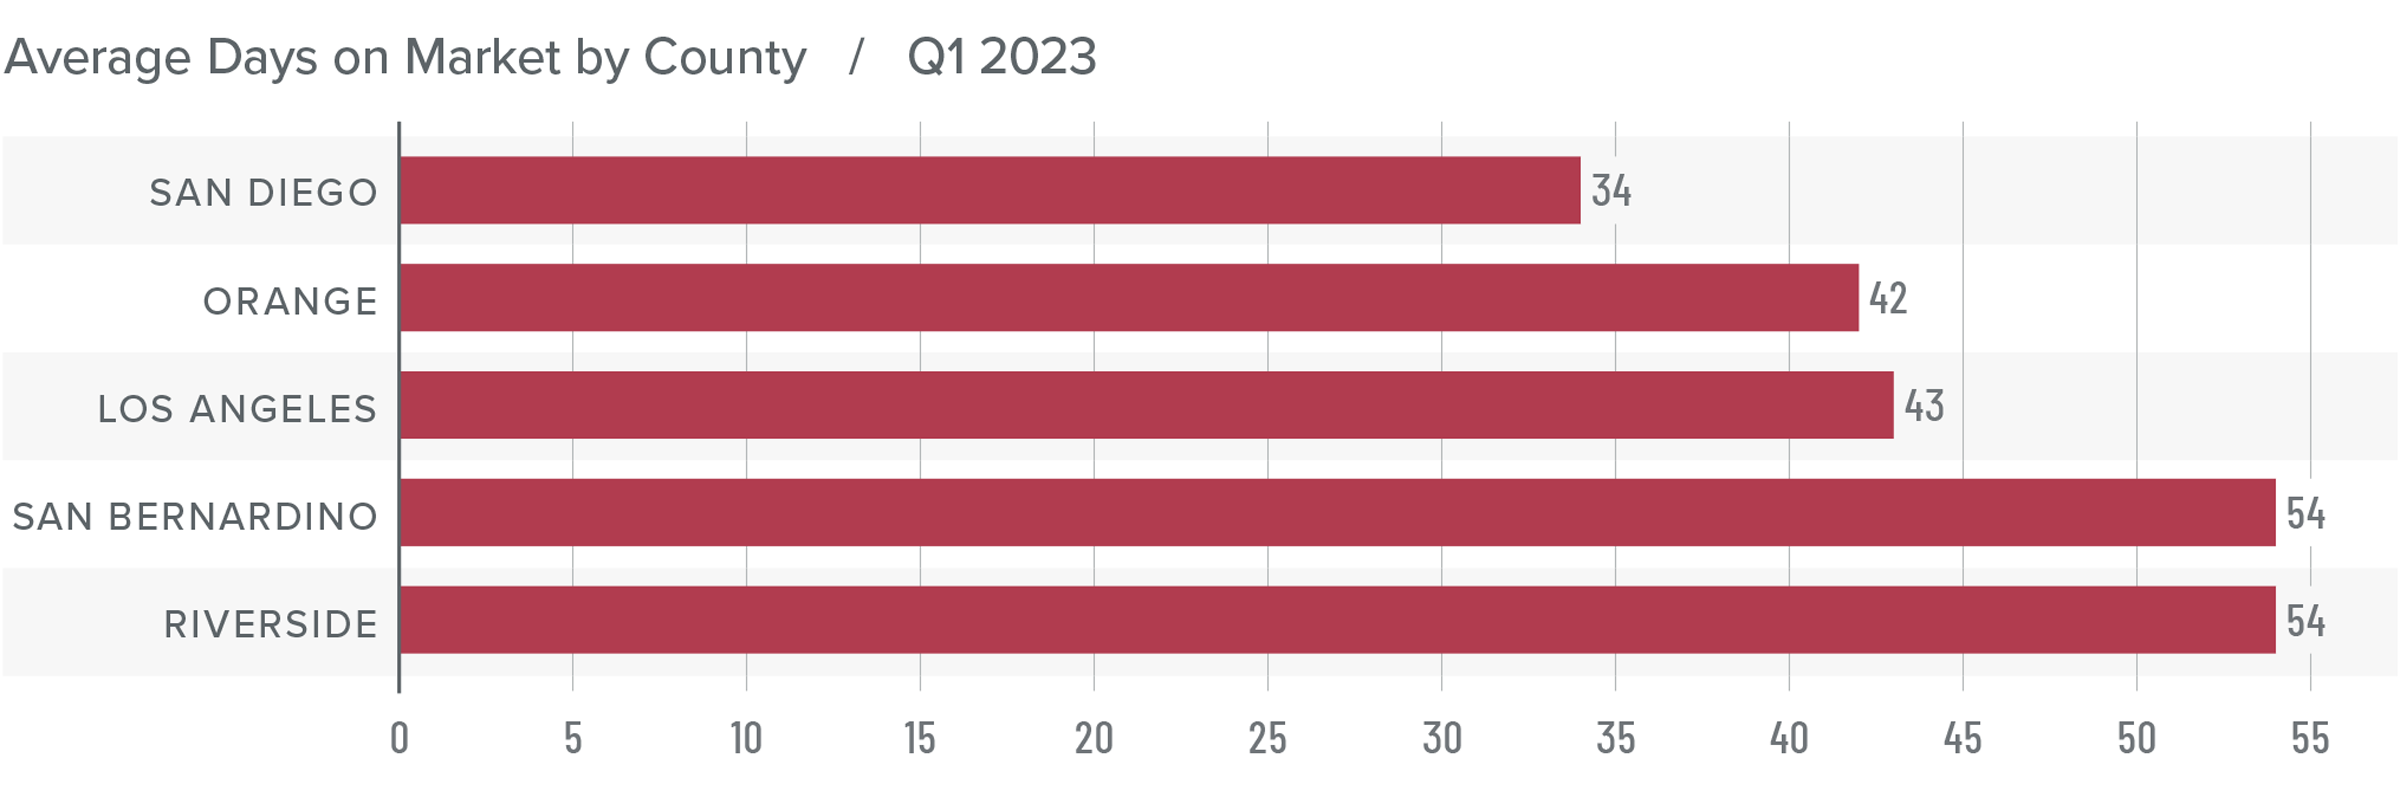
❱ In the first quarter of 2023, the average time it took to sell a home in the region was 45 days, which is 24 more than in the first quarter of 2022 and 9 more days than in the fourth quarter of last year.
❱ Market time also rose in all counties covered by this report compared to the fourth quarter of 2022.
❱ Homes in San Diego County continue to sell at a faster rate than other markets in the region, but all counties saw market time increase from a year ago.
❱ Higher mortgage rates and lower affordability still have some buyers sidelined. I expect to see increased activity once buyers become confident that mortgage rates have stabilized and that housing values have found a bottom.
Conclusions
This speedometer reflects the state of the region’s real estate market using housing inventory, price gains, home sales, interest rates, and larger economic factors.
The Southern California housing market is still trying to find its footing. Mortgage rates are not only still at elevated levels, but they are also moving erratically depending on events in the broader economy (e.g. inflation, bank failures, etc.) Although sellers seem to be more confident, buyers are remaining cautious, which suggests that the market recovery will take more time.
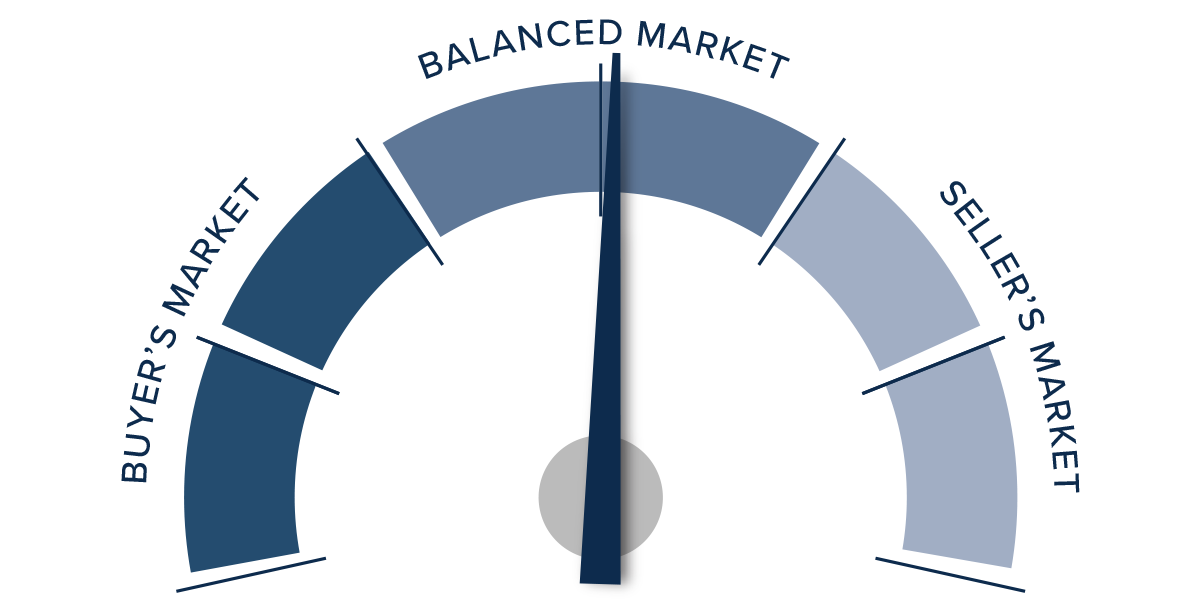
Lower inventory levels, higher pending sales, higher listing and sale prices, and an improving absorption rate all favor sellers. However, the market is not completely in their favor. As such, I have left the needle in the “balanced” section of the speedometer. I have tilted it slightly toward home sellers though as there continues to be strong demand for appropriately priced, well-located, and well-appointed homes.
About Matthew Gardner
As Chief Economist for Windermere Real Estate, Matthew Gardner is responsible for analyzing and interpreting economic data and its impact on the real estate market on both a local and national level. Matthew has over 30 years of professional experience both in the U.S. and U.K.
In addition to his day-to-day responsibilities, Matthew sits on the Washington State Governors Council of Economic Advisors; chairs the Board of Trustees at the Washington Center for Real Estate Research at the University of Washington; and is an Advisory Board Member at the Runstad Center for Real Estate Studies at the University of Washington where he also lectures in real estate economics.
Q4 2022 Southern California Real Estate Market Update

The following analysis of select counties of the Southern California real estate market is provided by Windermere Real Estate Chief Economist Matthew Gardner. We hope that this information may assist you with making better-informed real estate decisions. For further information about the housing market in your area, please don’t hesitate to contact your Windermere Real Estate agent.
Regional Economic Overview
Employment growth in Southern California continues to slow, with only 33,400 jobs added over the past three months. Annual growth also slowed: only 141,100 new jobs were added, which is down from 347,700 added between September 2021 and September 2022. Total employment in the counties covered by this report is still 305,300 shy of the region’s pre-pandemic peak. Los Angeles County still has the largest shortfall (-310,000), followed by Orange County (-36,800) and San Diego County (-19,500). Employment levels in the Riverside and San Bernardino markets remain well above pre-pandemic levels. The region’s unemployment rate in November was 4%, down from 5.4% a year ago. The lowest rates were in Orange County (3%) and San Diego County (3.3%).
Southern California Home Sales
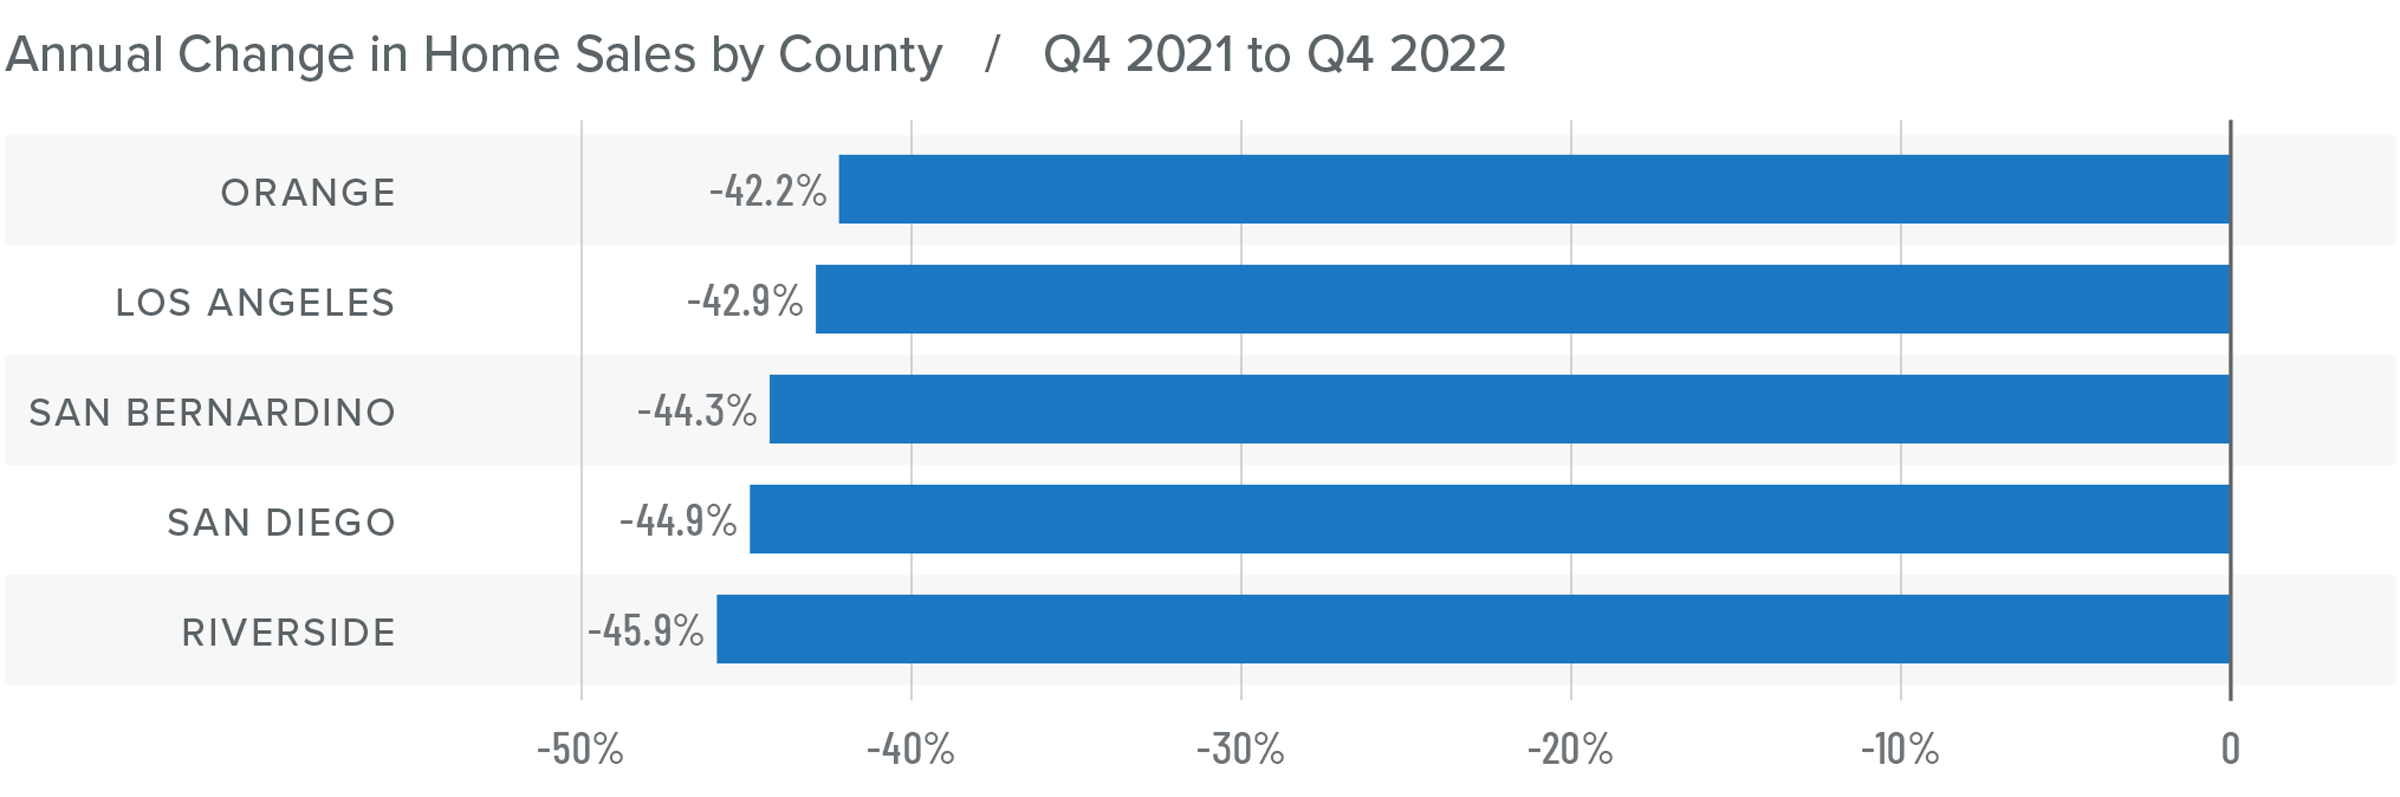
❱ In the final quarter of 2022, 28,953 homes sold. This is 43.9% lower than the same period the year prior and down 24.5% compared to the third quarter of 2022.
❱ Pending home sales, which are an indicator of future closings, were down 30% from the third quarter, suggesting that sales activity in the first quarter of this year may also be down.
❱ On a percentage basis, sales fell the most in Riverside County, but all markets pulled back significantly. Compared to the third quarter, sales were down 24.5%, or 9,400 units.
❱ The lower number of sales can be attributed to more listings in the market, which were up 83.5% year over year, and higher mortgage rates, which make homes less affordable.
Southern California Home Prices
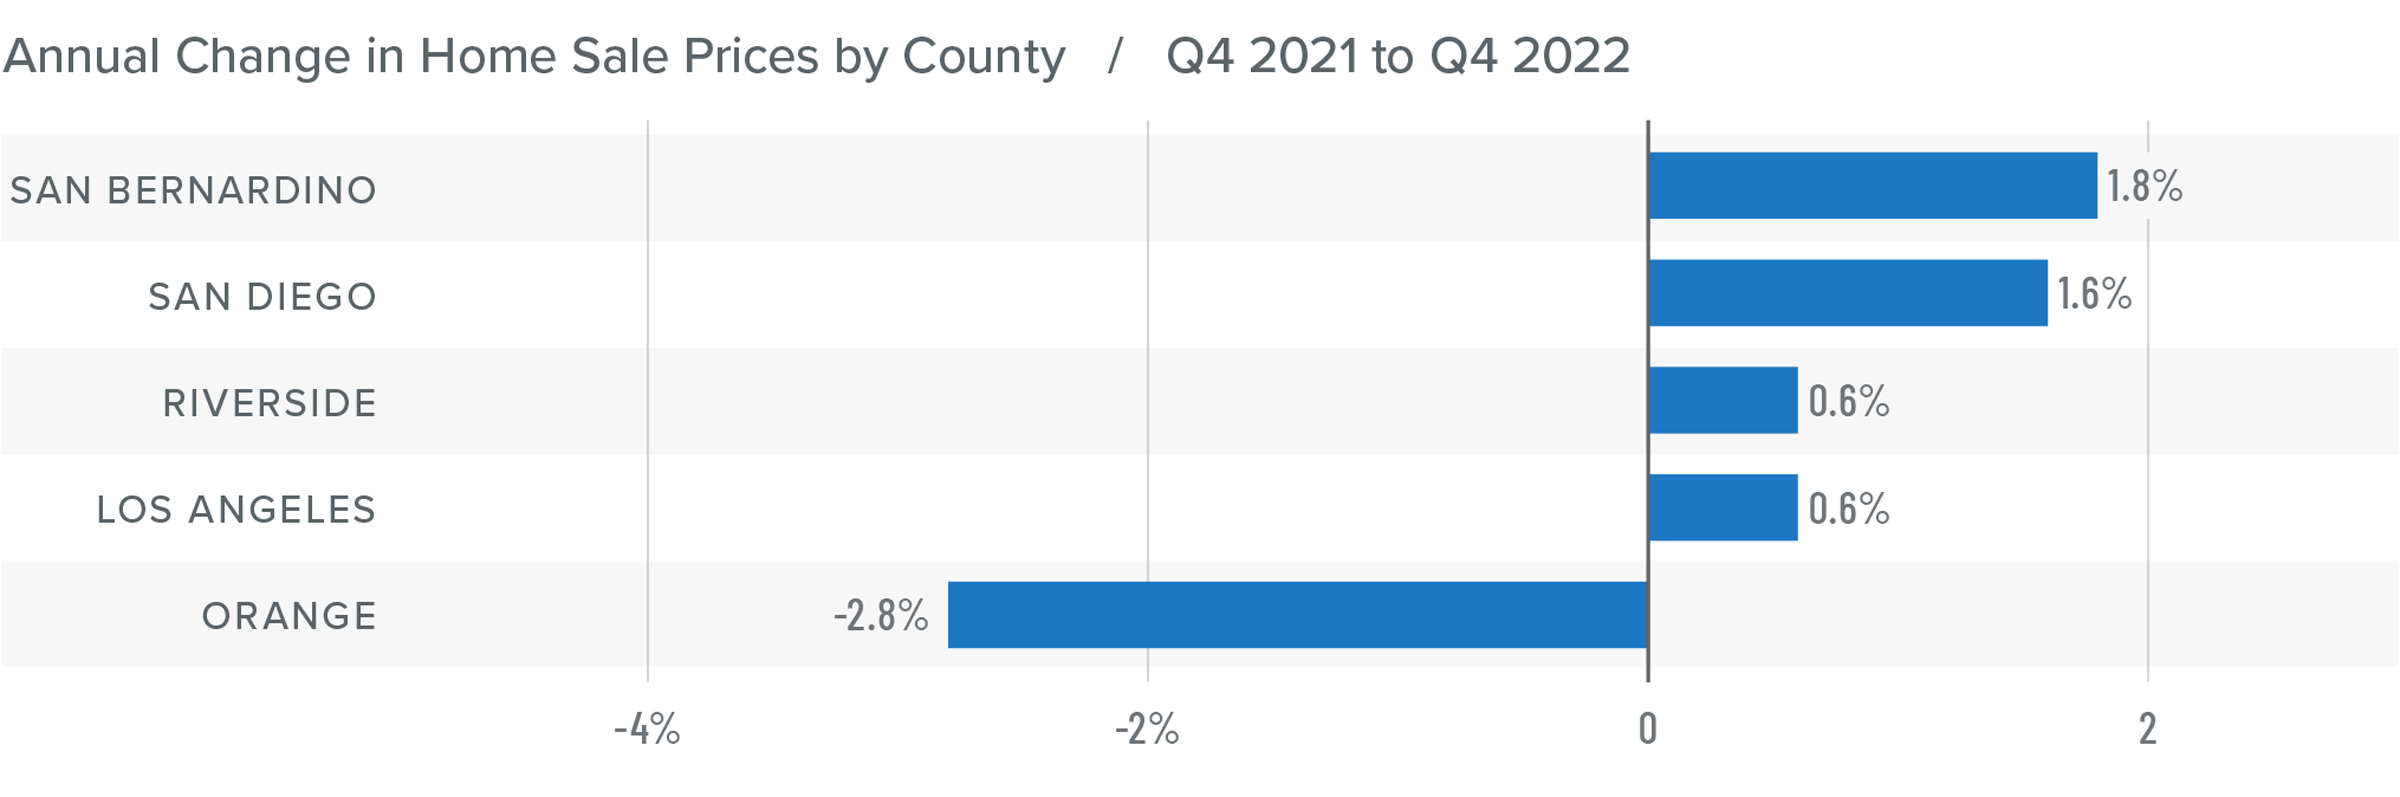
❱ Fourth quarter home sale prices were .7% higher than the same period the prior year but were 2.5% lower than in the third quarter of 2022.
❱ Mortgage rates, which peaked in October, have impacted both the number of sales and prices. Median listing prices were down 4.9%, which indicates that sellers have been adjusting their expectations, but I believe they will fall further before stability in the market is restored.
❱ The region had very modest price growth in all markets other than Orange County, where prices fell 2.8%. Compared to the third quarter of 2022, prices were lower across all markets other than Los Angeles County, where they rose .2%.
❱ Mortgage rates have started to pull back. If this continues, I am hopeful that the second half of 2023 will be more active, resulting in rising sales and home prices.
Mortgage Rates
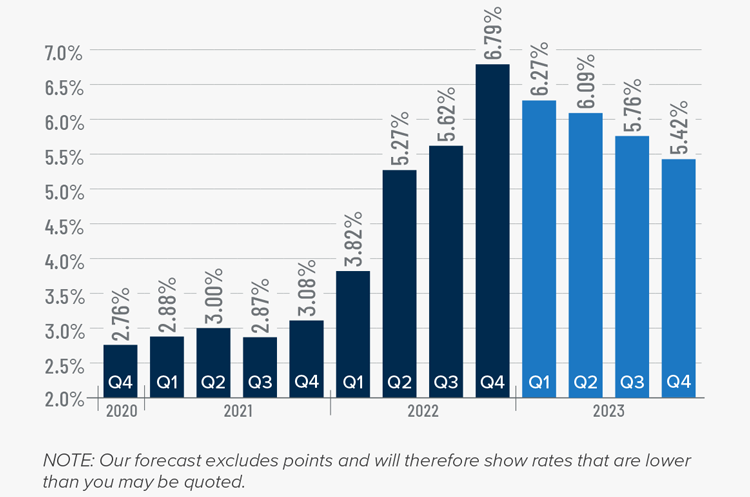
Rates rose dramatically in 2022, but I believe that they have now peaked. Mortgage rates are primarily based on the prices and yields of bonds, and while bonds take cues from several places, they are always impacted by inflation and the economy at large. If inflation continues to fall, as I expect it will, rates will continue to drop.
My current forecast is that mortgage rates will trend lower as we move through the year. While this may be good news for home buyers, rates will still be higher than they have become accustomed to. Even as the cost of borrowing falls, home prices in expensive markets will probably fall a bit more to compensate for rates that will likely hold above 6% until early summer.
Southern California Days on Market
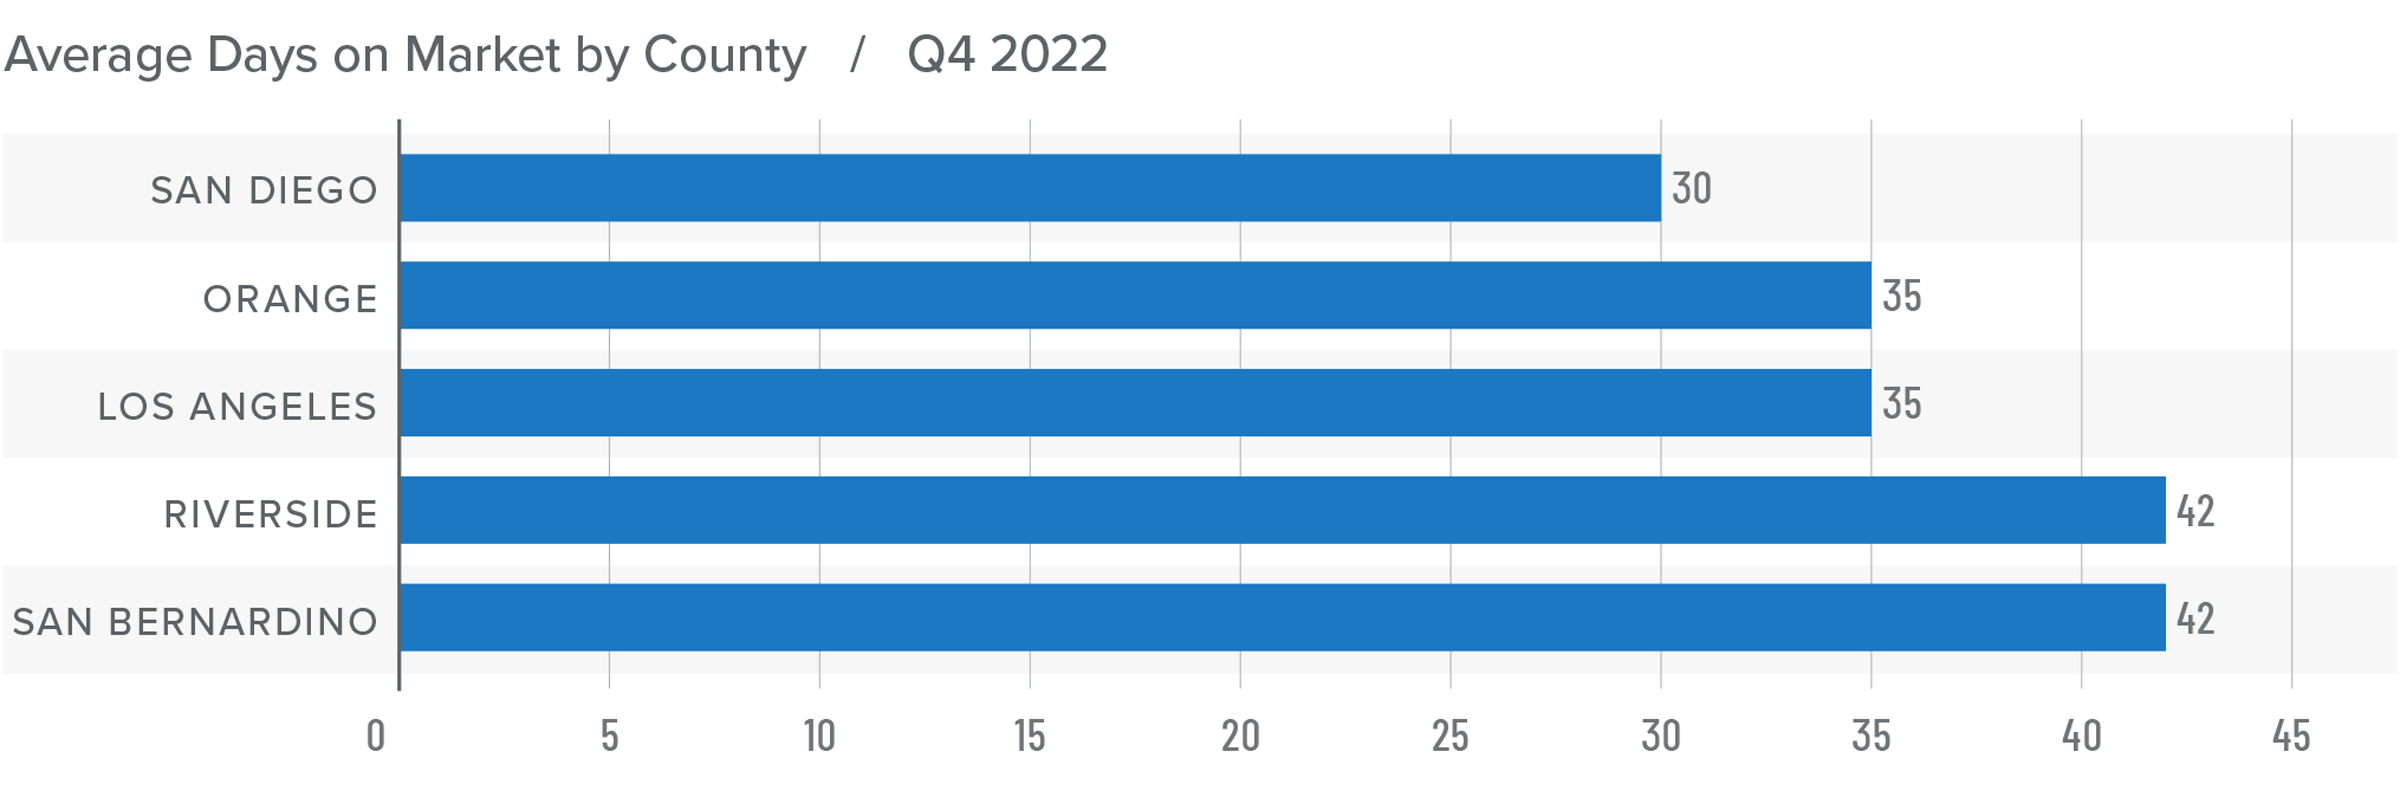
❱ In the final quarter of 2022, the average time it took to sell a home in the region was 37 days, which was 15 more than the same period the year prior and 11 more than in the third quarter of 2022.
❱ Compared to the third quarter of 2022, market time rose in all counties covered by this report.
❱ Homes in San Diego County continue to sell at a faster rate than other markets in the region, but market time increased in all counties year over year.
❱ More choice and higher mortgage rates appear to be sidelining some buyers. Whether they resume their search for a home in the spring may depend on the direction of mortgage rates and whether prices start to stabilize.
Conclusions
This speedometer reflects the state of the region’s real estate market using housing inventory, price gains, home sales, interest rates, and larger economic factors.
Job growth has slowed, which may be at least partly attributable to businesses expecting to see the economy slow as we move through this year. The housing market is very susceptible to economic turbulence. This, combined with higher financing costs and softening prices, has caused a lull in the market.

There is no doubt that regional home values are resetting following the frenetic market during the pandemic when mortgage rates were artificially low. I expect prices to move modestly lower this spring before stabilizing and starting to rise again in the second half of the year. All things considered, I have moved the needle to a neutral position, favoring neither buyers nor sellers.
About Matthew Gardner
As Chief Economist for Windermere Real Estate, Matthew Gardner is responsible for analyzing and interpreting economic data and its impact on the real estate market on both a local and national level. Matthew has over 30 years of professional experience both in the U.S. and U.K.
In addition to his day-to-day responsibilities, Matthew sits on the Washington State Governors Council of Economic Advisors; chairs the Board of Trustees at the Washington Center for Real Estate Research at the University of Washington; and is an Advisory Board Member at the Runstad Center for Real Estate Studies at the University of Washington where he also lectures in real estate economics.
Q3 2022 Southern California Real Estate Market Update

The following analysis of select counties of the Southern California real estate market is provided by Windermere Real Estate Chief Economist Matthew Gardner. We hope that this information may assist you with making better-informed real estate decisions. For further information about the housing market in your area, please don’t hesitate to contact your Windermere Real Estate agent.
Regional Economic Overview
The employment market grew by 465,000 jobs over the past 12 months. However, the pace of job creation has been slowing and more recently the region has seen total employment levels drop. I am not overly concerned by this, as state data at the county level is not adjusted for seasonality, and I anticipate more jobs will be added as we move through the fall. Total employment in the counties covered by this report is now only 340,000 short of the pre-pandemic peak, having recovered 96.7% of the jobs that were lost. Los Angeles County still has the largest shortfall (-335,700), followed by Orange County (-41,500) and San Diego County (-15,400). Riverside and San Bernardino counties remain well above pre-pandemic employment levels. The region’s unemployment rate in August was 4.2%, down from 7.8% a year ago. The lowest rates were in Orange County (3%) and San Diego County (3.4%).
Southern California Home Sales
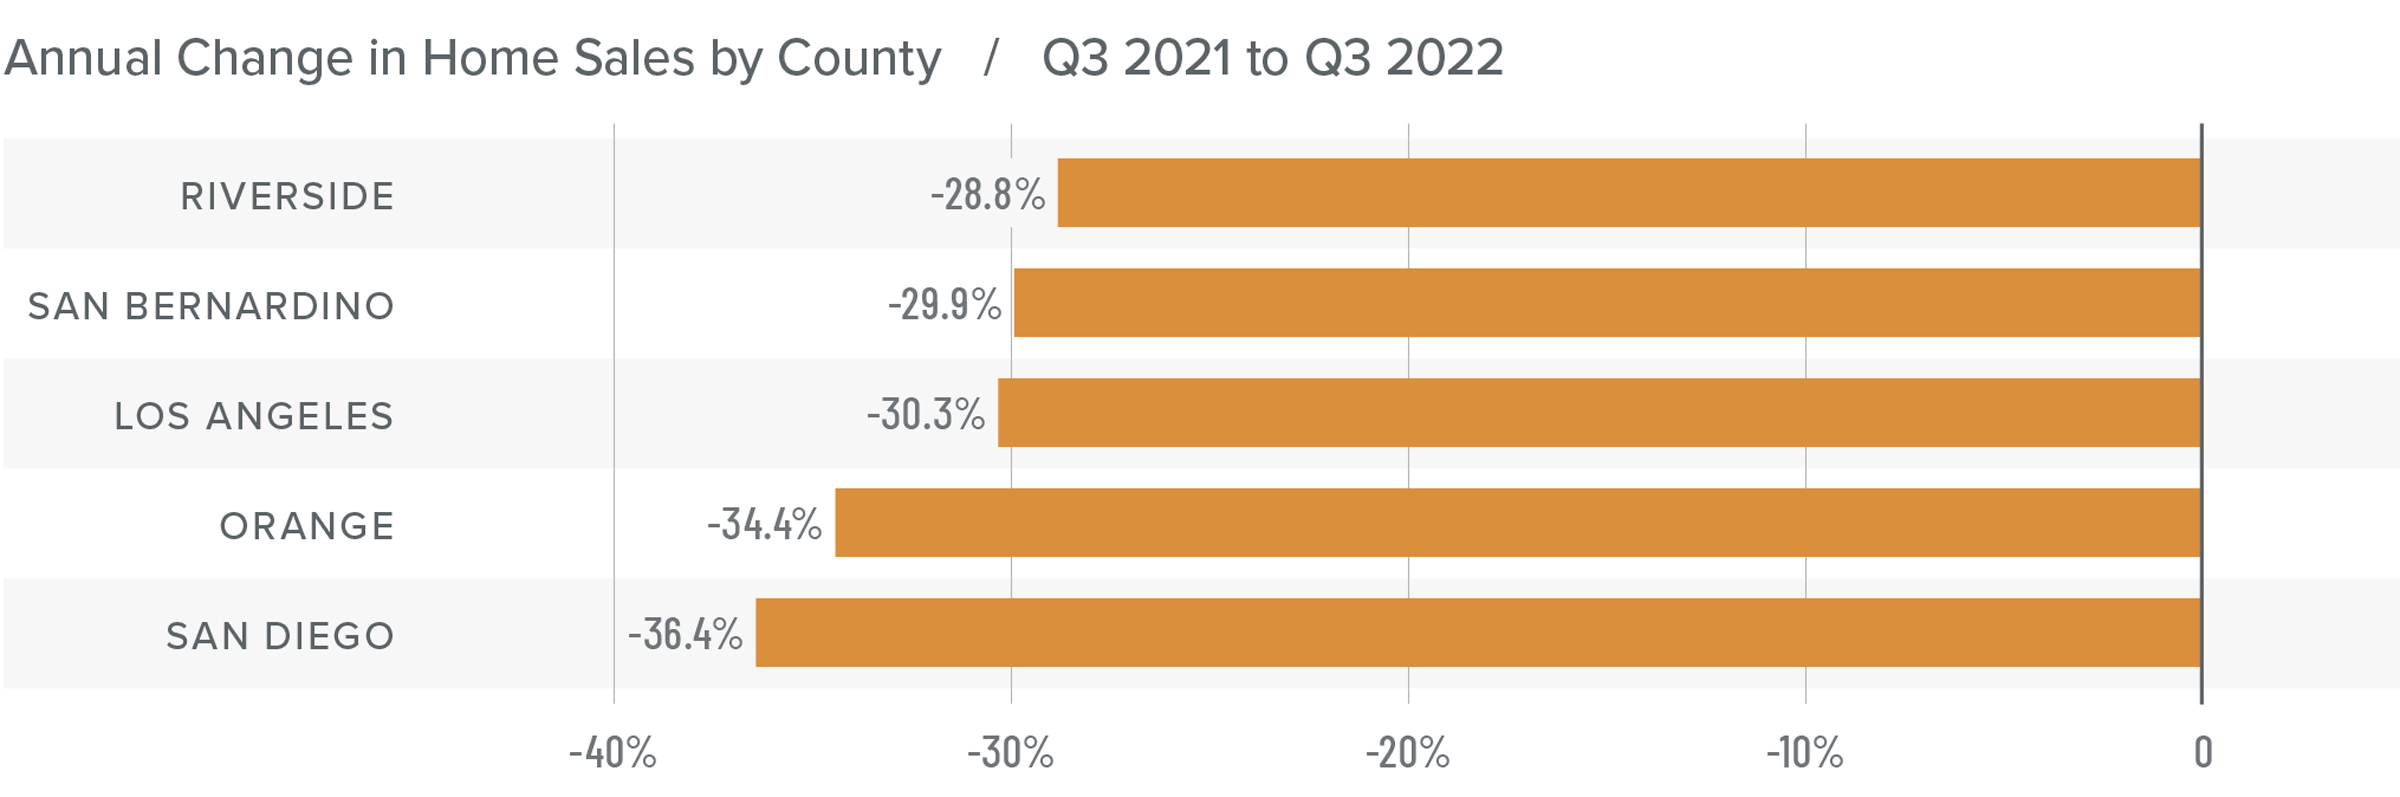
❱ In the third quarter, 38,356 homes sold, which is down 31.8% from a year ago and 19.4% less than the second quarter of the year.
❱ Pending home sales, which are an indicator of future closings, were down 16.2% from the second quarter, suggesting that closed sales in the final quarter of this year may disappoint.
❱ Sales fell the most in San Diego County, but all markets saw significant declines. Relative to the second quarter, transactions were lower across the board, with Riverside County experiencing the greatest decline (-24.1%).
❱ Listing activity rose an average of 41.6% compared to the second quarter. With more choice in the market and median list prices down 6.8% from the second quarter, it seems that many would-be buyers are sitting on the fence to see if prices will fall further.
Southern California Home Prices
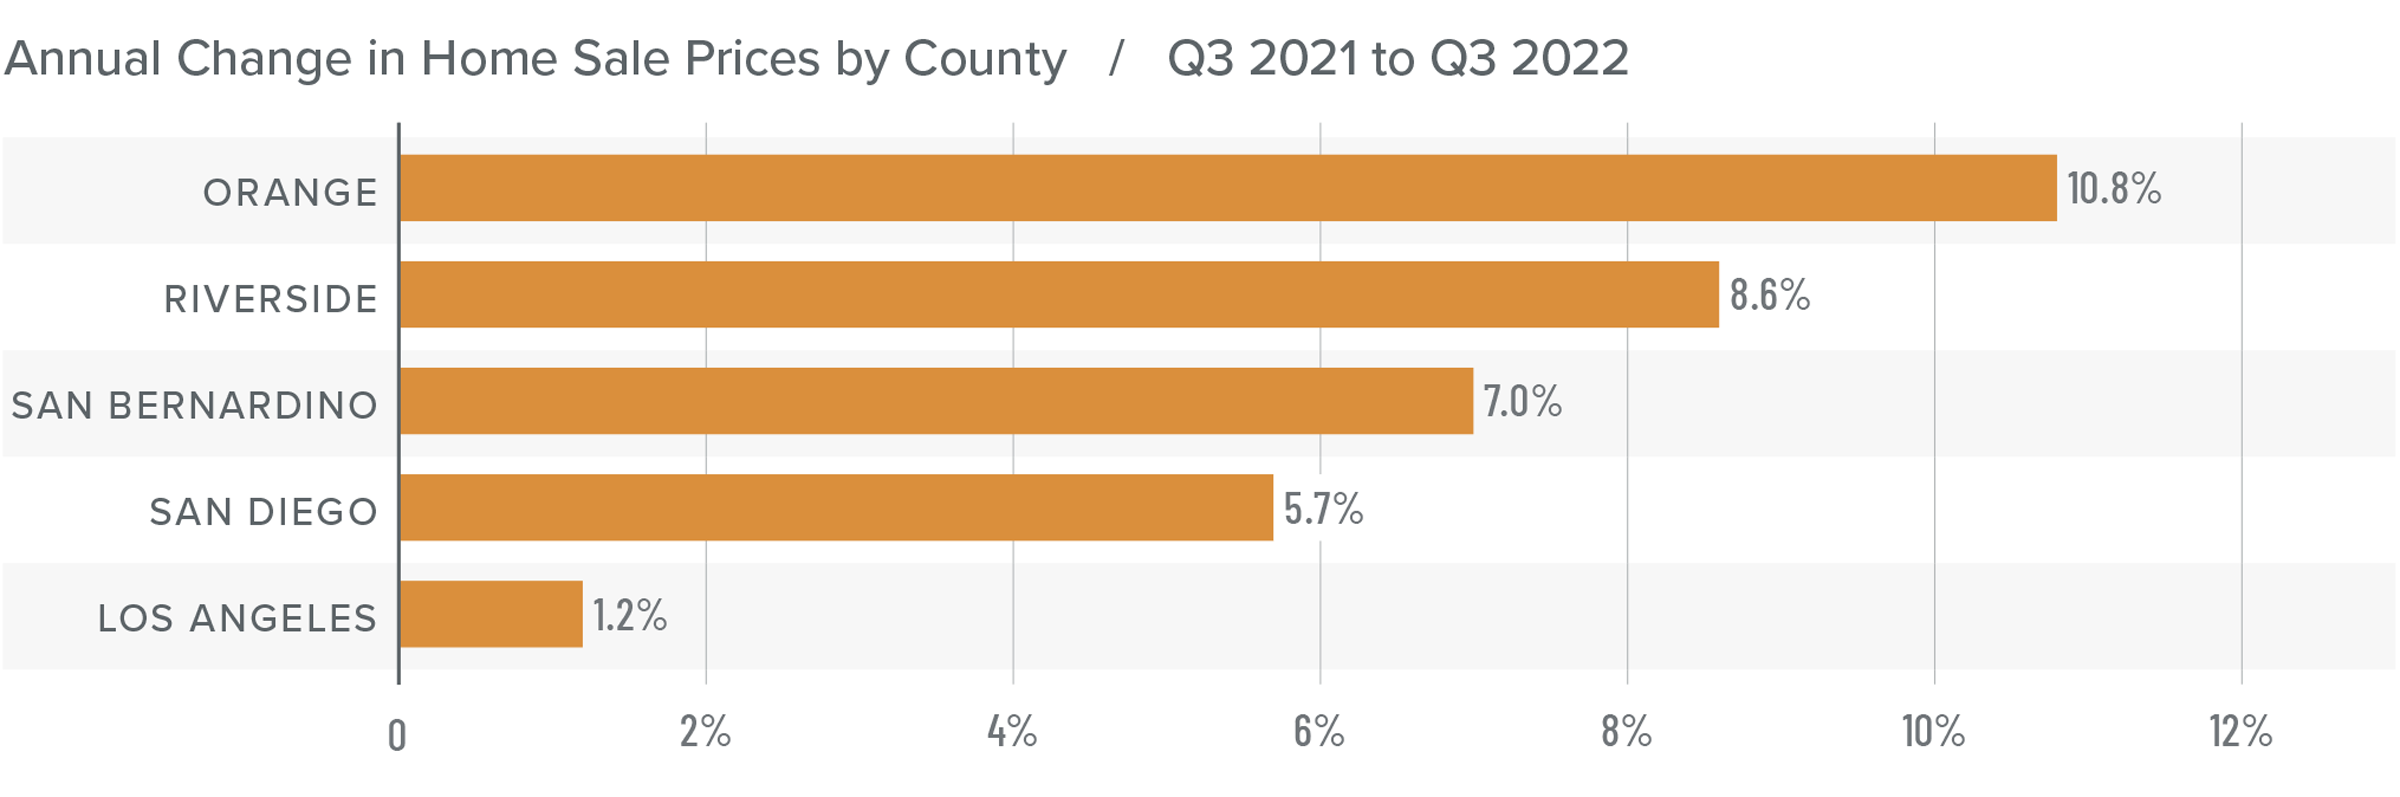
❱ Home sale prices in the quarter rose 4.6% from a year ago but were 7.1% lower than in the second quarter of this year.
❱ Rising mortgage rates are clearly starting to impact the market. This, combined with higher inventory levels, will lead sale prices to continue pulling back.
❱ The region saw double-digit price growth in Orange County, but the overall trend has shown price growth starting to slow. In fact, prices in Los Angeles County rose by only 1.2% year over year.
❱ A period of reversion was inevitable, especially because artificially low mortgage rates could not continue forever. It’s worth remembering that owners saw home values skyrocket over the past few years. This adjustment to home values will only be temporary, and owners still have ample equity in their homes.
Mortgage Rates
This remains an uncertain period for mortgage rates. When the Federal Reserve slowed bond purchases in 2013, investors were accused of having a “taper tantrum,” and we are seeing a similar reaction today. The Fed appears to be content to watch the housing market go through a period of pain as they throw all their tools at reducing inflation.
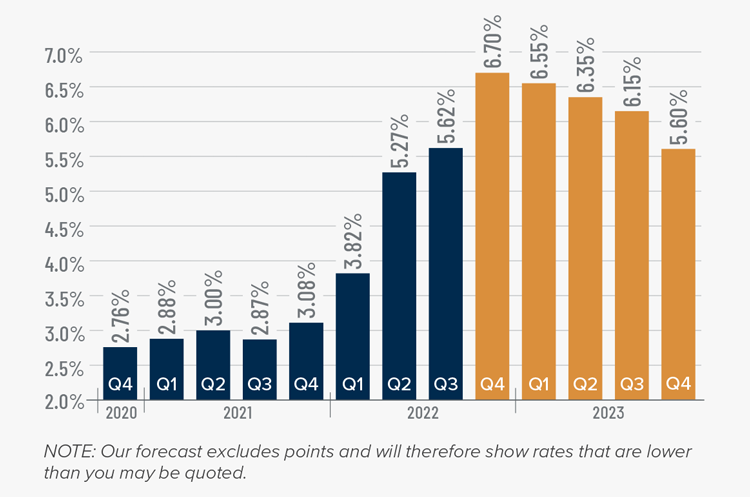
As a result, mortgage rates are out of sync with treasury yields, which not only continues to push rates much higher, but also creates violent swings in both directions. My current forecast calls for rates to peak in the fourth quarter of this year before starting to slowly pull back. That said, they will remain in the 6% range until the end of 2023.
Southern California Days on Market
❱ In the third quarter of 2022, the average time it took to sell a home in the region was 25 days, which is 7 more than a year ago and 9 more days than in the second quarter.
❱ Compared to the second quarter of 2022, market time rose in all counties covered by this report.
❱ Homes in San Diego County continue to sell at a faster rate than other markets in the region. All counties saw market time increase year over year.
❱ More homes for sale and higher financing costs have led to increased days on market. That said, it’s important to put the data into perspective; in the third quarter of 2019, the average market time in the region was 42 days.

Conclusions
This speedometer reflects the state of the region’s real estate market using housing inventory, price gains, home sales, interest rates, and larger economic factors.
The housing market has entered a period of transition following the overheated conditions in 2020-2021. Though the headline numbers are far from buoyant, it’s important to understand that the region is only reverting back to where it was before the pandemic. Any belief that the area is going to experience the same meltdown as it went through in the late 2000s is simply inaccurate. There will be an uncomfortable period, but a return to fundamentals is necessary.

As such, I have moved the needle more in favor of buyers as the region continues to trend back toward balance.
About Matthew Gardner
As Chief Economist for Windermere Real Estate, Matthew Gardner is responsible for analyzing and interpreting economic data and its impact on the real estate market on both a local and national level. Matthew has over 30 years of professional experience both in the U.S. and U.K.
In addition to his day-to-day responsibilities, Matthew sits on the Washington State Governors Council of Economic Advisors; chairs the Board of Trustees at the Washington Center for Real Estate Research at the University of Washington; and is an Advisory Board Member at the Runstad Center for Real Estate Studies at the University of Washington where he also lectures in real estate economics.
Q2 2022 Southern California Real Estate Market Update

The following analysis of select counties of the Southern California real estate market is provided by Windermere Real Estate Chief Economist Matthew Gardner. We hope that this information may assist you with making better-informed real estate decisions. For further information about the housing market in your area, please don’t hesitate to contact your Windermere Real Estate agent.
Regional Economic Overview
Total employment in the counties covered by this report has risen more than 600,000 jobs over the past year, recovering 97.3% of the jobs lost due to the pandemic. Unsurprisingly, Los Angeles County still has the largest shortfall (-254,000 jobs), followed by Orange County (-44,100) and San Diego County (-15,000). Riverside and San Bernardino counties are now well above pre-pandemic employment levels. The region’s unemployment rate in May was 3.6%, down from 8.2% a year ago. The lowest rates were in Orange County (2.4%) and San Diego County (2.7%). The highest unemployment rate was in Los Angeles County, where 4.5% of the labor force was without a job. The Inland Empire continues to outperform, and I am hopeful that the rest of the region will return to pre-pandemic employment levels by the end of the year. However, it’s likely that Los Angeles County may take somewhat longer to fully recover due to its size.
Southern California Home Sales
❱ In the second quarter, 47,596 homes sold, down 19% from a year ago but up 13.1% compared to the first quarter of the year.
❱ Pending home sales, which are an indicator of future closings, were down modestly from the first quarter. However, I still expect that the summer will see a decent number of sales.
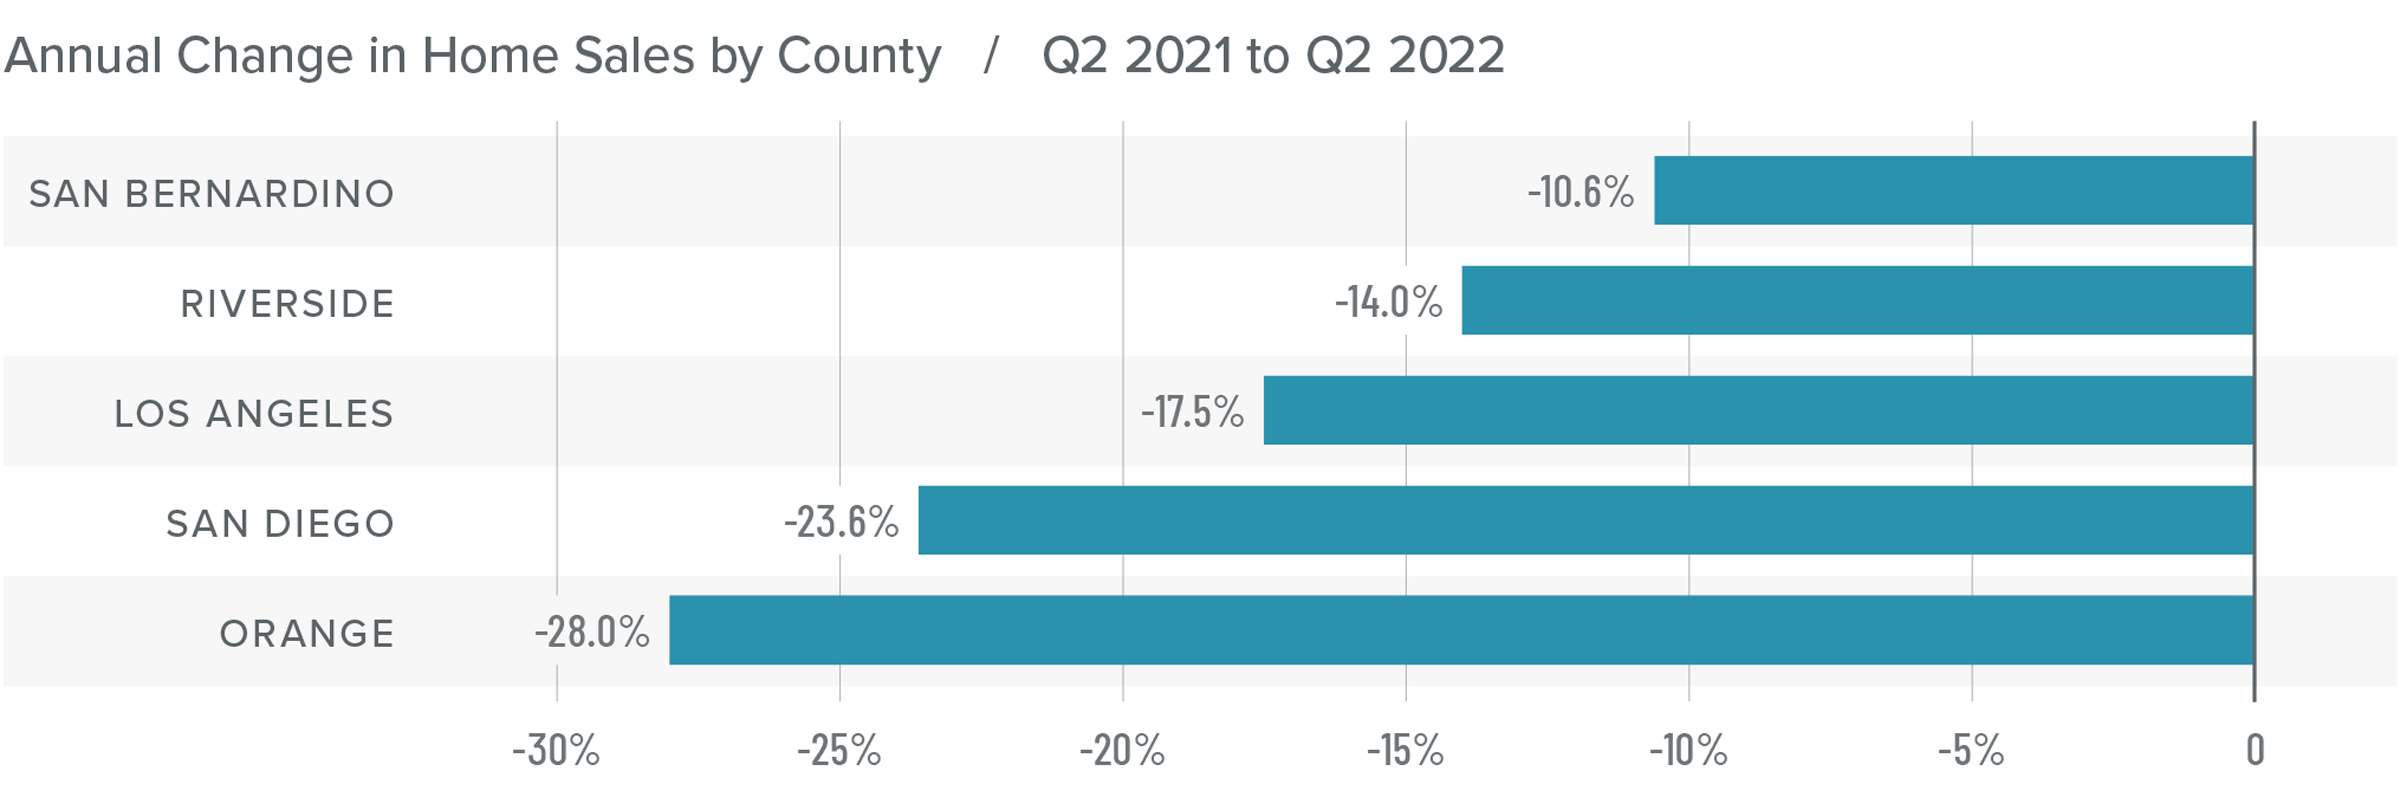
❱ The largest drop in sales was in Orange County, but all markets saw significant declines. That said, the spring market was in place in San Diego, Los Angeles, and Orange counties, which experienced double-digit percentage increases in sales compared to the prior quarter.
❱ Listing activity has risen across the region, which has given buyers more in the way of choice. That may explain, to a certain degree, why pending sales have pulled back; buyers are not feeling as pressured as they were when inventory was very low.
Southern California Home Prices
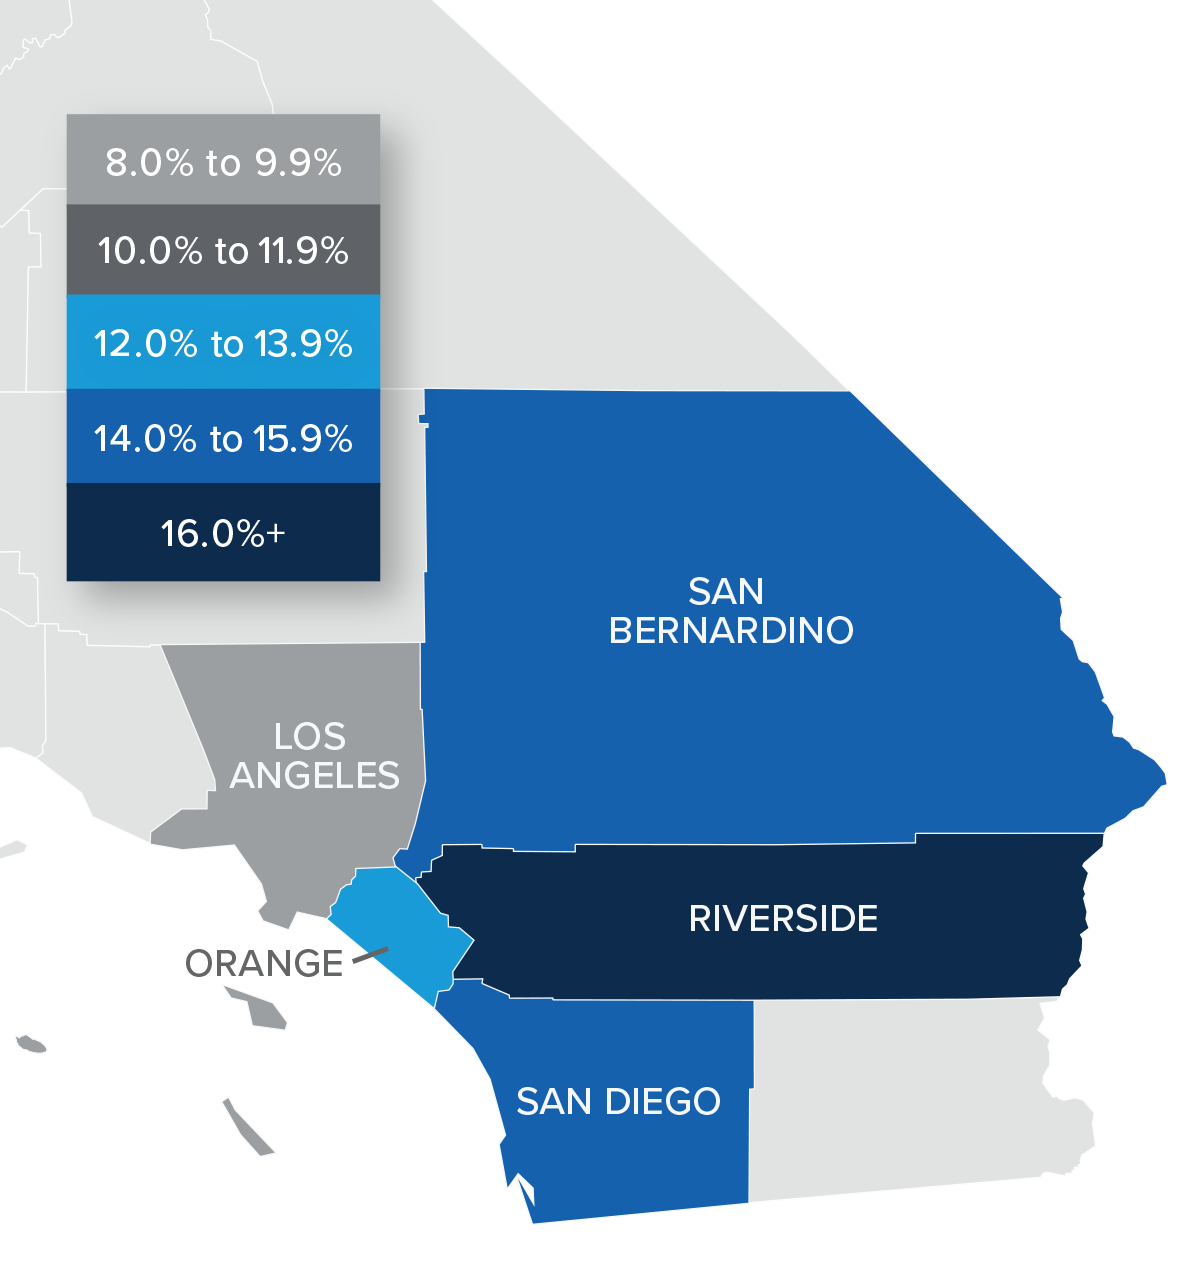
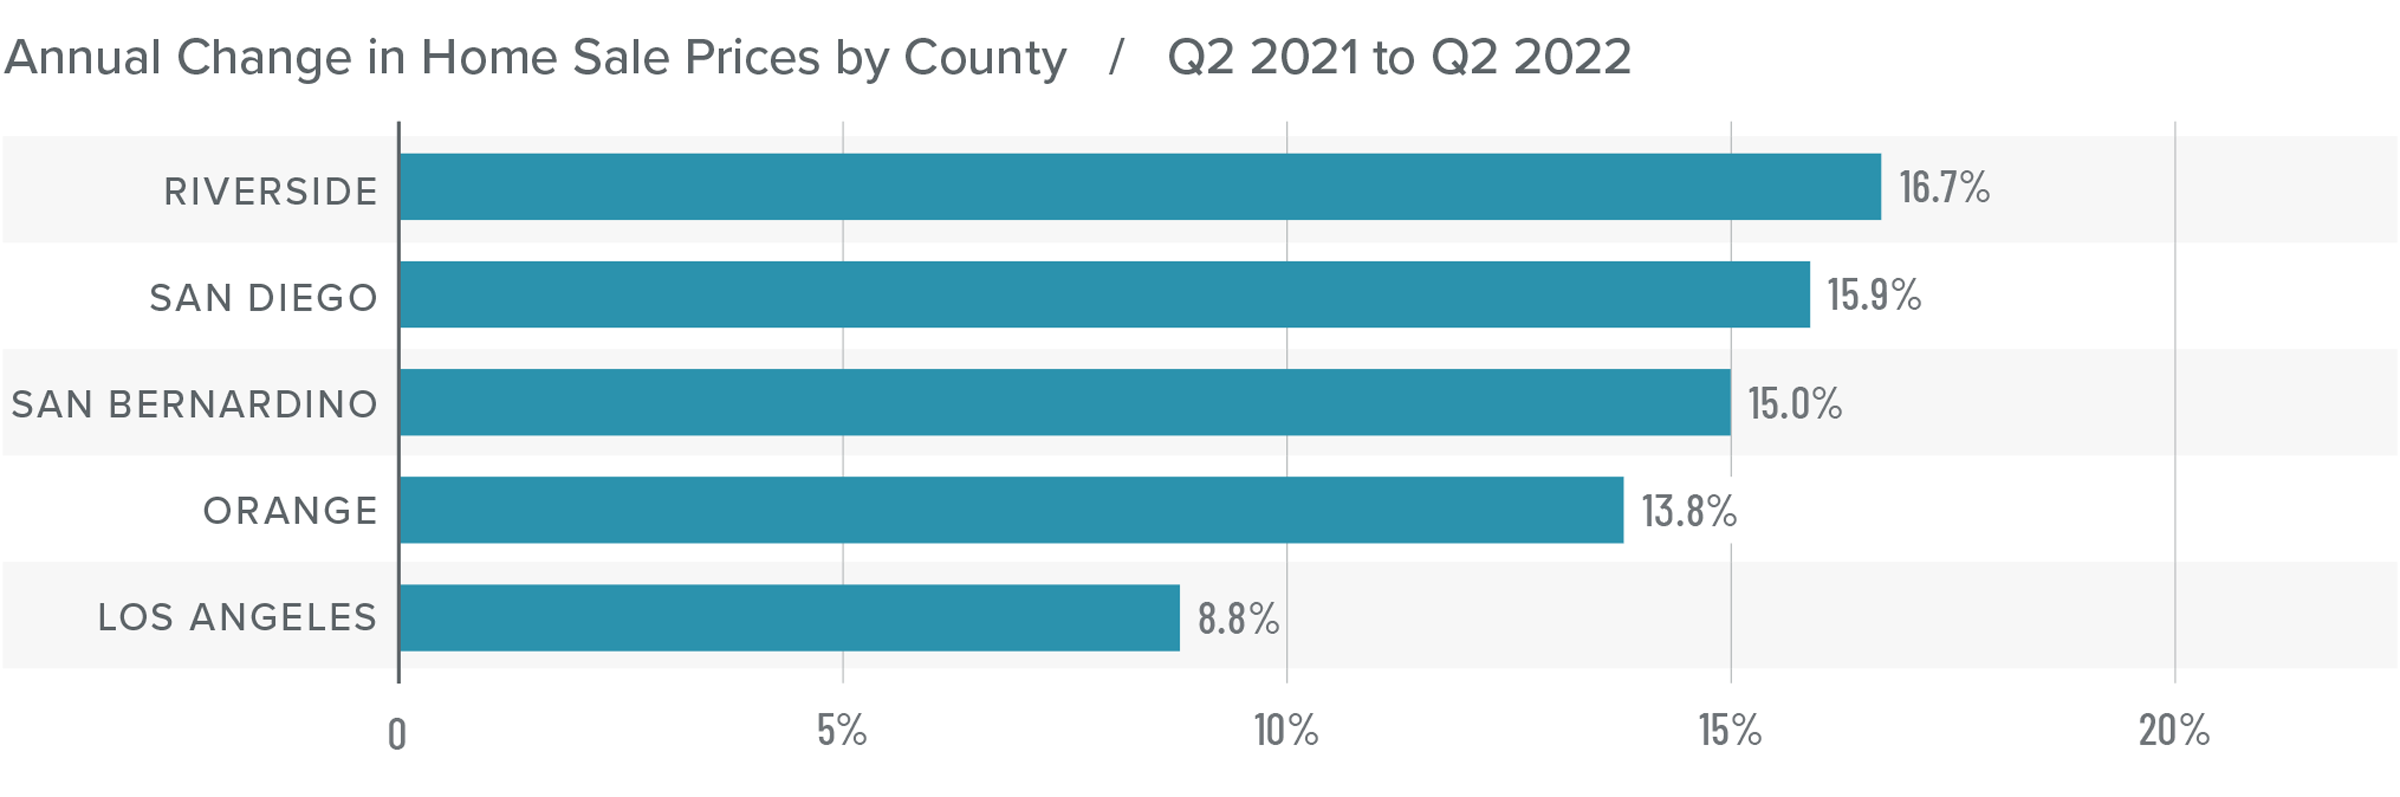
❱ Home prices in the second quarter rose 10.9% compared to a year ago and were 5.4% higher than in first quarter of 2022.
❱ Rising mortgage rates have not had as much of an impact as some expected, but increased financing costs appear to have taken at least some of the heat off the market, as demonstrated by the slowing pace of price growth compared to 2021.
❱ There was double-digit price growth in every county other than Los Angeles. Riverside County led the way with prices rising by 16.7%. The rest of the region also saw very impressive sale price growth.
❱ With relatively high mortgage rates and more homes coming to market, I have started to watch list prices closely. Compared to the first quarter, median list prices are still up an average of 8.7%, suggesting that sellers remain rather bullish.
Mortgage Rates
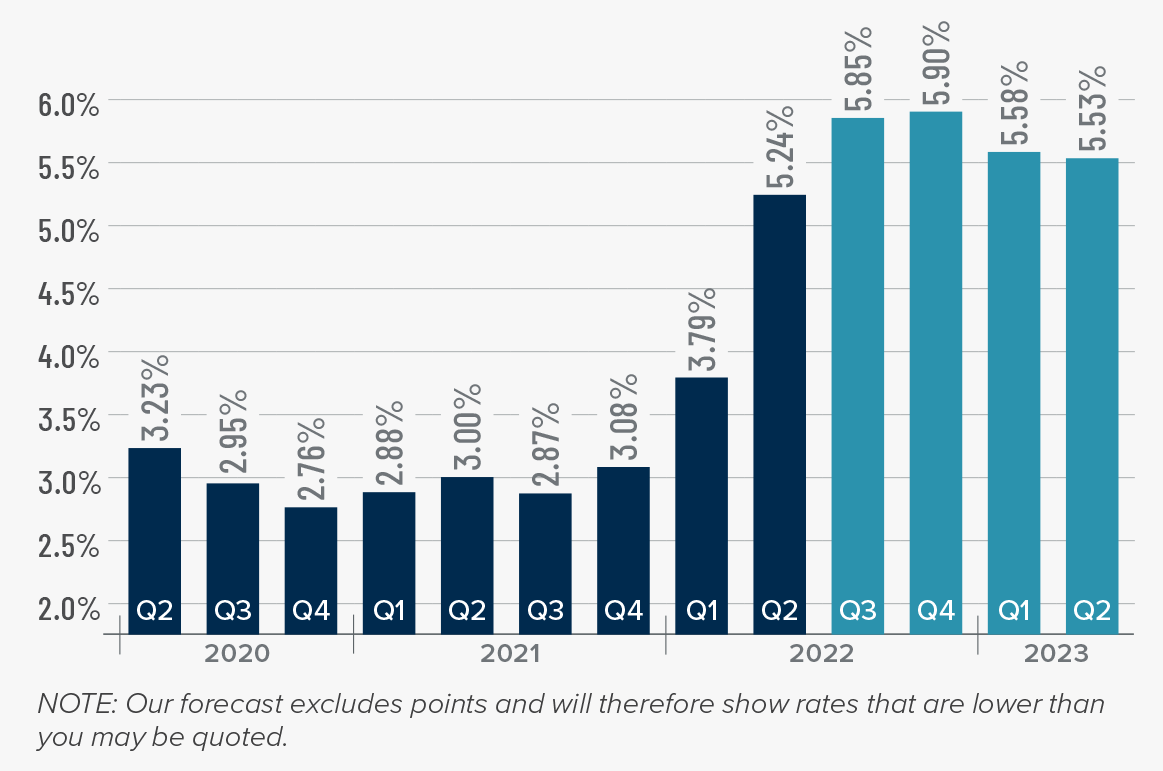
Although mortgage rates did drop in June, the quarterly trend was still moving higher. Inflation—the bane of bonds and, therefore, mortgage rates—has yet to slow, which is putting upward pressure on financing costs.
That said, there are some signs that inflation is starting to soften and if this starts to show in upcoming Consumer Price Index numbers then rates will likely find a ceiling. I am hopeful this will be the case at some point in the third quarter, which is reflected in my forecast.
Southern California Days on Market
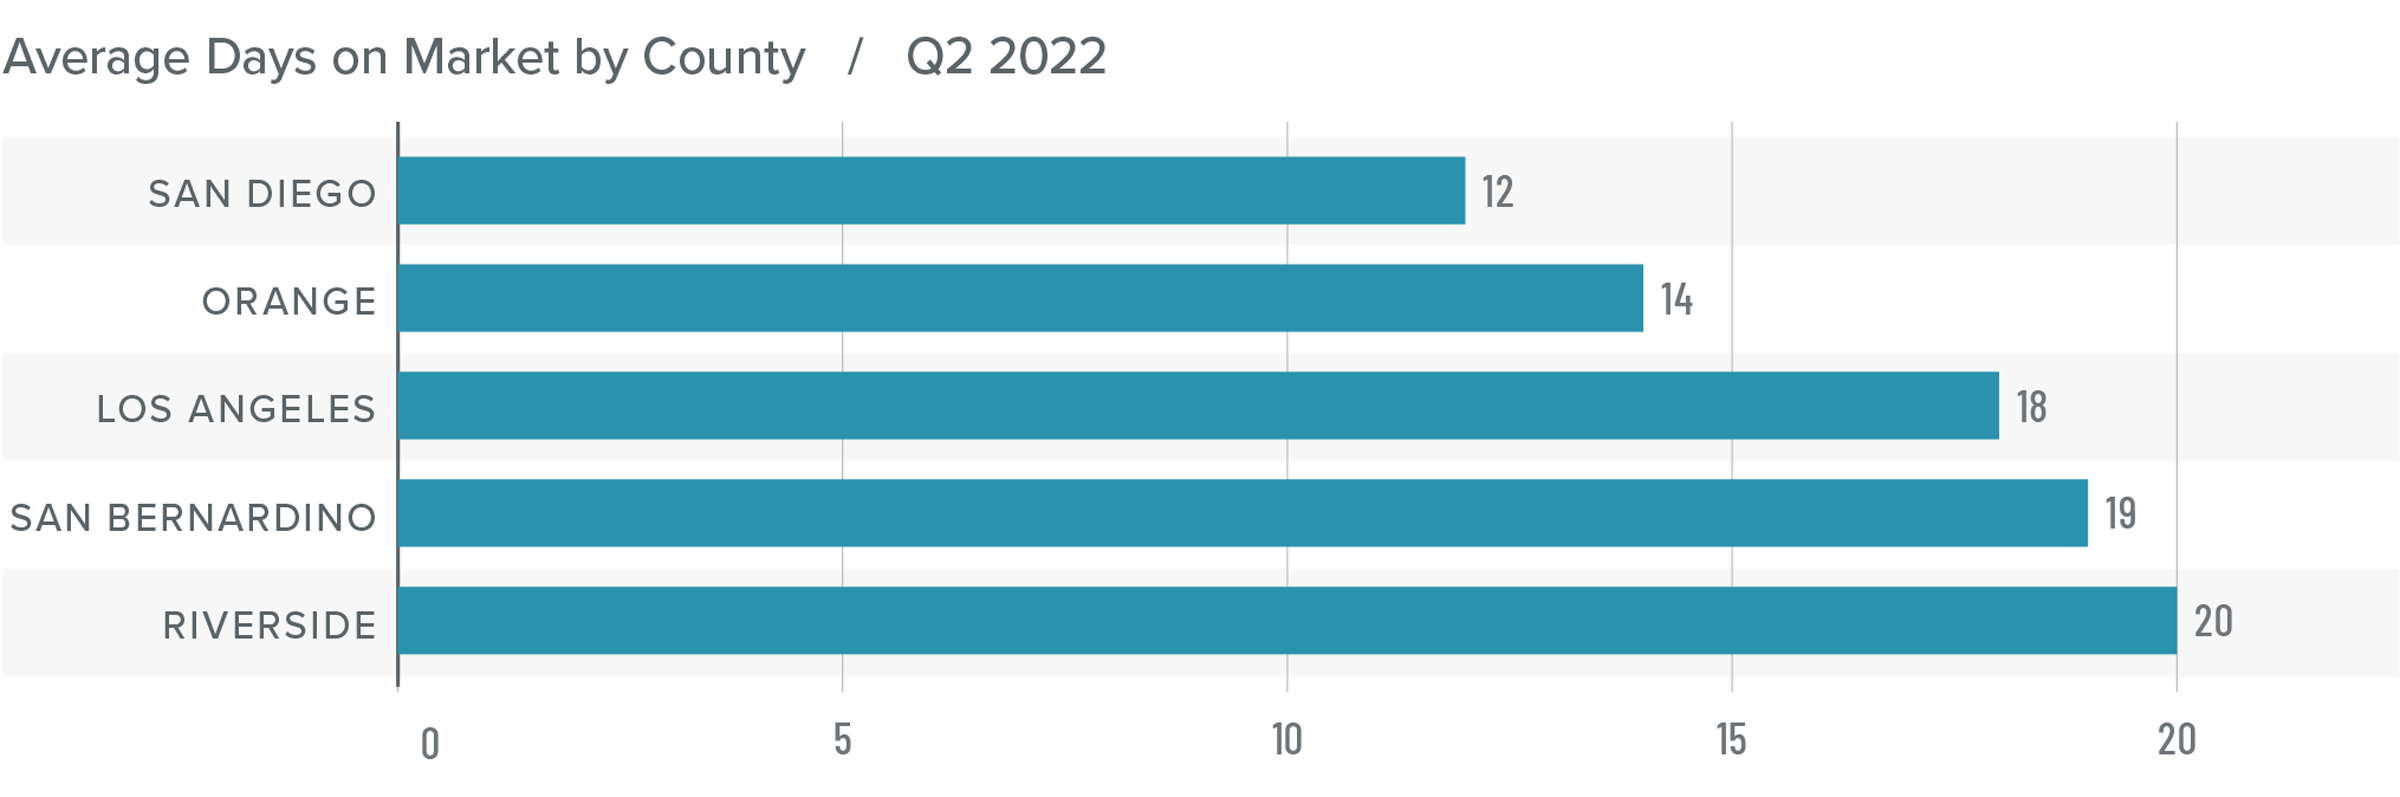
❱ In the second quarter of 2022, the average time it took to sell a home in the region was 16 days, which was 2 fewer days than a year ago and 5 fewer days than in the first quarter of the year.
❱ Compared to the first quarter of 2022, days on market dropped in all counties covered by this report, which was impressive given the higher number of homes for sale.
❱ Homes in San Diego County continue to sell at a faster rate than other markets in the region. All counties other than San Bernardino (where it took one more day for homes to sell than a year ago) saw market time drop.
❱ With inventory levels rising, some may think that the market is set for a correction, but I disagree. Sales are still higher than in 2019 and it took half the time to sell a home in the second quarter of this year than it did during the same period in 2019.
Conclusions
This speedometer reflects the state of the region’s real estate market using housing inventory, price gains, home sales, interest rates, and larger economic factors.
The trend in the job recovery remains positive, and the prospect of a return of all the jobs lost due to the pandemic is becoming more palpable. The housing market is still performing well, even in the face of higher inventory levels and rising financing costs. That said, the frenetic pace of activity of the past 18 months or so will slow, but not to a degree that is concerning.

More listings led to more sales, which is a little counterintuitive especially given far higher mortgage rates than we’ve seen in years. The market remains favorable to home sellers, and they are still in the driver’s seat.
About Matthew Gardner
As Chief Economist for Windermere Real Estate, Matthew Gardner is responsible for analyzing and interpreting economic data and its impact on the real estate market on both a local and national level. Matthew has over 30 years of professional experience both in the U.S. and U.K.
In addition to his day-to-day responsibilities, Matthew sits on the Washington State Governors Council of Economic Advisors; chairs the Board of Trustees at the Washington Center for Real Estate Research at the University of Washington; and is an Advisory Board Member at the Runstad Center for Real Estate Studies at the University of Washington where he also lectures in real estate economics.
Q1 2022 Southern California Real Estate Market Update

The following analysis of select counties of the Southern California real estate market is provided by Windermere Real Estate Chief Economist Matthew Gardner. We hope that this information may assist you with making better-informed real estate decisions. For further information about the housing market in your area, please don’t hesitate to contact your Windermere Real Estate agent.
Regional Economic Overview
The counties covered by this report have now recovered 1.89 million of the 2.17 million jobs that were lost due to the pandemic. With only 279,000 jobs needed for a full recovery, it is likely that the region will break above the pre-pandemic employment level by sometime this summer. Of note is that both Riverside and San Bernardino counties have already seen a full job recovery, and current employment levels are now more than 33,000 above the pre-pandemic peak. The region’s unemployment rate in February was 4.8%, down from 9.8% a year ago. The lowest rates were in Orange (3.7%) and San Diego (4%) counties. The highest rate was again in Los Angeles County, where it was 5.4%. In all, the Southern California economy continues to recover, with the Inland Empire performing very well. Of course, the region’s performance is influenced by Los Angeles County given its size, which is still acting as a bit of a drag to the overall job recovery. Although I hope the pace of job growth here will pick up, it will be held back by a labor force that has fewer persons in it today than it did at the start of 2020.
Southern California Home Sales
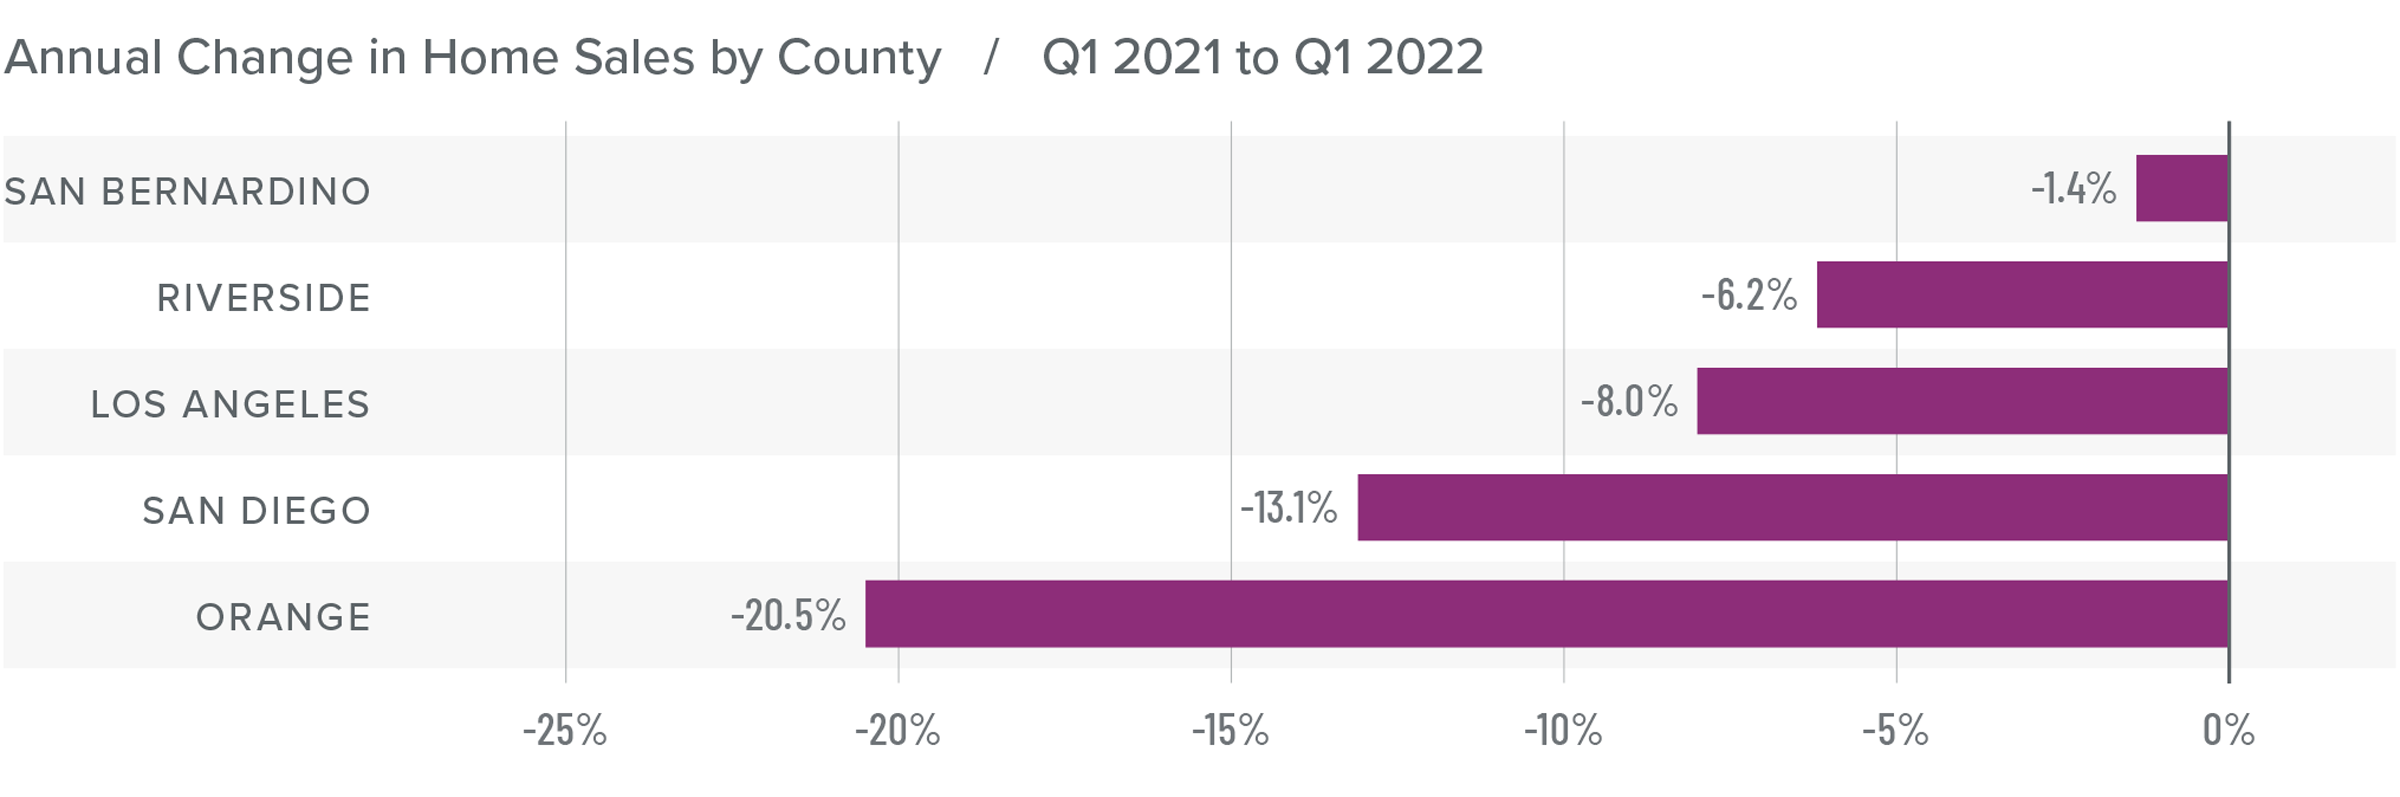
❱ In the first quarter of the year, 42,069 homes sold, which is down 9.7% from a year ago. There were 9.6% fewer sales than in the fourth quarter of 2021.
❱ Pending home sales—an indicator of future closings—rose more than 10% from the prior quarter, suggesting that sales activity in the spring may pick back up.
❱ The most significant decreases in sales were in Orange and San Diego counties, but all markets fell. Significant supply-side issues persist as listing activity was down more than 25% compared to the same period in 2021. There were 8.9% fewer homes for sale than in the fourth quarter of 2021.
❱ Buyers are looking, but choices are limited. Although listing activity has picked up in San Diego County, the other markets have not seen any growth. This will hopefully change as we move through the spring, but it’s not guaranteed, and buyers will likely remain frustrated.
Southern California Home Prices
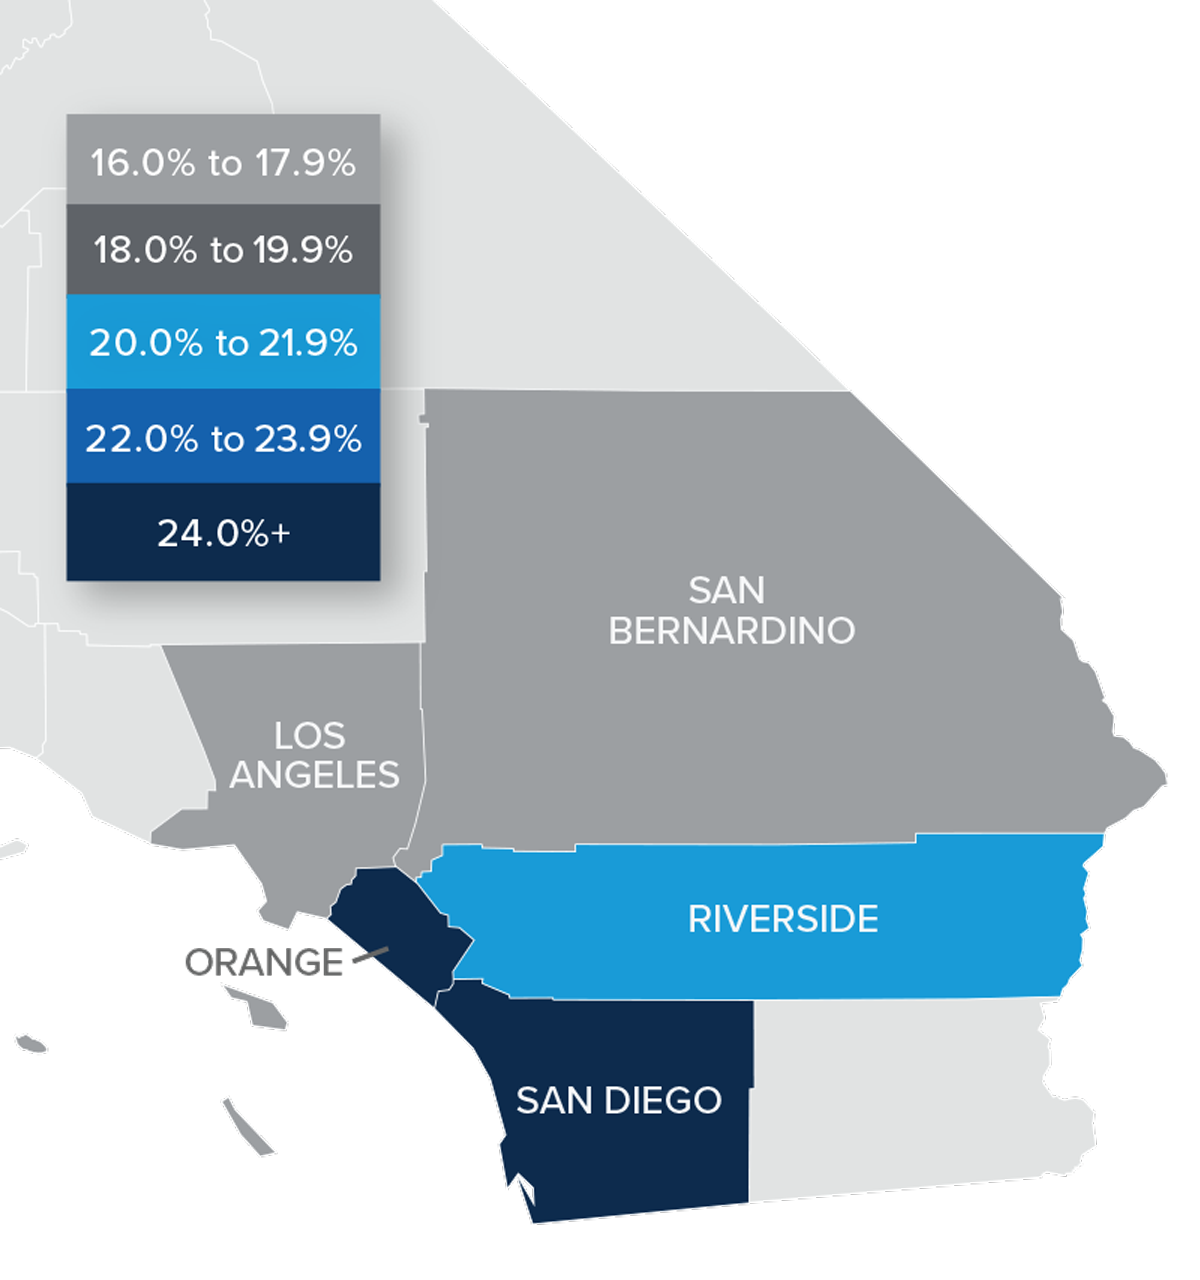
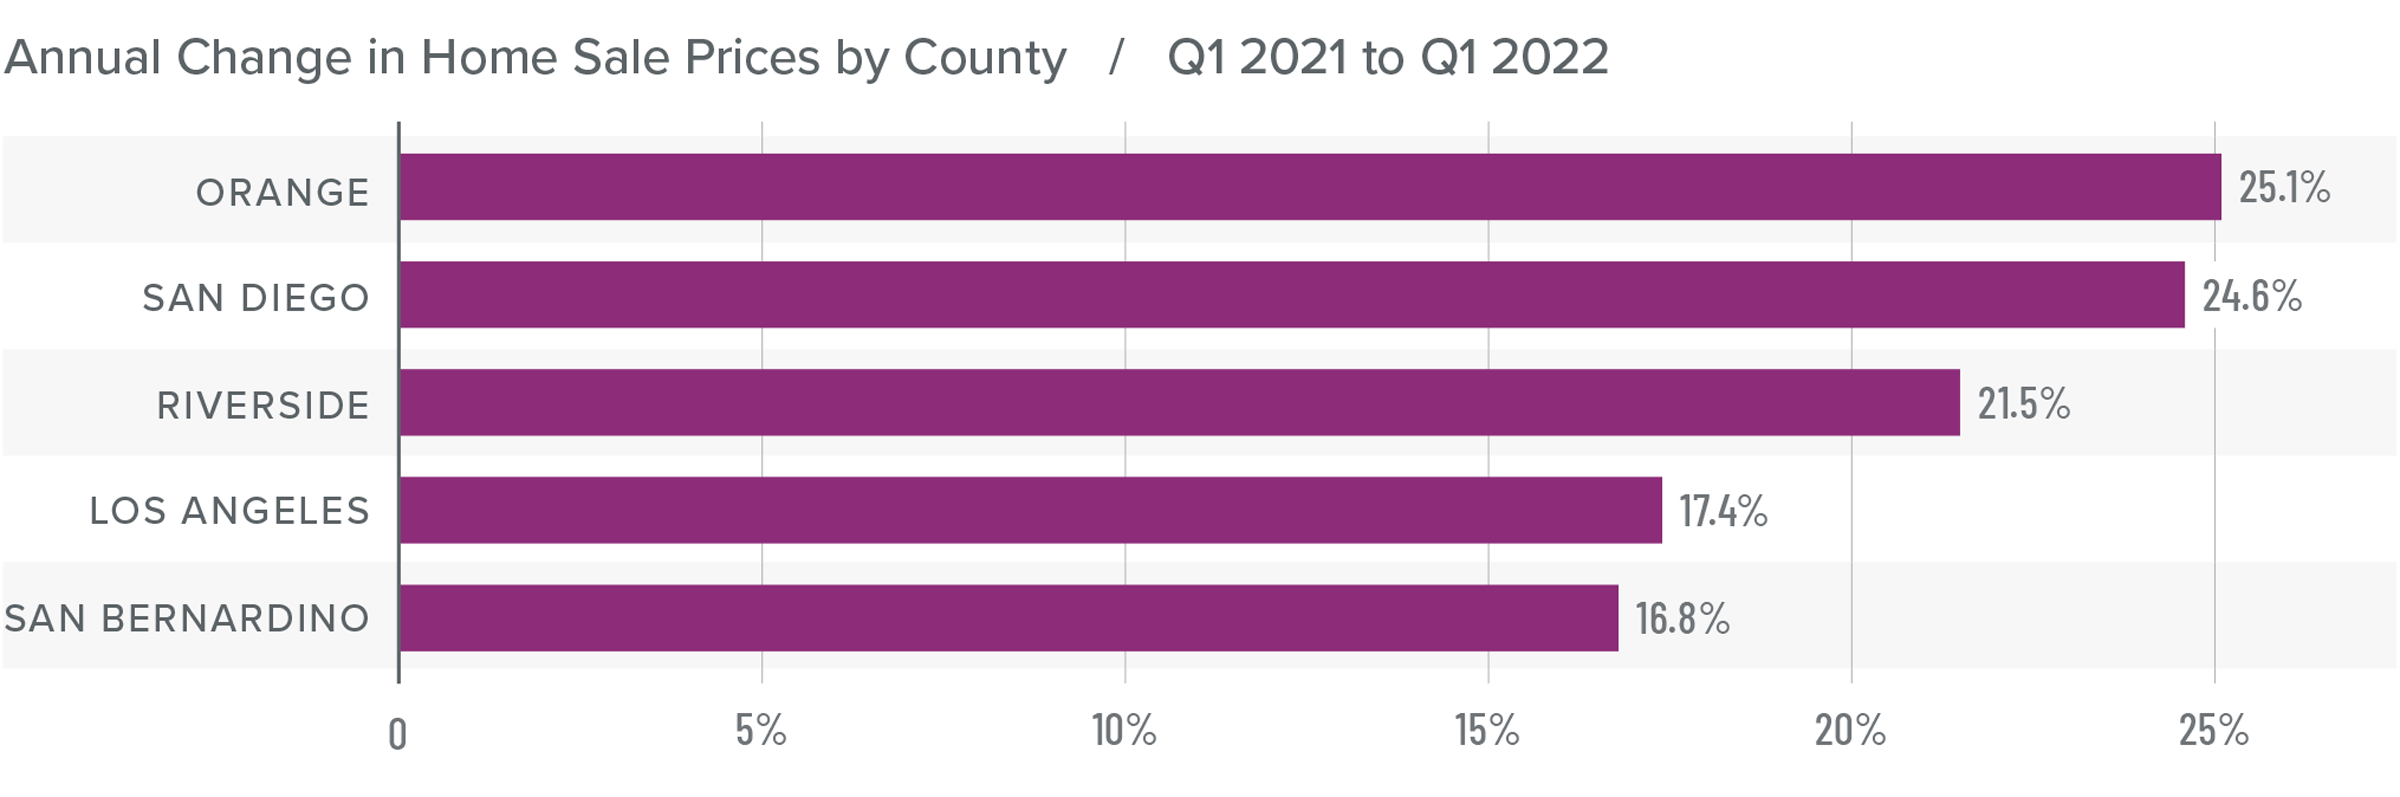
❱ Home prices in the first quarter rose 19.1% compared to a year ago and were 4.2% higher than in the fourth quarter of 2021.
❱ It appears as if the spike in mortgage rates during the first quarter has not dampened the market and, with more buyers than sellers, the market is still extremely hot.
❱ The region saw double-digit price growth across the board, with Orange County again leading the way. Of note is that home prices in Riverside County rose 10.7% compared to the prior quarter.
❱ Rising mortgage rates and prices are certain to push affordability down even further, which is concerning. The question remains whether rising financing costs will start to slow the market. For the time being, this does not appear to be the case.
Mortgage Rates
Average rates for a 30-year conforming mortgage were 3.11% at the end of 2021, but since then have jumped over 1.5%—the largest increase since 1987. The speed of the surge in rates is due to the market having quickly priced in the seven-to-eight rate increase that the Fed is expected to implement this year.
Because the mortgage market has priced this into the rates they are offering today, my forecast suggests that we are getting close to a ceiling in rates, and it is my belief that they will rise modestly in the second quarter before stabilizing for the balance of the year.

Southern California Days on Market
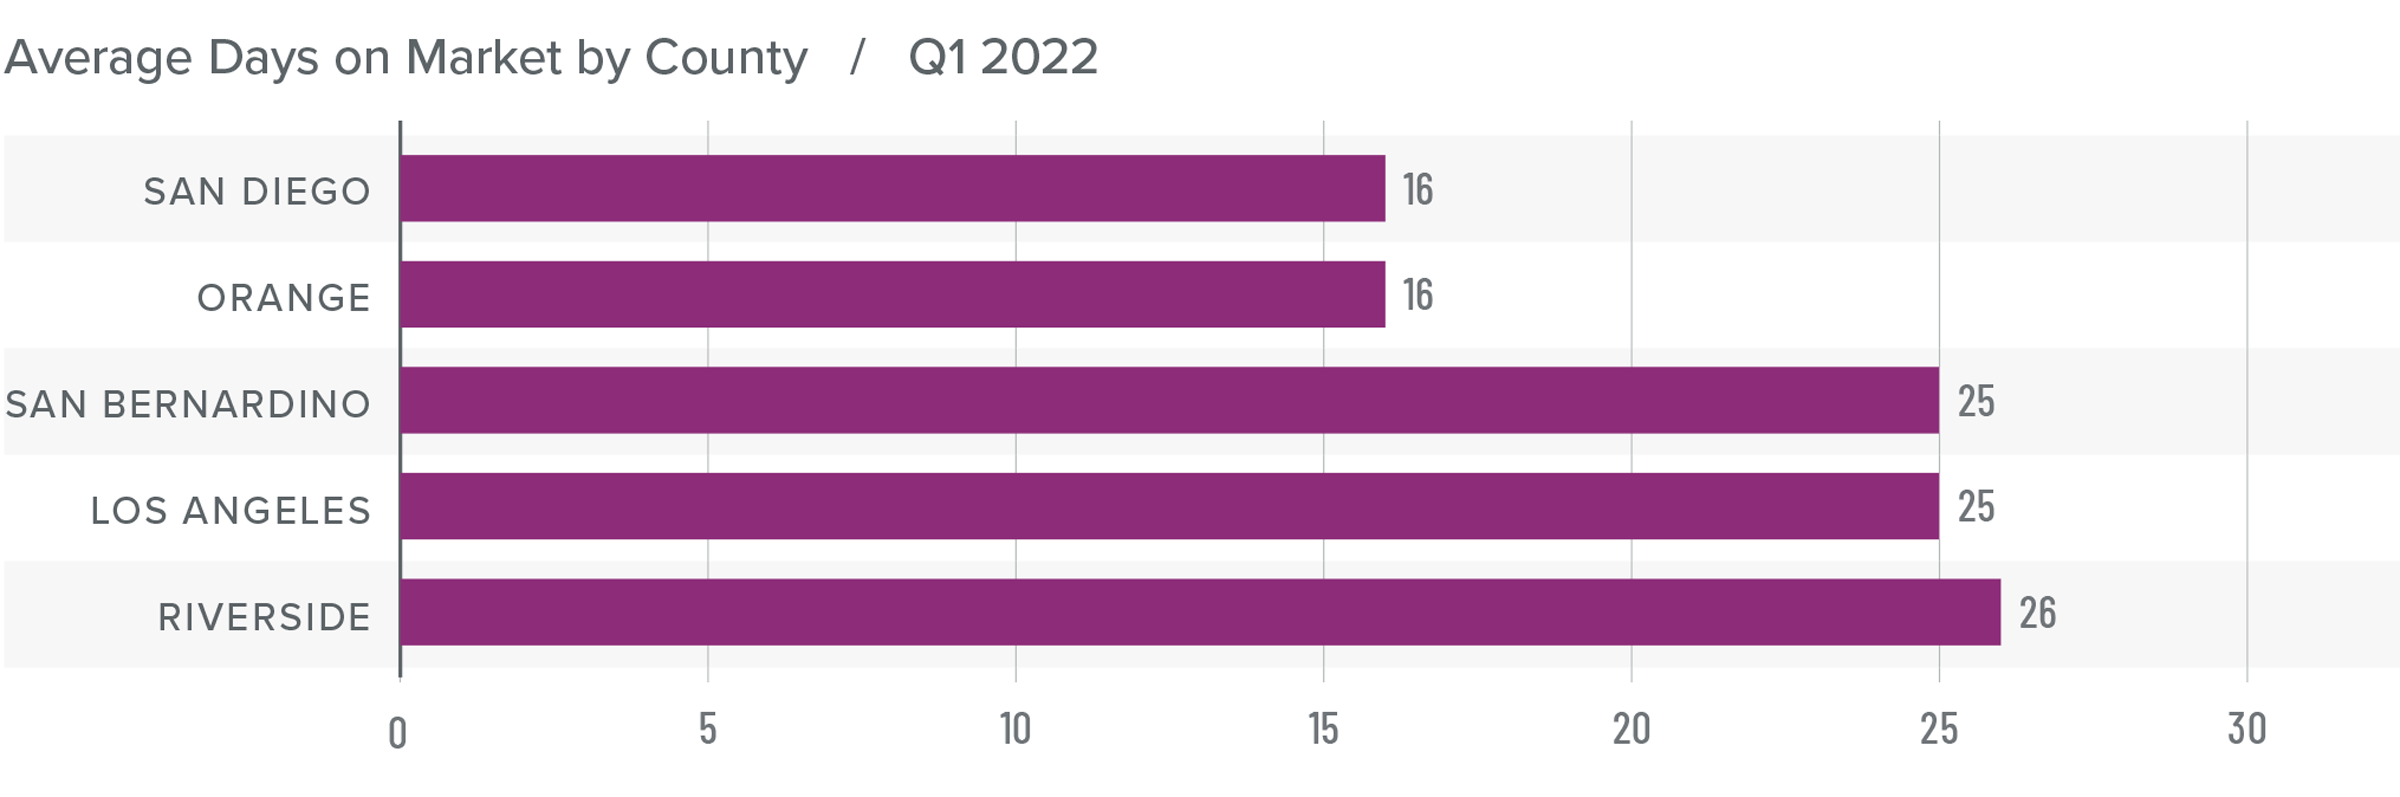
❱ In the first quarter of the year, the average time it took to sell a home in the region was 22 days, which was 6 fewer days than a year ago but 1 day longer than in the final quarter of 2021.
❱ Homes in San Diego County continue to sell at a faster rate than other markets in the region. In the fourth quarter, it took an average of 16 days to sell a home there—two fewer days than it took a year ago.
❱ The other four counties also saw the time it took to sell drop compared to a year ago, but market time rose very modestly in Riverside, Los Angeles, and San Bernardino counties compared to the fourth quarter of 2021.
❱ Limited inventory combined with growing buyer demand is creating a very tight market. Any increases we see in the number of homes for sale in the coming months is not likely to be enough to satisfy buyers.
Conclusions
This speedometer reflects the state of the region’s real estate market using housing inventory, price gains, home sales, interest rates, and larger economic factors.
Despite low inventory levels and rising mortgage rates, the housing market continues to perform very well in Southern California. The spike in mortgage rates has yet to have a significant impact on price growth or demand; however, it will be interesting to check back in the second quarter because if there is an impact, that’s when we would likely see it.

Sellers remain in the driver’s seat, but if higher financing costs start to affect the market, there may be a shift back towards more normal conditions. My instincts suggest that this will not be the case, but only time will tell. With all of this in mind, I have left the needle in the same position as last quarter.
About Matthew Gardner
As Chief Economist for Windermere Real Estate, Matthew Gardner is responsible for analyzing and interpreting economic data and its impact on the real estate market on both a local and national level. Matthew has over 30 years of professional experience both in the U.S. and U.K.
In addition to his day-to-day responsibilities, Matthew sits on the Washington State Governors Council of Economic Advisors; chairs the Board of Trustees at the Washington Center for Real Estate Research at the University of Washington; and is an Advisory Board Member at the Runstad Center for Real Estate Studies at the University of Washington where he also lectures in real estate economics.
Q4 2021 Southern California Real Estate Market Update

The following analysis of the Southern California real estate market is provided by Windermere Real Estate Chief Economist Matthew Gardner. We hope that this information may assist you with making better-informed real estate decisions. For further information about the housing market in your area, please don’t hesitate to contact your Windermere Real Estate agent.
Regional Economic Overview
Following significant job gains in the summer months, the fall continued to show an economy in recovery. As of the most recent data (November), the southern California region had added more than 212,000 jobs, which is very notable as it exceeds the growth in the previous quarter (and we still have to add the December numbers). So far, the market has recovered more than 1.66 million of the 2.02 million jobs that were lost during the pandemic, and we need only 347,000 more to get back to where we were before the pandemic hit. The region’s unemployment rate in November was 5.9% and has been trending lower since June 2021. All the markets contained in this report saw unemployment numbers drop. The lowest jobless rates were again in Orange County (4.1%) and San Diego County (4.6%). The highest rate was again in Los Angeles County, where it was 7.1%. The fall was a solid season for the regional job market, and I hope this trend continues. Of course, the latest iteration of COVID-19 arrived in December and any impacts to the economy—and specifically the job market—were not reflected in the most recent data. I hope it won’t significantly slow the job recovery, as the region is now on pace to get back to its pre-COVID employment level by this summer.
southern california Home Sales
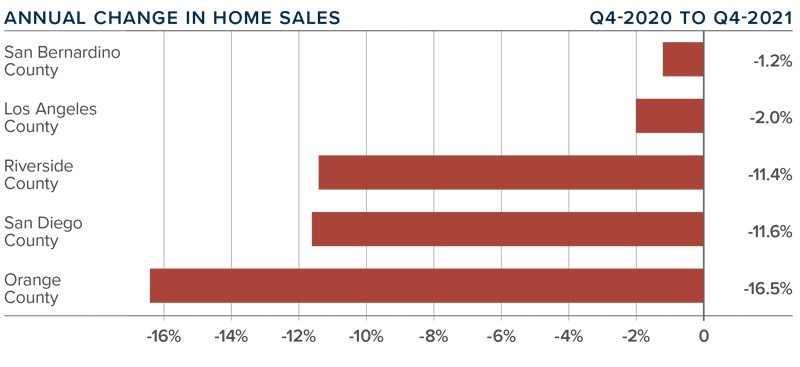
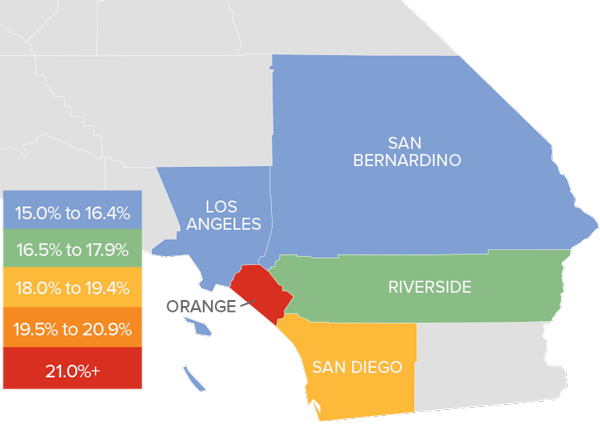
❱ In the final quarter of the year, 46,517 homes sold, which was down 7.6% from a year ago and 7.5% lower than in the third quarter of the year.
❱ Pending home sales, which are an indicator of future closings, were 17.3% lower than the third quarter, suggesting that sales activity in the early spring may also be lackluster.
❱ Year-over-year, sales fell in all markets; this was also the case compared to the third quarter. Although this may seem disconcerting, much of the blame can be placed on the lack of homes for sale. Inventory was down 33.5% compared to a year ago and 26.3% lower than in the third quarter.
❱ Supply constraints continue to limit sales activity. The issue is not demand, rather it’s a lack of homes for sale that’s holding the market back. Although I expect to see the number of home sales pick up, it is unlikely the region will see total transactions in 2022 exceed 2021 numbers.
southern california Home Prices
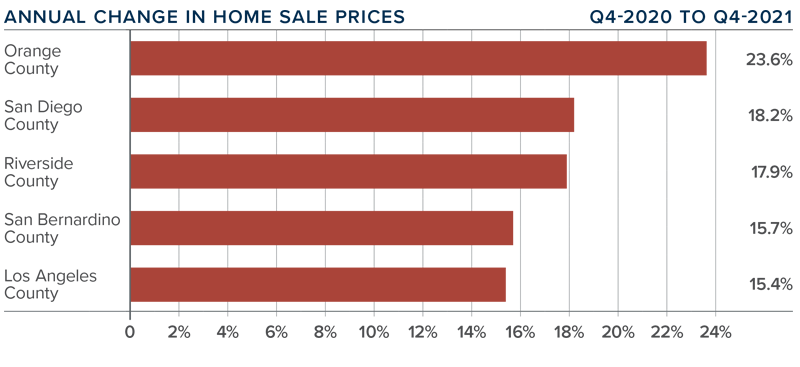
❱ The average home sale price in the region was $982,272, which is 17.8% higher than a year ago and 1.1% higher than in the third quarter.
❱ Average mortgage rates rose by almost a quarter point between the third and fourth quarters, but this has yet to slow down price growth. As we move through 2022, I expect rates to continue to stairstep higher. Although rates will likely end the year at close to 4%, the question is whether this level is high enough to slow price growth.
❱ The region saw double-digit price growth across the board. The fastest growth was in Orange County where prices were up 6.3% compared to the previous quarter.
❱ Rising financing costs—combined with more businesses clarifying their work-from-home policies—may result in more home buyer activity. However, if inventory levels do not rise significantly, the market will remain out of balance, which could lead price growth to continue to trend above the long-term average.
Days on Market
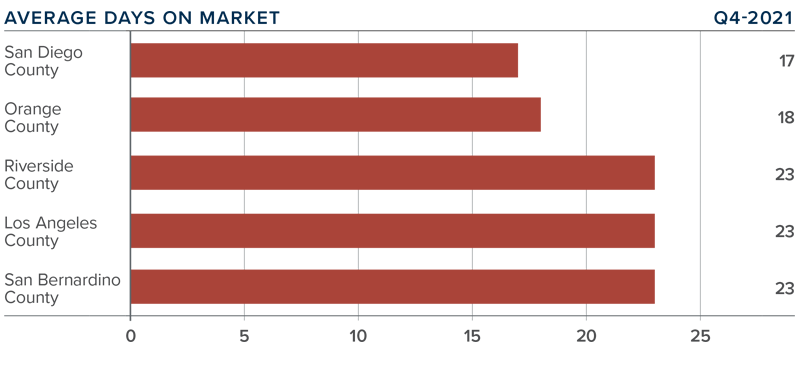
❱ In the final quarter of 2021, the average time it took to sell a home in the region was 21 days, which was 6 fewer days than a year ago but 4 days more than in the third quarter.
❱ The other three counties also saw the time it took to for a seller to find a buyer drop compared to a year ago, but market time rose across the board compared to the third quarter of 2021.
❱ Homes in San Diego County continue to sell at a faster rate than other markets in the region. In the fourth quarter, it took an average of 17 days to sell a home there—2 fewer days than it took a year ago.
❱ Longer days on market may be due to the significant increase in list prices during the quarter in all markets other than Riverside County. Low supply levels have allowed sellers to dictate pricing, but longer market time and fewer transactions could indicate that buyers may be starting to push back.
Conclusions

This speedometer reflects the state of the region’s real estate market using housing inventory, price gains, home sales, interest rates, and larger economic factors.
Jobs continue to return in the region and the housing market remains remarkably tight. As mentioned previously, sellers have been raising prices significantly, but lower sales and longer market time suggest to me that buyers are becoming more selective in the homes they decide to make an offer on. I do not see supply levels increasing significantly, at least not to the degree that matches demand. However, affordability levels continue to drop, which, in concert with rising mortgage rates, may start to slow price growth even as the number of listings remains below the norm.
Considering these factors, I have decided to leave the needle in the same position as the previous quarter. Although it appears that the market may be starting to shift slowly back to balance, I want to see how the spring market performs before I consider moving the needle towards buyers.
About Matthew Gardner

As Chief Economist for Windermere Real Estate, Matthew Gardner is responsible for analyzing and interpreting economic data and its impact on the real estate market on both a local and national level. Matthew has over 30 years of professional experience both in the U.S. and U.K.
In addition to his day-to-day responsibilities, Matthew sits on the Washington State Governors Council of Economic Advisors; chairs the Board of Trustees at the Washington Center for Real Estate Research at the University of Washington; and is an Advisory Board Member at the Runstad Center for Real Estate Studies at the University of Washington where he also lectures in real estate economics.
Q3 2021 Southern California Real Estate Market Update

The following analysis of the Southern California real estate market is provided by Windermere Real Estate Chief Economist Matthew Gardner. We hope that this information may assist you with making better-informed real estate decisions. For further information about the housing market in your area, please don’t hesitate to contact your Windermere Real Estate agent.
Regional Economic Overview
The job recovery in Southern California continues to be quite the roller-coaster, with solid monthly gains followed by significant drops. In the first quarter of the year, more than 326,000 jobs returned, but that was followed by a less-than-stellar 8,300 increase in the second quarter. The latest third quarter numbers (most recent data is from August) showed that the Southern California region has added more than 27,000 positions, but this is still underwhelming.
The COVID-19 Delta variant is impacting the job market, and a lack of available workers isn’t helping. In aggregate, the region has recovered 1.31 million of the 2.02 million jobs that were shed when the pandemic hit, but this means Southern California is still down more than 700,000 positions. The region’s unemployment rate in August was 8.2%, down significantly from 14.2% a year ago. The most recent data shows the lowest jobless rates were in Orange (6%) and San Diego (6.6%) counties. The highest rate was again in Los Angeles County, where it was 9.7%. Although the current pace of the job recovery is muted, I hope it will pick up in the not-too-distant future, but the likelihood of reaching full employment anytime soon appears to be unrealistic.
southern california Home Sales
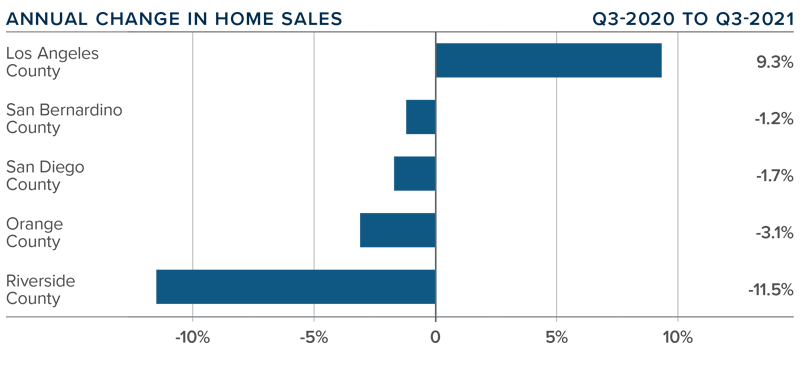
❱ In the third quarter, 50,313 homes sold in Southern California, representing a 0.1% drop from the same period in 2020 and 4.7% lower than in the second quarter of this year.
❱ Pending home sales, which are an indicator of future closings, were 4.5% lower than in the second quarter of this year, suggesting that the final quarter may also be down.
❱ Year-over-year, home sales rose in Los Angeles County, but pulled back in the remaining markets covered by this report. Compared to the second quarter, sales pulled back in all markets other than San Bernardino, where sales rose 6%.
❱ The issue is not demand, rather a lack of supply is holding the market back. Listing activity is down 22.3% from a year ago, and this is impacting sales. That said, listings were 17.1% higher than in the second quarter and, with more choice starting to emerge in the market, we could see sales volumes pick back up.
southern california Home Prices
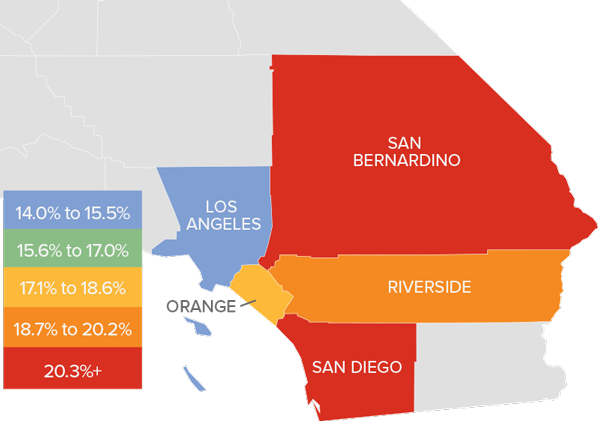
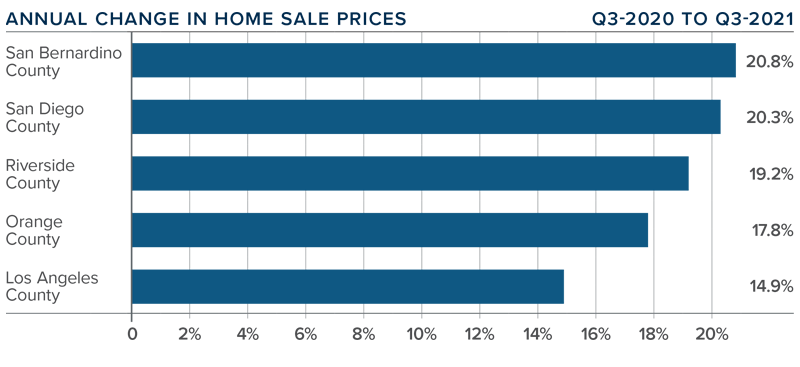
❱ The average price of homes sold in the region was $971,184. This was 19.1% higher than a year ago, but 1.4% lower than in the second quarter of 2021.
❱ Mortgage rates remain remarkably competitive, even if they are off the historic low of last December. Also of note is that jumbo mortgage rates are remarkably competitive—an important factor in expensive markets such as Southern California.
❱ The region saw double-digit price growth across all counties contained in this report. Year over year, prices were up more than 19%, but they were down 1.4% from the previous quarter.
❱ As stated in last quarter’s report, I believe interest rates will rise slowly, which is likely to bring out more buyers. With inventory levels starting to tick up, I am expecting the regional housing market to trend higher, but likely not until the spring.
Days on Market
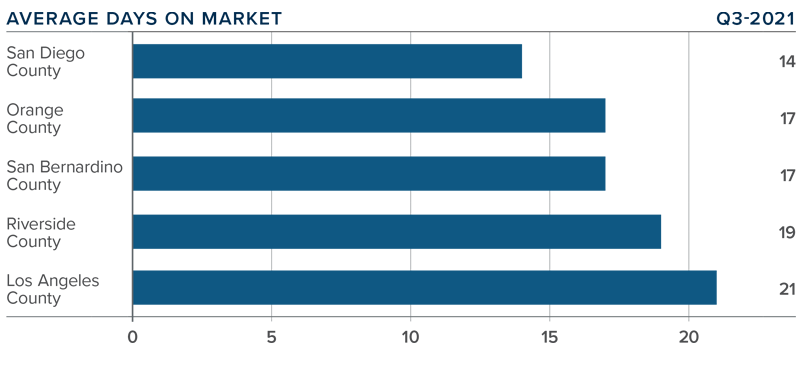
❱ In the third quarter of the year, the average time it took to sell a home in the region was 17 days, which is 16 fewer days than a year ago and 2 fewer days than in the second quarter of 2021.
❱ Three counties saw the time it took to sell a house drop compared to the second quarter of this year: Riverside, Los Angeles, and Orange. Market time was static in San Bernardino County and rose by one day in San Diego County.
❱ Homes in San Diego County continue to sell at a faster rate than other markets in the region. In the third quarter, it took an average of 14 days to sell a home there—9 fewer days than it took a year ago.
❱ With it taking an average of a little more than two weeks for a home to find a buyer, the market remains very tight. That said, with inventory levels rising, it is possible that days on market will start to creep higher, especially as affordability constraints potentially limit the number of qualified buyers.
Conclusions
This speedometer reflects the state of the region’s real estate market using housing inventory, price gains, home sales, interest rates, and larger economic factors.
The third quarter was quite a mixed bag, with rising inventory levels but lower sales and prices compared to the second quarter. When I look at list prices, which is a leading indicator, as opposed to sale prices, which are a lagging indicator, I notice some softening in San Bernardino, Los Angeles, and Riverside counties. Although not a cause for concern, it may suggest that the market is about to start to cool—albeit modestly.
As such, I have chosen to move the needle a little more in the direction of home buyers, although sellers still have the upper hand.
About Matthew Gardner
As Chief Economist for Windermere Real Estate, Matthew Gardner is responsible for analyzing and interpreting economic data and its impact on the real estate market on both a local and national level. Matthew has over 30 years of professional experience both in the U.S. and U.K.
In addition to his day-to-day responsibilities, Matthew sits on the Washington State Governors Council of Economic Advisors; chairs the Board of Trustees at the Washington Center for Real Estate Research at the University of Washington; and is an Advisory Board Member at the Runstad Center for Real Estate Studies at the University of Washington where he also lectures in real estate economics.
Q2 2021 Southern California Real Estate Market Update

The following analysis of the Southern California real estate market is provided by Windermere Real Estate Chief Economist Matthew Gardner. We hope that this information may assist you with making better-informed real estate decisions. For further information about the housing market in your area, please don’t hesitate to contact your Windermere Real Estate agent.
Regional Economic Overview
Despite a decrease in employment levels last winter, Southern California saw a decent job recovery between May 2020 and February 2021. However, it appears we lost some momentum as COVID-19 cases started to rise again, specifically in Los Angeles County. Although the region has recovered 1.28 million of the 2.02 million jobs that were shed during the pandemic, the region is still more than 720,000 jobs shy of the pre-COVID peak. That said, the region’s unemployment rate in June was 8.8%, down significantly from 15.5% a year ago. Data at the end of the second quarter showed the lowest jobless rates were in Orange (6.4%) and San Diego (7%) counties. The highest rate was, unsurprisingly, in Los Angeles County, where it was 10.5%.
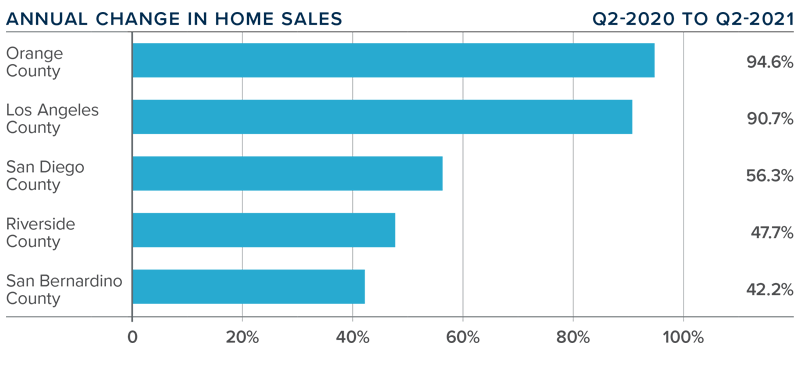
southern california Home Sales
❱ The housing market continued its upward swing, with 52,792 home sales closing in the second quarter, which was a year-over-year increase of 70.5%. However, I would caution not to read too much into this growth rate as COVID-19 heavily impacted sales in the second quarter of last year.
❱ Pending home sales, which are an indicator of future closings, were 10.9% higher than in the first quarter of this year, suggesting that closings in the third quarter will be positive.
❱ Home sales increased across the board, with closings rising in all markets by more than 40%. Sales in Orange and Los Angeles counties nearly doubled.
❱ Listing activity continues to lag, with an average of only 14,747 homes for sale in the quarter. This is 41.8% lower than a year ago, and 6.2% higher than in the first quarter of 2021.
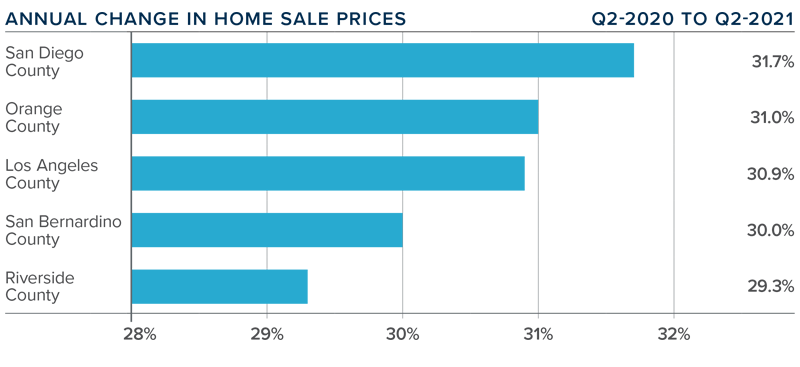
southern california Home Prices

❱ The average home sale price in the region was $984,959. This was 35.7% higher than a year ago and 13.2% higher than in the first quarter of this year.
❱ Mortgage rates rose modestly in the first quarter, which likely got some would-be buyers off the fence. This additional demand, in concert with persistently low supply levels, resulted in significant price appreciation.
❱ The region saw double-digit price growth across all counties contained in this report. Annual prices were up more than 30% in all counties except Riverside—but they only just missed out. On average, prices were up more than $100,000 from the prior quarter.
❱ I still anticipate mortgage rates to rise as we move through the year, but the increase will be very modest. Although prices are expected to rise further, affordability constraints continue to grow, which at some point will slow the remarkable gains we have seen.
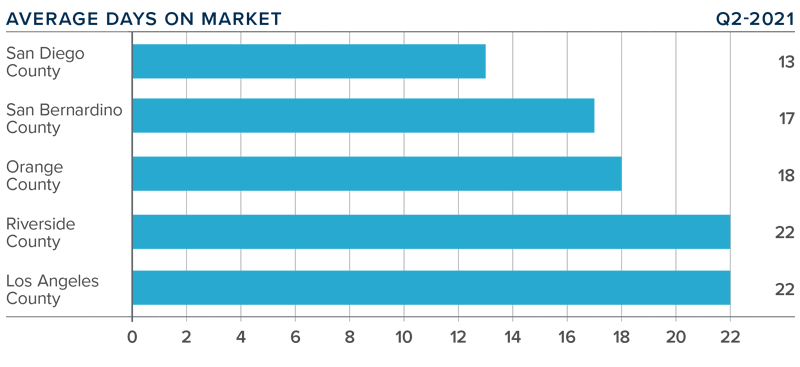
Days on Market
❱ In the second quarter of the year, the average time it took to sell a home in the region was only 19 days, which is 20 fewer days than a year ago and 9 fewer days than in the first quarter of 2021.
❱ All markets contained in this report saw the time it took to sell a house drop compared to both the second quarter of 2020 and the first quarter of this year.
❱ Homes in San Diego County continue to sell at a faster rate than other markets in the region. In the second quarter, it took an average of only 13 days to sell a home there. This is 9 fewer days than it took a year ago.
❱ Comparing days on market to a year ago is not that informative given that the pandemic was in full force then. What is of greater interest is that market time dropped from the first quarter of this year, indicating that conditions are very tight.
Conclusions
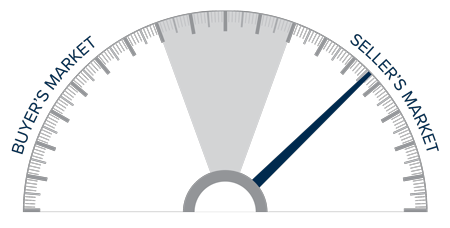
This speedometer reflects the state of the region’s real estate market using housing inventory, price gains, home sales, interest rates, and larger economic factors.
Home sales and prices were all higher than in the first quarter of 2021, while the number of homes available to buy remained significantly lower. With solid demand in place, it is staunchly a seller’s market. However, with mortgage rates likely to rise in the coming year, and affordability constraints starting to tighten all markets except perhaps San Bernadino, the pace of price growth must slow at some point.
Even with the headwinds mentioned above, I have still chosen to move the needle a little more in favor of home sellers.
About Matthew Gardner
As Chief Economist for Windermere Real Estate, Matthew Gardner is responsible for analyzing and interpreting economic data and its impact on the real estate market on both a local and national level. Matthew has over 30 years of professional experience both in the U.S. and U.K.
In addition to his day-to-day responsibilities, Matthew sits on the Washington State Governors Council of Economic Advisors; chairs the Board of Trustees at the Washington Center for Real Estate Research at the University of Washington; and is an Advisory Board Member at the Runstad Center for Real Estate Studies at the University of Washington where he also lectures in real estate economics.
")


