
 Facebook
 X
X
 Pinterest
 Copy Link
Q3 2023 Central and Southern Oregon Real Estate Market Update

The following analysis of select counties of the Central and Southern Oregon real estate market is provided by Windermere Real Estate. We hope that this information may assist you with making better-informed real estate decisions. For further information about the housing market in your area, please don’t hesitate to contact your Windermere Real Estate agent.
Regional Economic Overview
The Central and Southern Oregon counties covered by this report added 1,180 new jobs over the past 12 months, which represents an annual growth rate of .5%. Deschutes, Jefferson, and Klamath counties had solid job gains, but Jackson, Crook, and Josephine counties saw employment levels fall.
The unemployment rate across the region was 4.2%, down from 5% in the third quarter of 2022. By county, the lowest jobless rate was in Bend, where 3.7% of the labor force was jobless. The highest rate was in Crook County, where 5.4% of the labor force is still without a job.
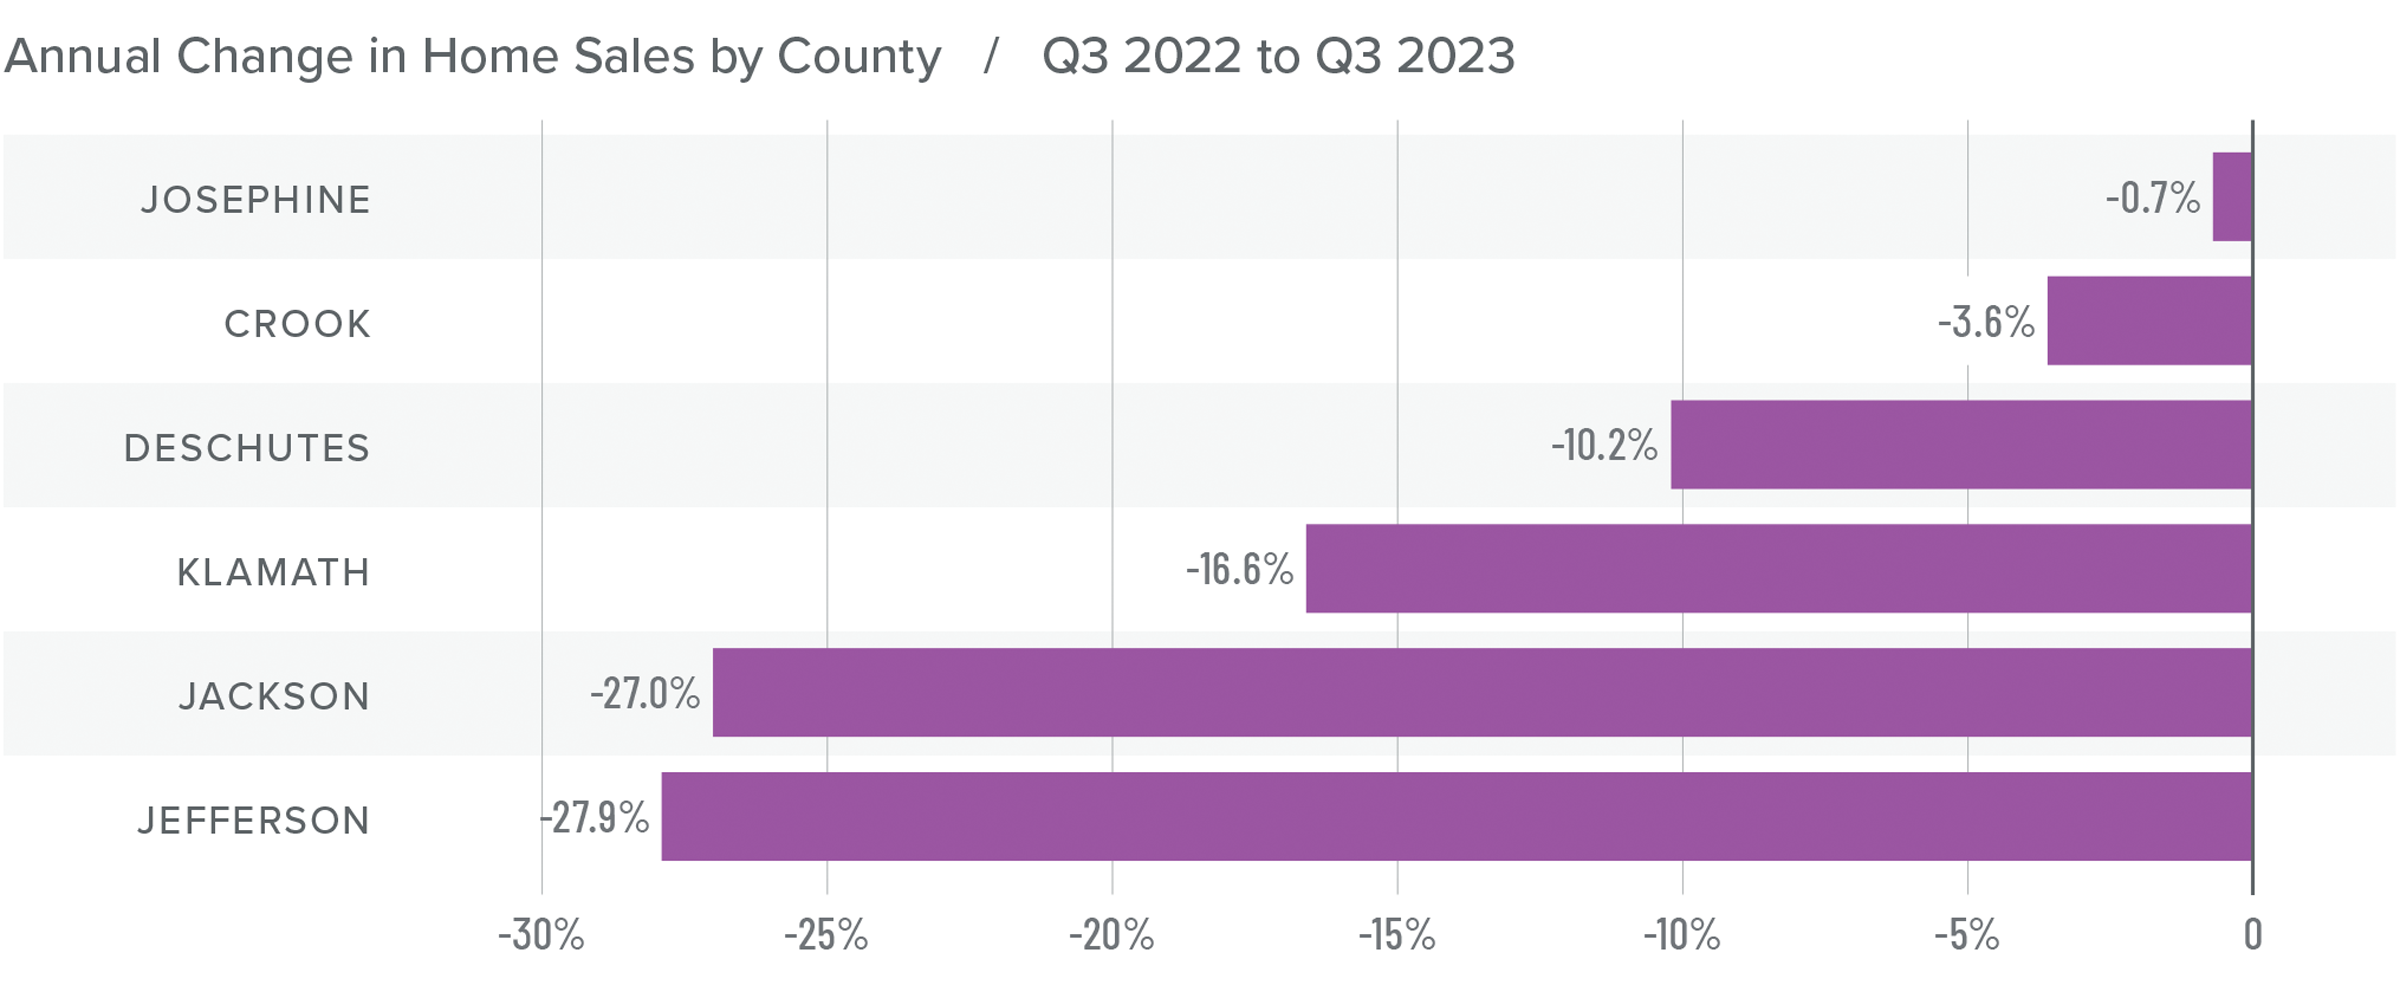
Central and Southern Oregon Home Sales
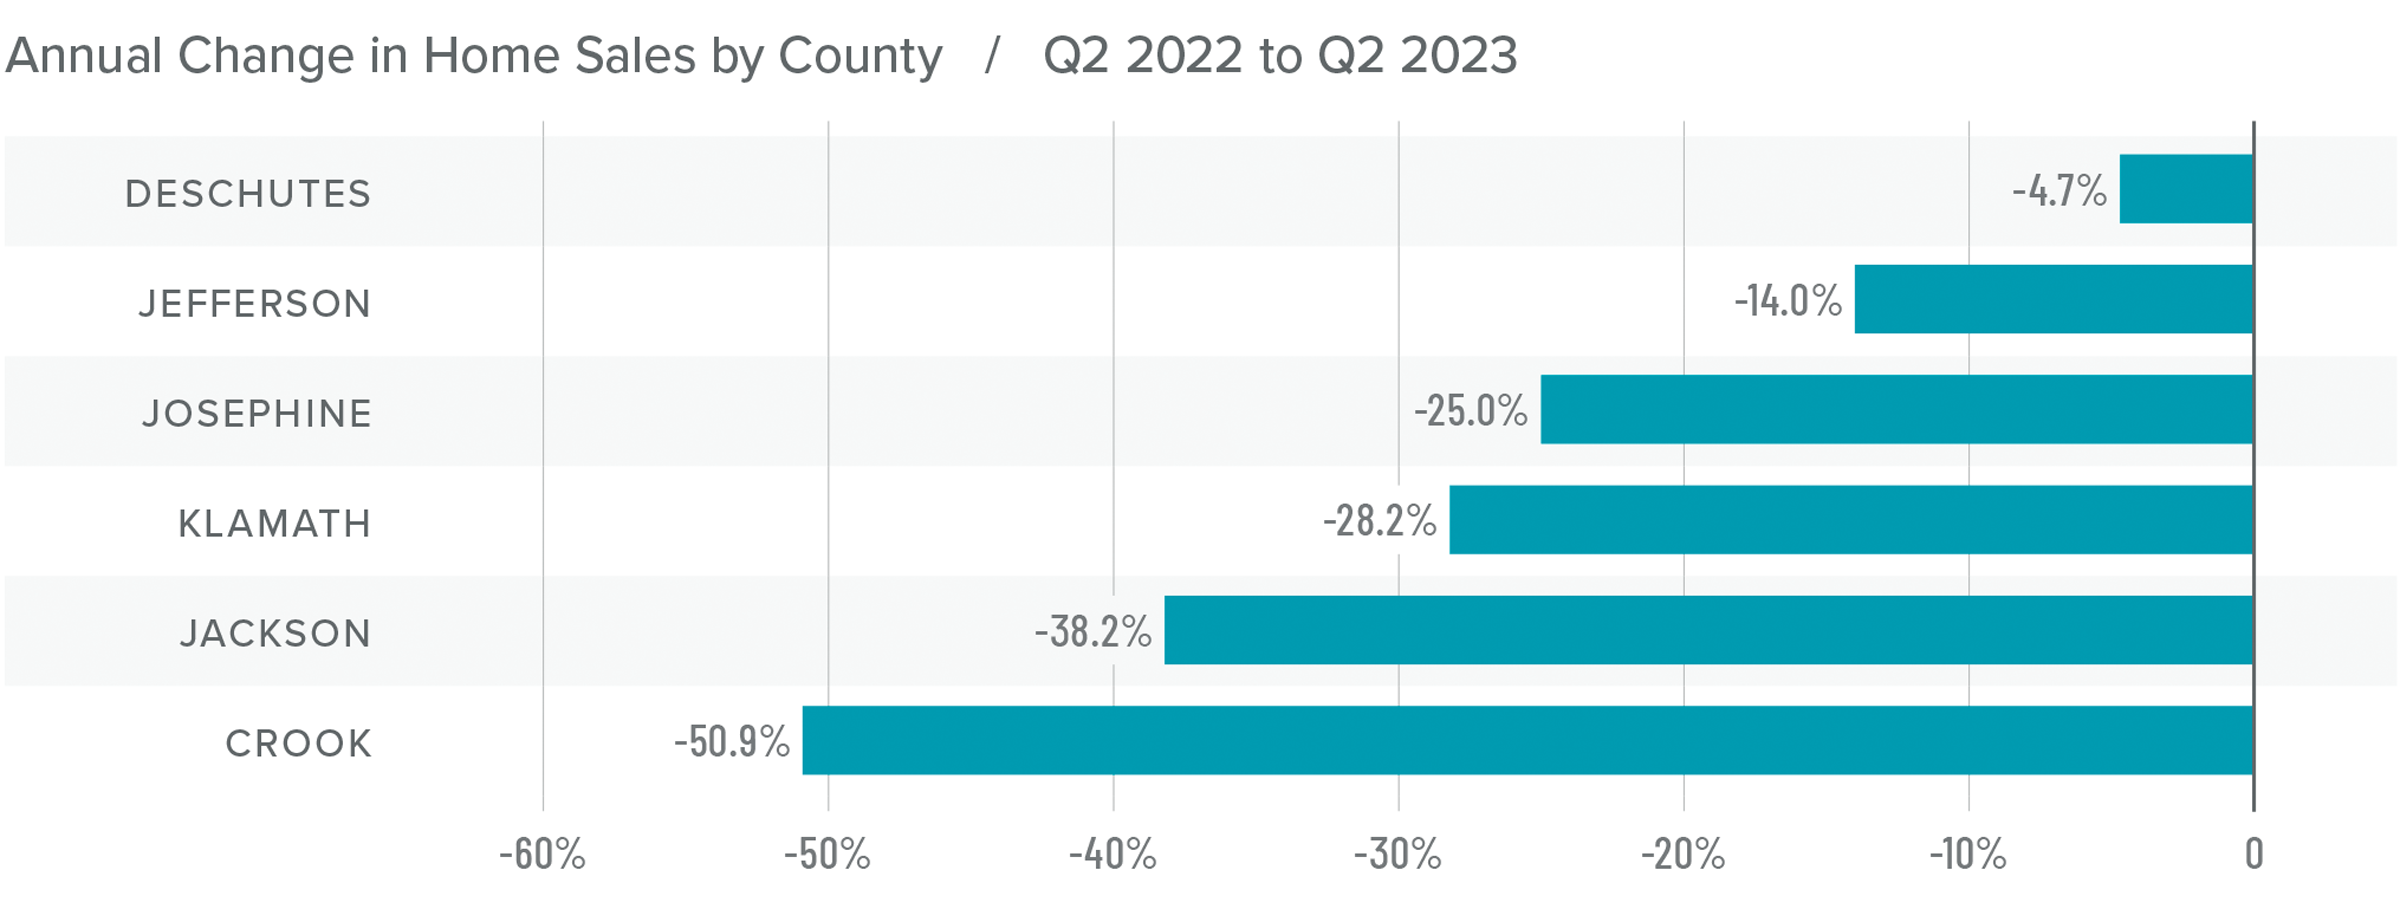
❱ In the third quarter of 2023, 2,137 homes sold, representing a drop of 15.8% compared to the same period in 2022. However, sales were 7.2% higher than in the second quarter of this year.
❱ Compared to the second quarter of 2023, sales rose in all counties other than Crook and Jefferson, where they fell 1.2% and 10.2%, respectively.
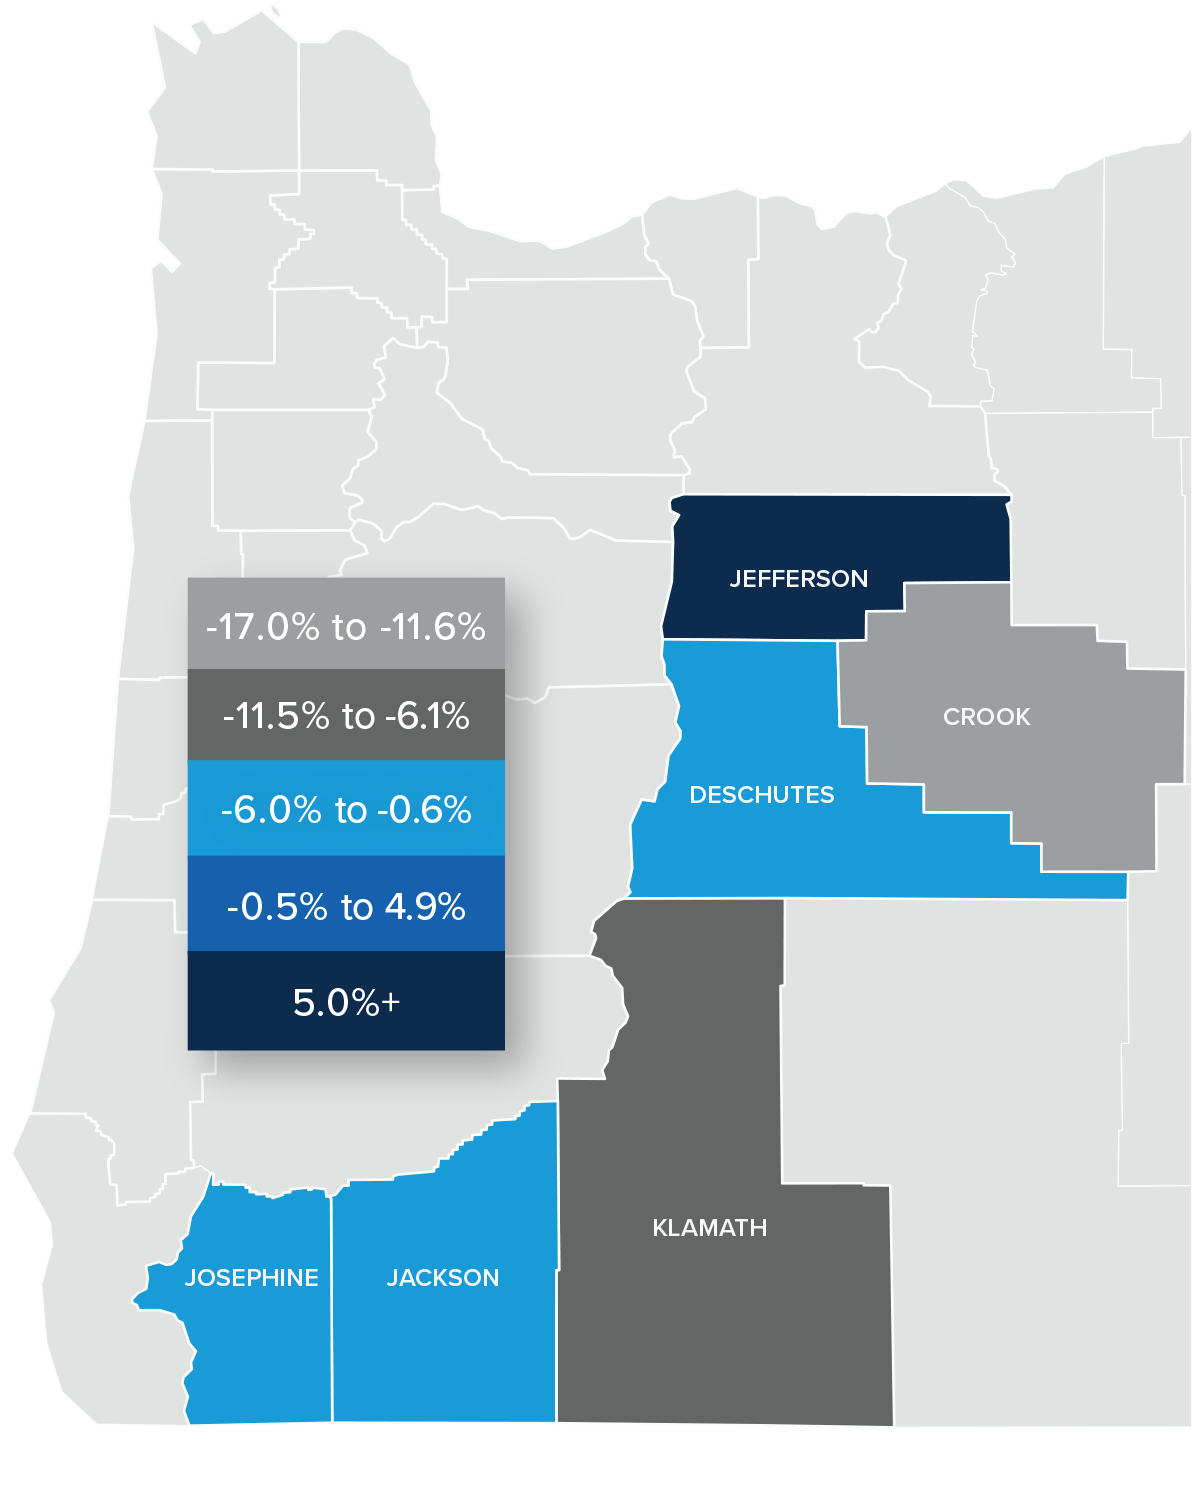
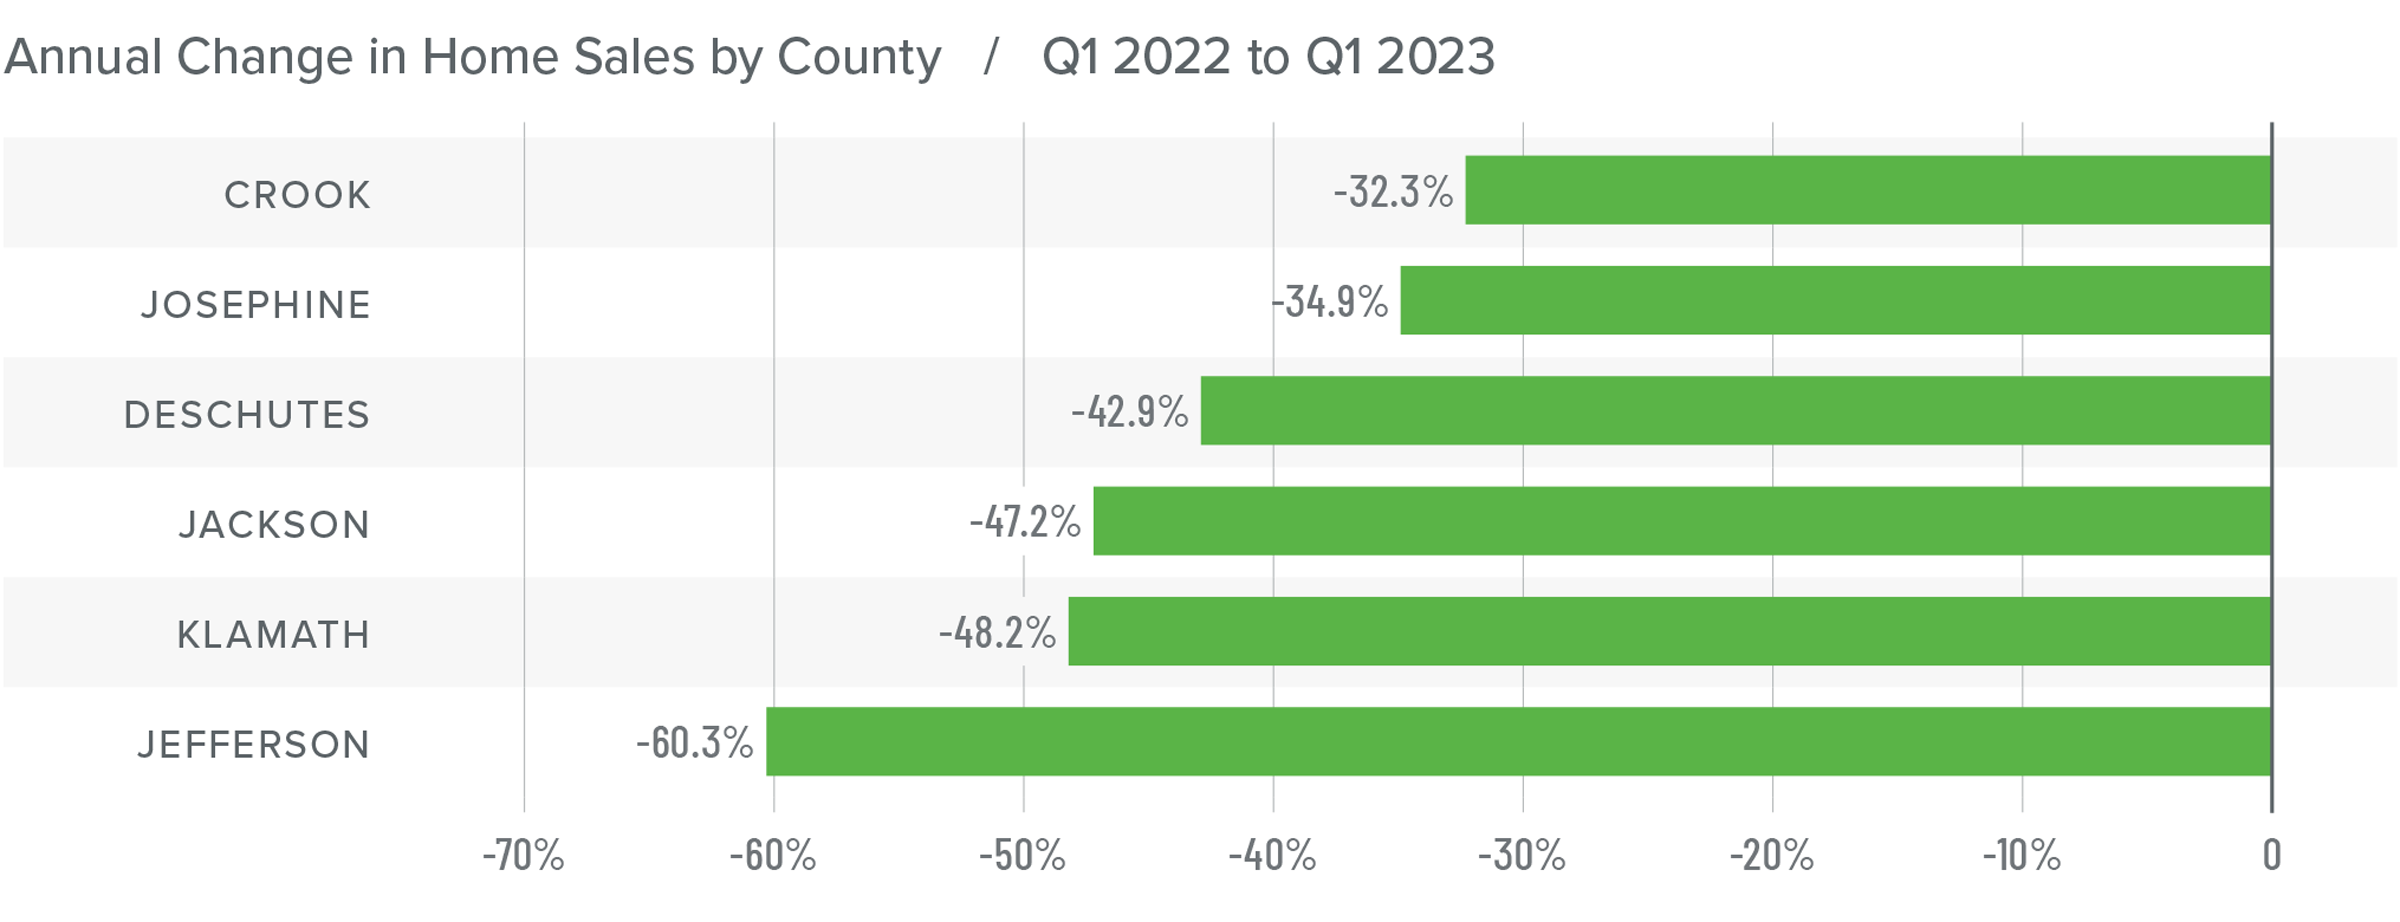
❱ Sales fell across the board in all counties compared to the third quarter of 2022, with significant declines in all markets except Crook and Josephine counties.
❱ A possible explanation for the growth in sales between the second and third quarters could be that buyers saw mortgage rates starting to rise, which spurred sales. Given that we do not expect rates to fall in the fourth quarter, it will be interesting to see if sales continue to grow.
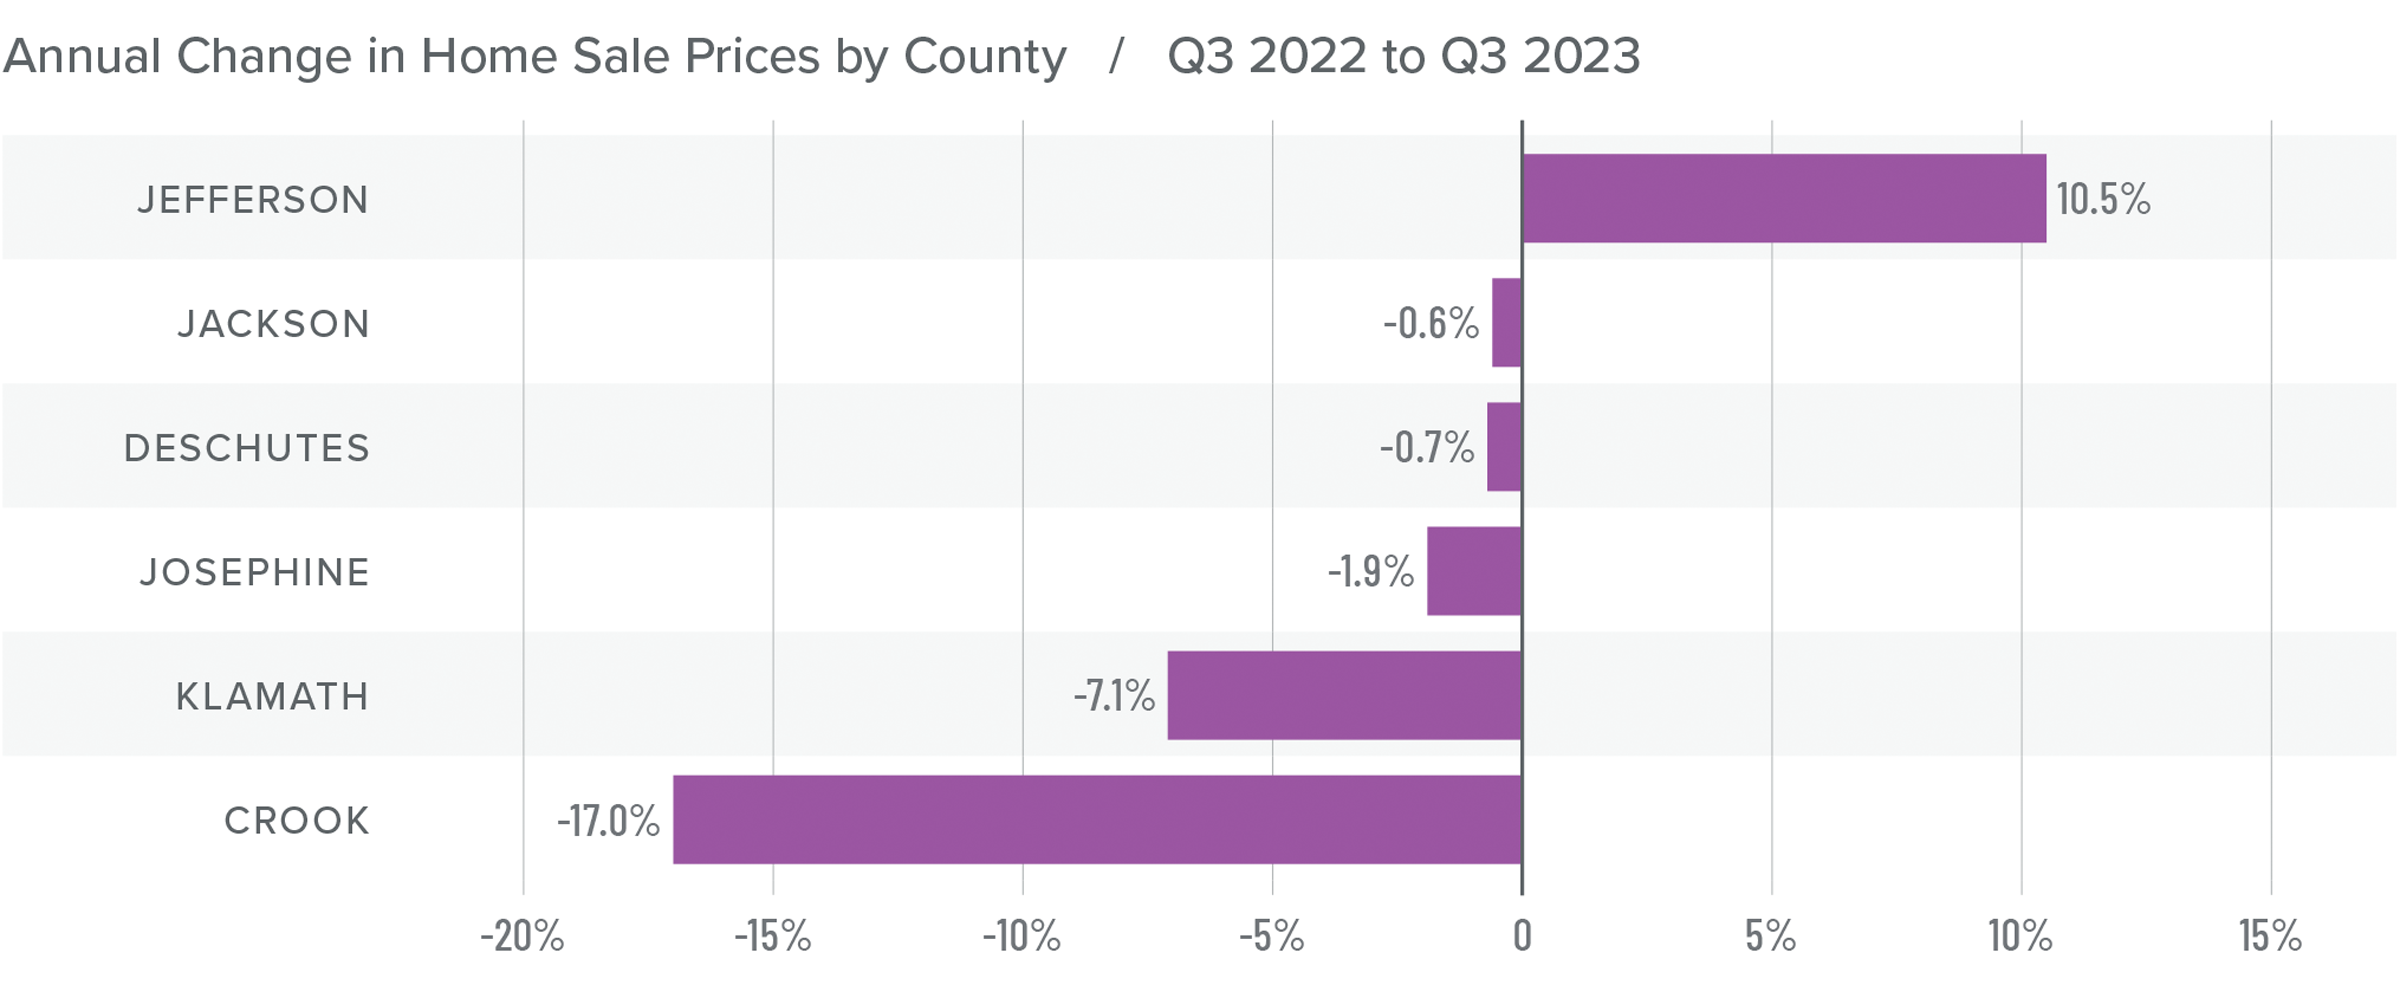
Central and Southern Oregon Home Prices
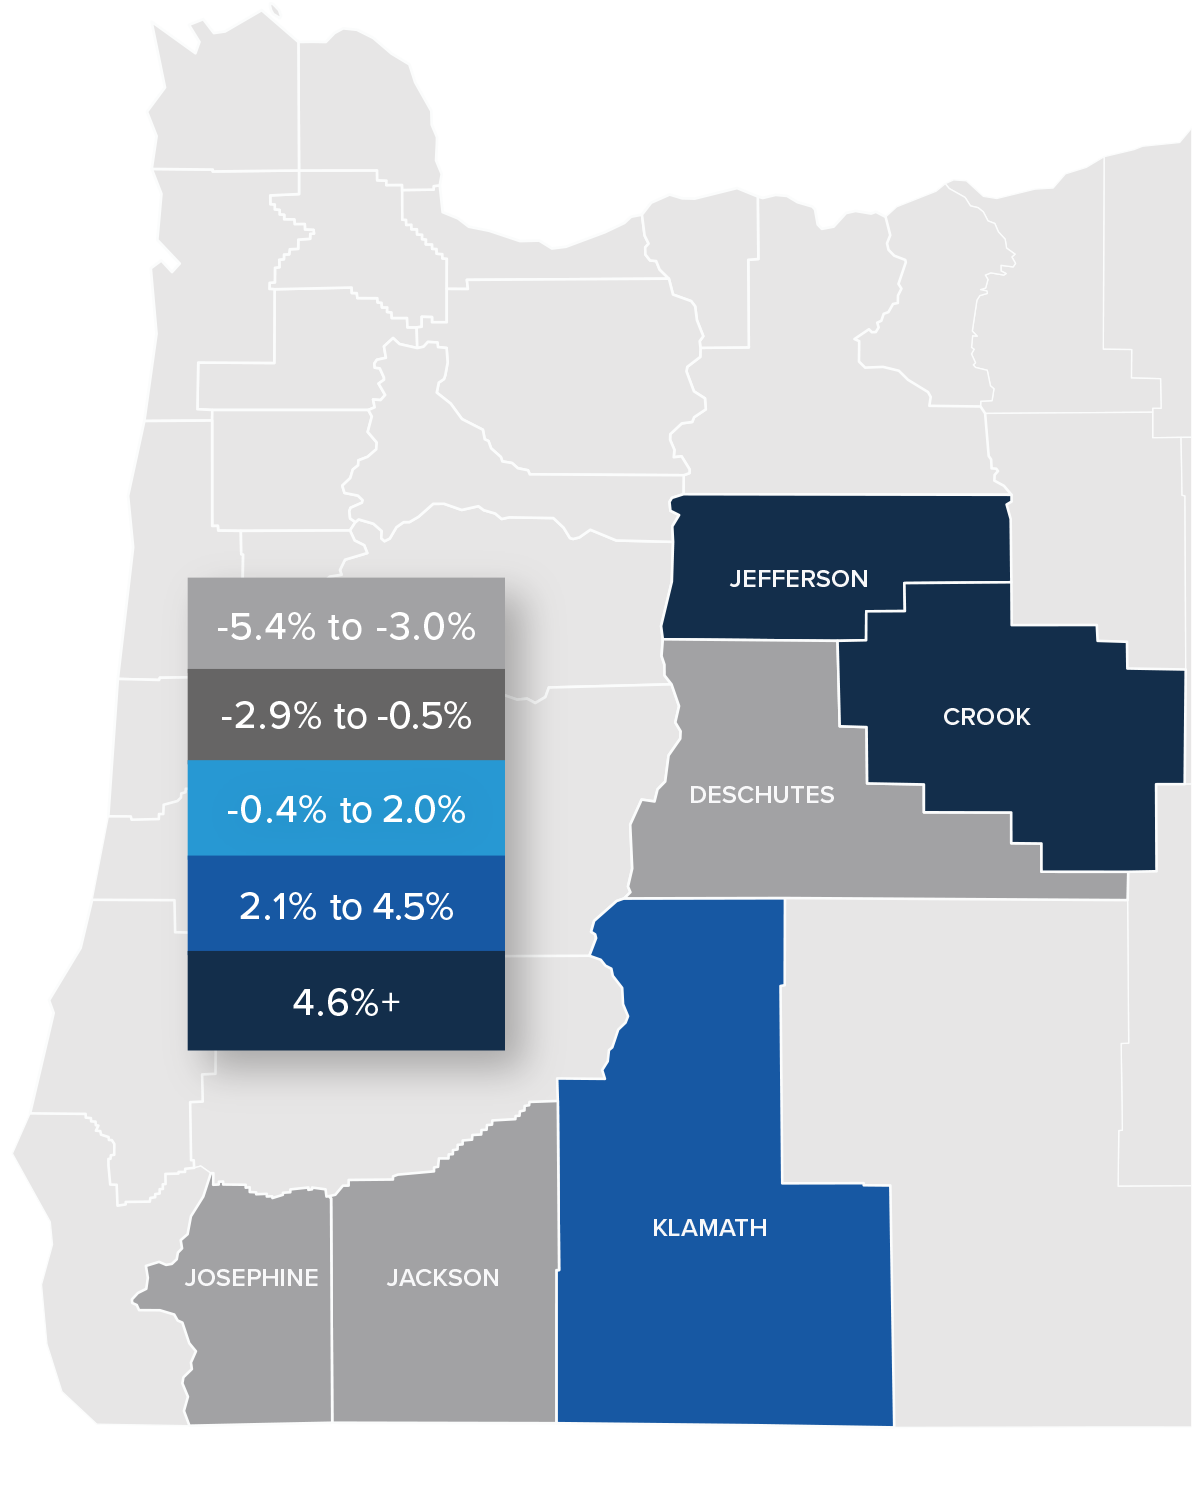
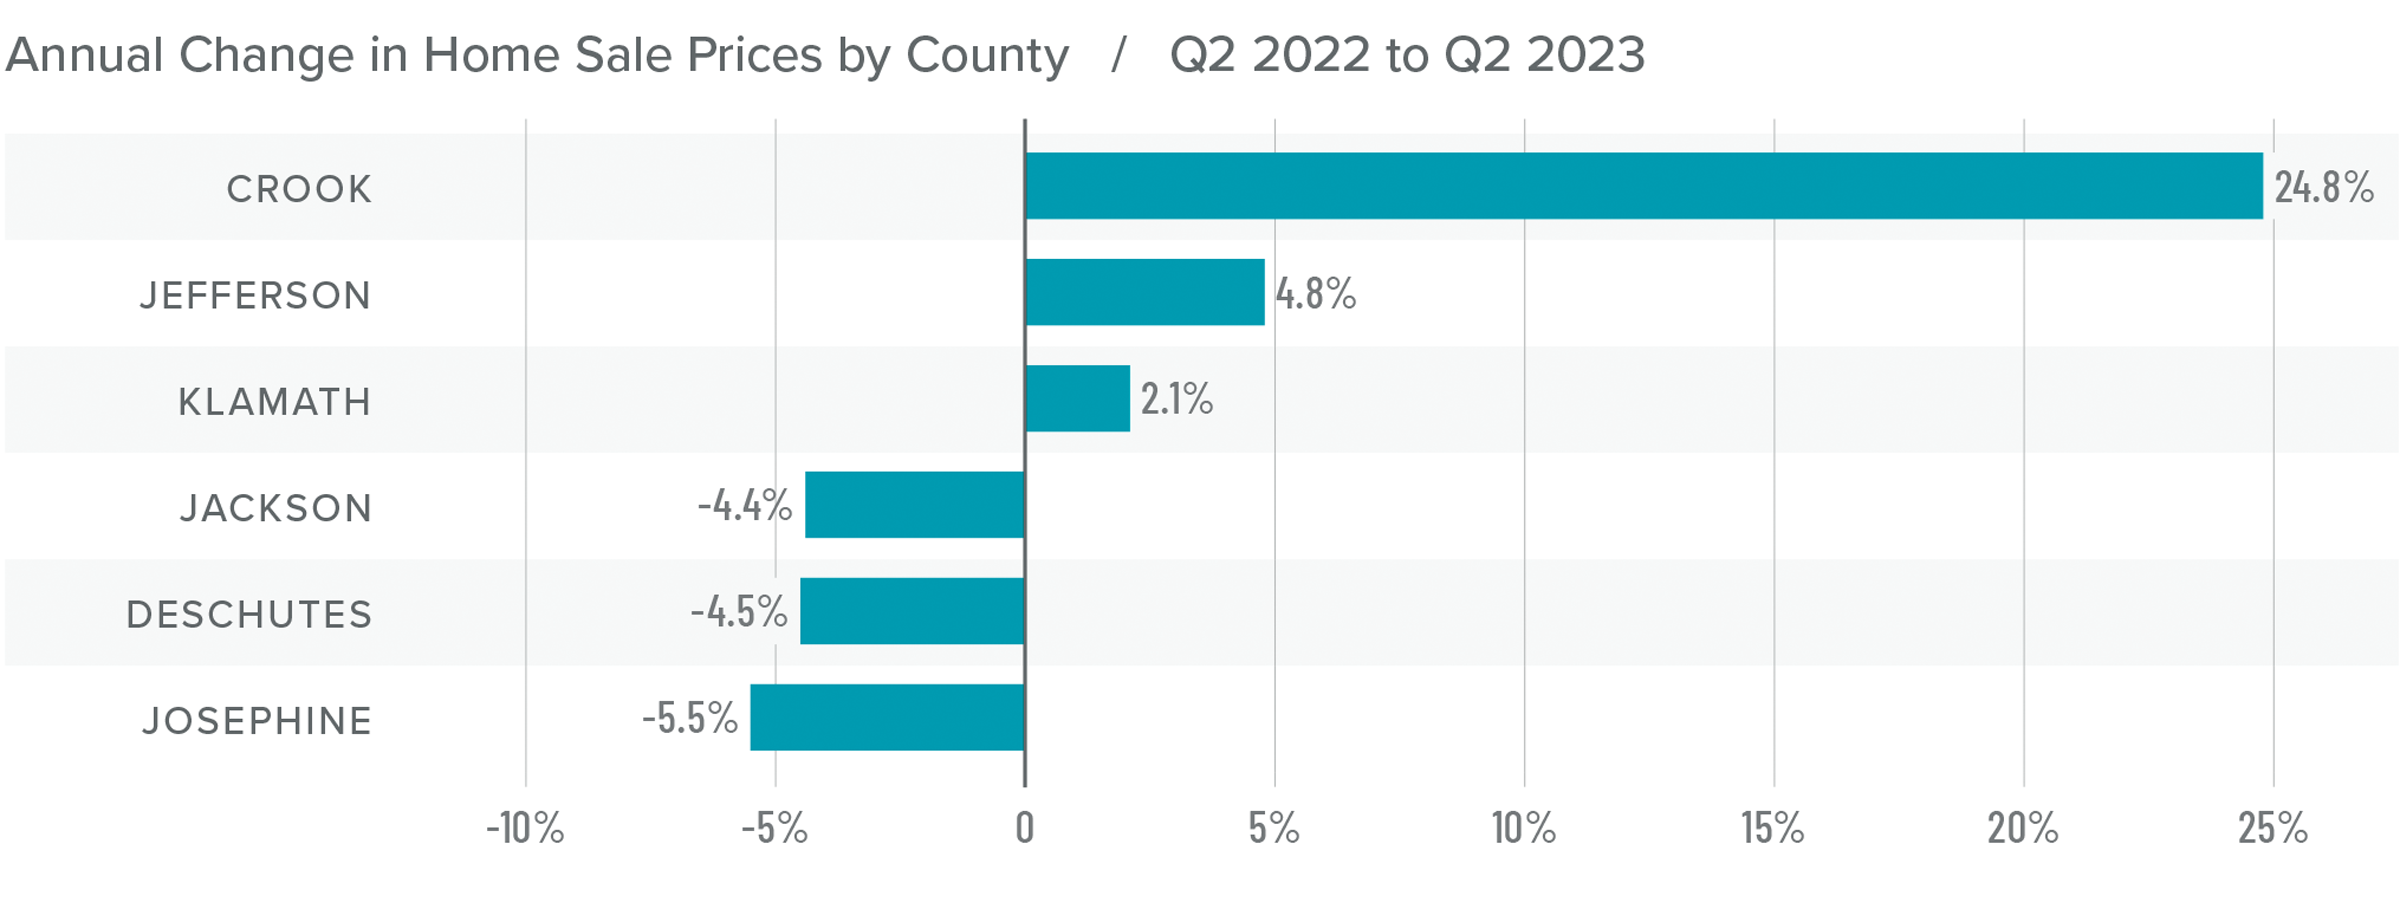
❱ The average home sale price in the region fell .4% year over year to $599,486. Prices were 1.8% higher than in the second quarter of 2023.
❱ Compared to the second quarter of this year, average prices rose in Deschutes, Jackson, Jefferson, and Josephine counties but fell in Crook and Klamath counties.
❱ Prices in every county other than Jefferson fell year over year. Crook County saw the greatest drop.
❱ The median listing price of a home rose 3.6% compared to the second quarter of this year. All markets except Jackson County raised asking prices.
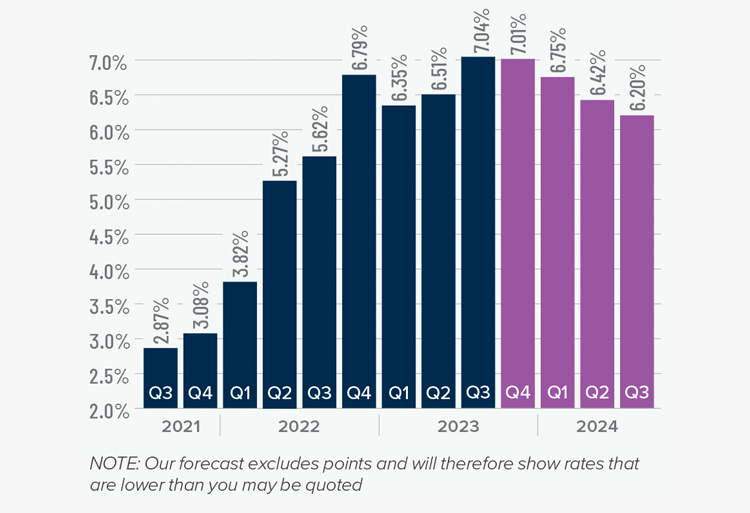
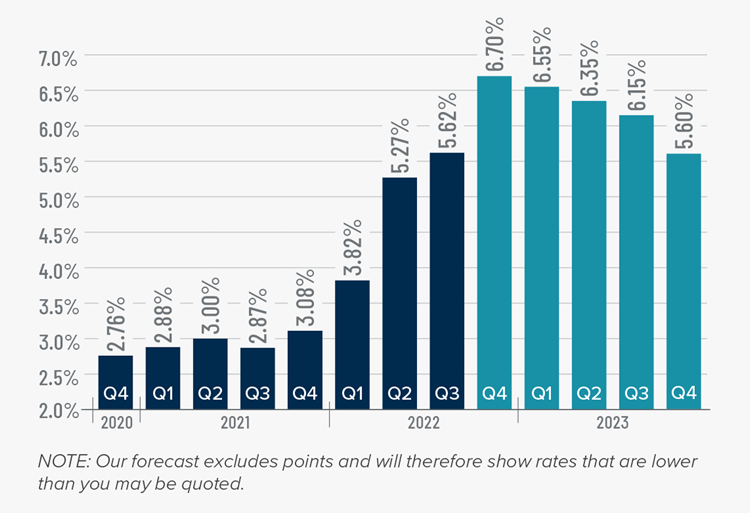
Mortgage Rates
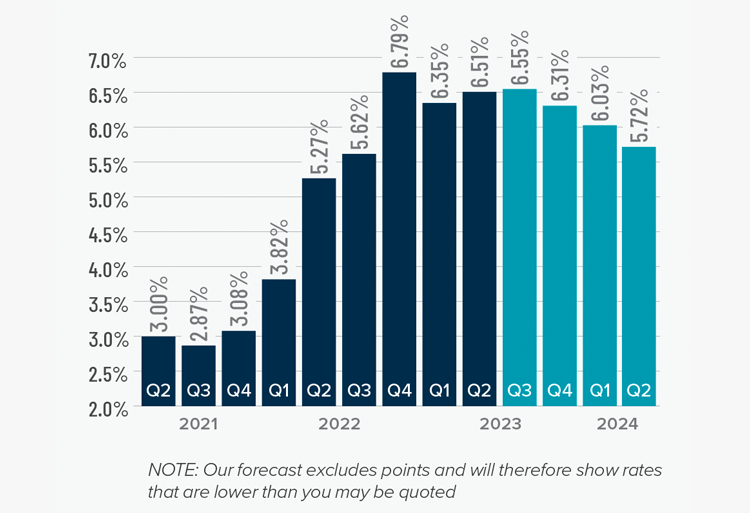
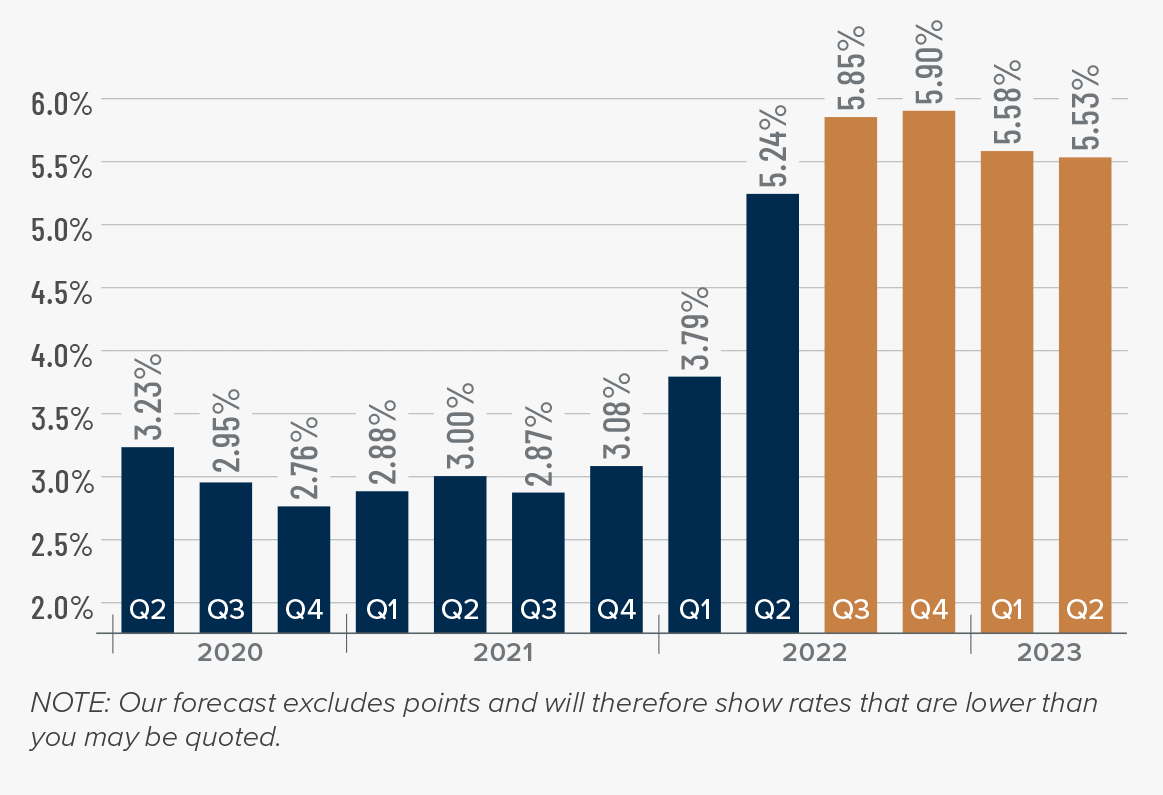
Mortgage rates continued trending higher in the third quarter of 2023 and are now at levels we have not seen since the fall of 2000. Mortgage rates are tied to the interest rate (yield) on 10-year treasuries, and they move in the opposite direction of the economy. Unfortunately for mortgage rates, the economy remains relatively buoyant, and though inflation is down significantly from its high, it is still elevated. These major factors and many minor ones are pushing Treasury yields higher, which is pushing mortgage rates up. Given the current position of the Federal Reserve, which intends to keep rates “higher for longer,” it is unlikely that home buyers will get much reprieve when it comes to borrowing costs any time soon.
With such a persistently positive economy, I have had to revise my forecast yet again. I now believe rates will hold at current levels before starting to trend down in the spring of next year.
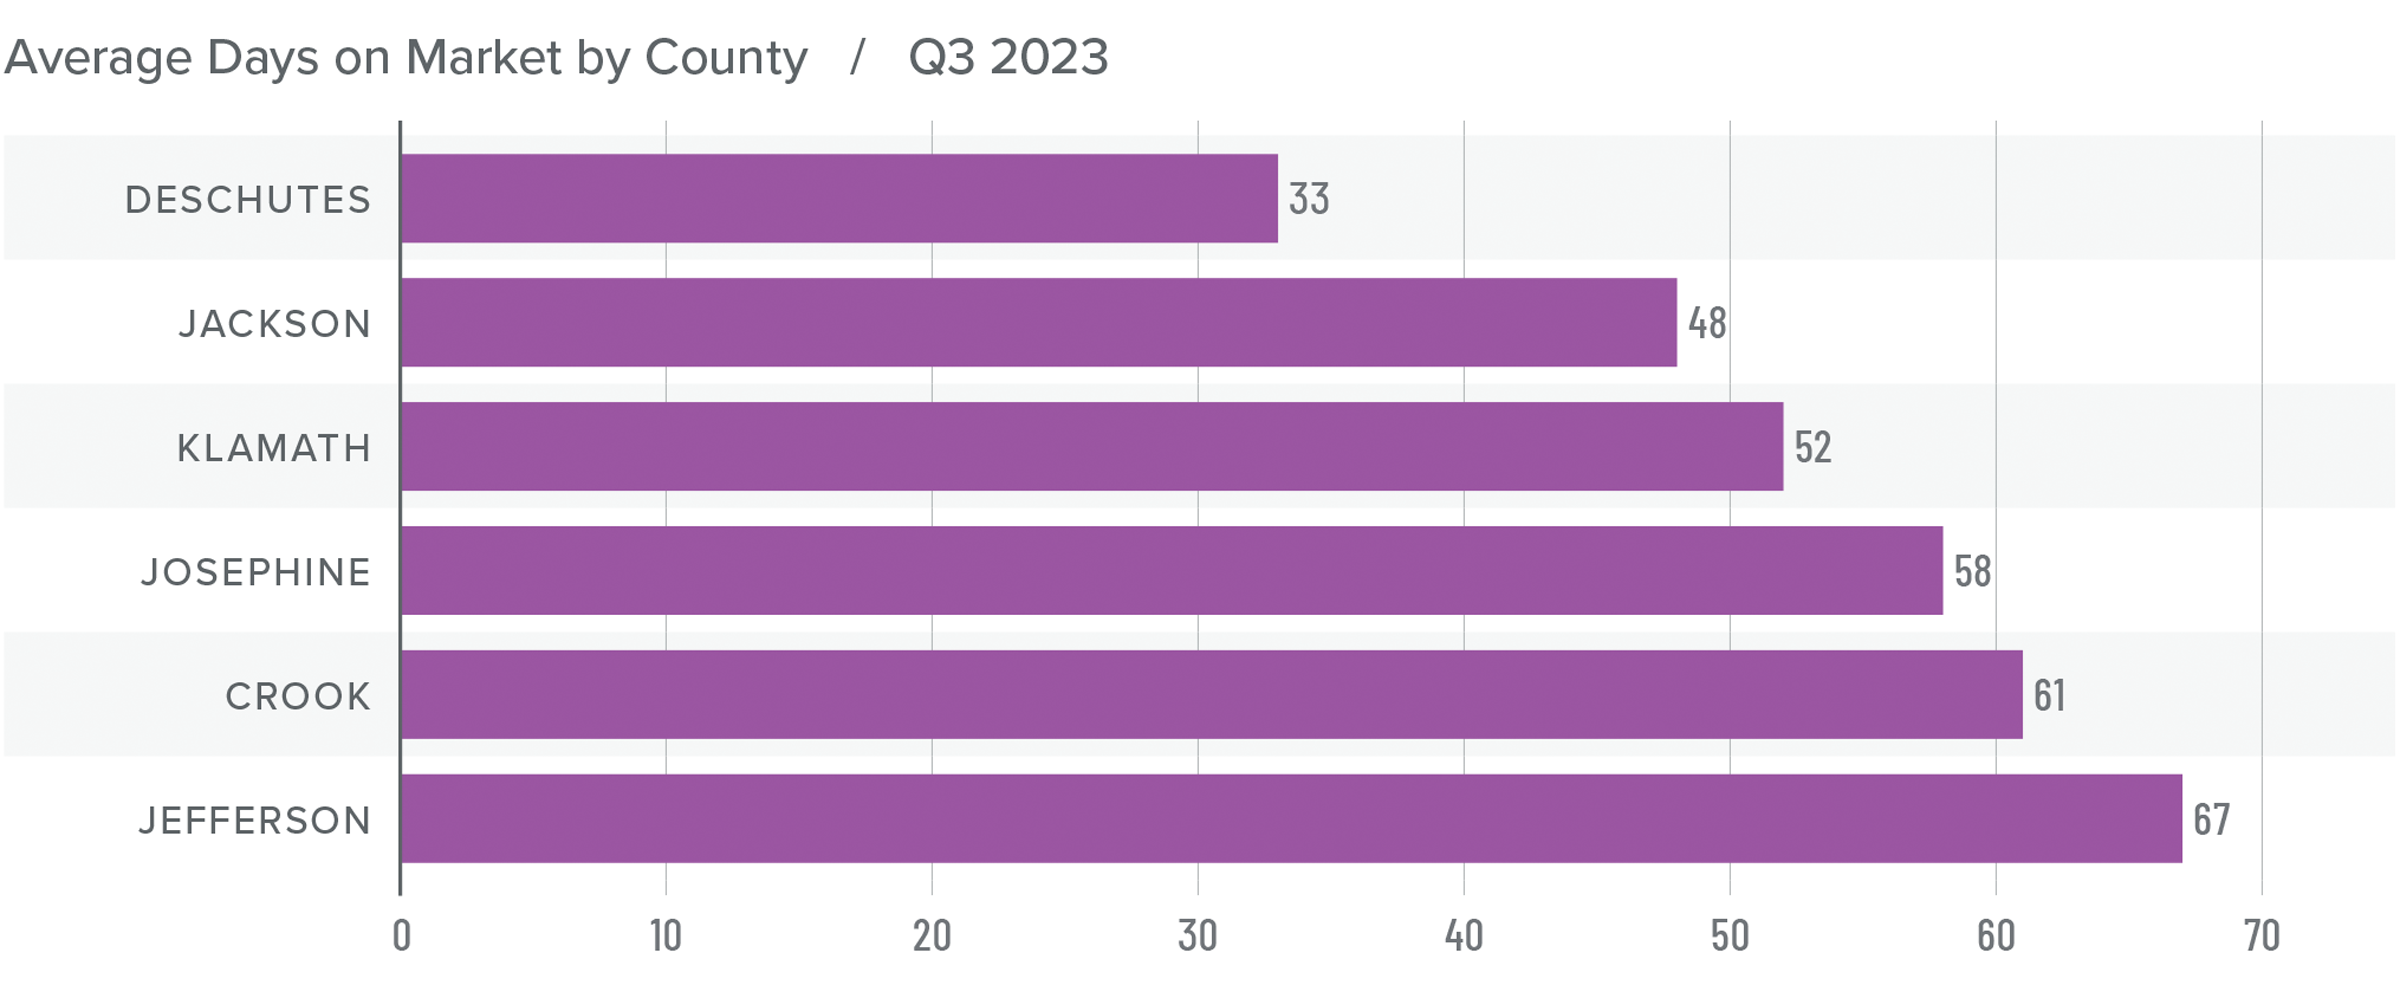
Central and Southern Oregon Days on Market
❱ The average time it took to sell a home in the region rose 21 days compared to the third quarter of 2022. Market time in the third quarter matched what we saw in the second quarter of this year.
❱ The average time it took to sell a home in the third quarter of 2023 was 53 days.
❱ All counties saw market time rise compared to the same period in 2022. Although the average days on market was static between the second and third quarters, this was due to a significant increase in market time in Jefferson County, which offset lower days on market across the balance of the region.
❱ The market appears to still be seeing demand from buyers, but this may not continue if mortgage rates stay at current levels.
Conclusions
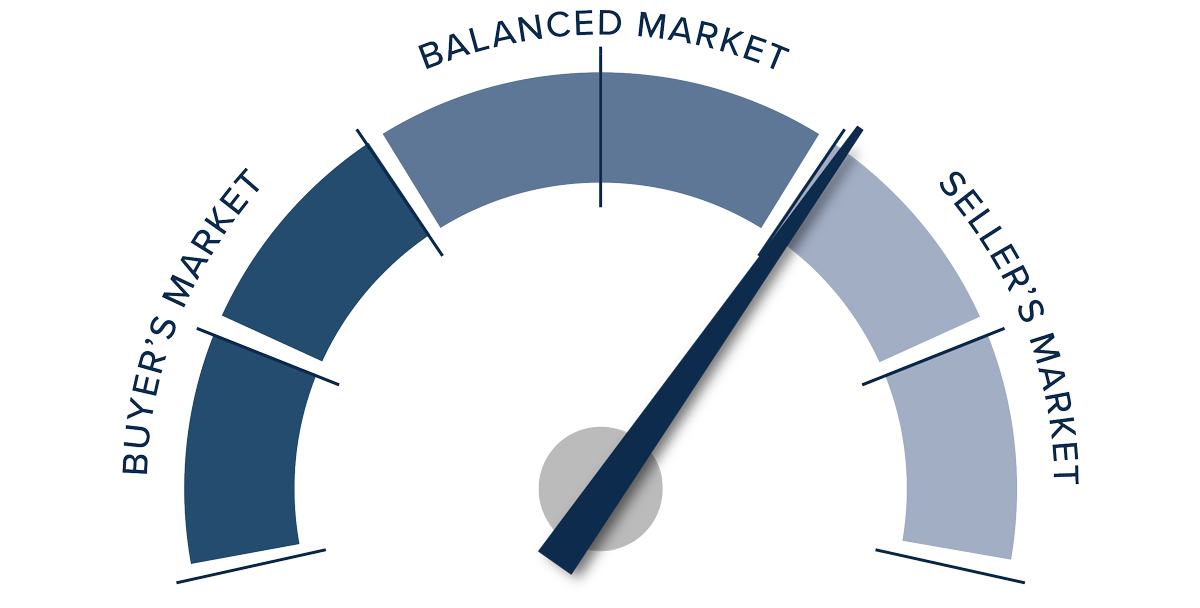
This speedometer reflects the state of the region’s real estate market using housing inventory, price gains, home sales, interest rates, and larger economic factors.
Higher sales as well as higher list and sale prices suggest that the market still favors
sellers. That said, it’s unclear whether the market can continue to allow prices to rise
much more given that mortgage rates are unlikely to fall meaningfully in the near future.

As such, the needle stays in the same position as in the second quarter: favoring sellers, but only marginally.
Q2 2023 Central and Southern Oregon Real Estate Market Update

The following analysis of select counties of the Central and Southern Oregon real estate market is provided by Windermere Real Estate Chief Economist Matthew Gardner. We hope that this information may assist you with making better-informed real estate decisions. For further information about the housing market in your area, please don’t hesitate to contact your Windermere Real Estate agent.
Regional Economic Overview
The Central and Southern Oregon counties covered by this report added 3,890 new jobs over the past 12 months, which represents an annual growth rate of 1.6%. Crook, Deschutes, and Jackson counties all had solid job gains. While Jefferson, Josephine, and Klamath added jobs, they did so at a modest rate of .2 to .5%. The unemployment rate across the region was 4.6%. This is up from a rate of 4.3% in the same period of 2022. The lowest jobless rate was in Bend, where 4% of the labor force was jobless. The highest unemployment rate was in Klamath County, where 5.8% of the labor force is still without a job.
Central and Southern Oregon Home Sales
❱ In the second quarter of 2023, 1,983 homes sold, representing a drop of 25.5% compared to the same period in 2022. However, sales were 20.1% higher than in the first quarter of the year.
❱ Compared to the first quarter of 2023, sales rose significantly in all counties.
❱ Sales fell across the board compared to the second quarter of 2022, with significant declines in all markets except Bend.
❱ Higher sales can be mainly attributed to higher inventory levels. All markets contained in this report saw listing activity pick up as the spring progressed.
Central and Southern Oregon Home Prices
❱ Average sale prices in the region rose 1.6% year over year to $591,581. Prices were up 11.6% compared to the first quarter of 2023.
❱ Compared to the first quarter of this year, average prices rose across the board. The Bend market showed the greatest increase, with prices up 9.5%.
❱ Three counties contained in this report saw sale prices rise year over year, while three fell. Prices in Crook County experienced a significant increase.
❱ Compared to the first quarter, median list prices rose 2.2%. All markets except Crook County saw asking prices rise.
Mortgage Rates
Although they were less erratic than the first quarter, mortgage rates unfortunately trended higher and ended the quarter above 7%. This was due to the short debt ceiling impasse, as well as several economic datasets that suggested the U.S. economy was not slowing at the speed required by the Federal Reserve.
While the June employment report showed fewer jobs created than earlier in the year, as well as downward revisions to prior gains, inflation has not sufficiently slowed. Until it does, rates cannot start to trend consistently lower. With the economy not slowing as fast as expected, I have adjusted my forecast: Rates will hold at current levels in third quarter and then start to trend lower through the fall. Although there are sure to be occasional spikes, my model now shows the 30-year fixed rate breaking below 6% next spring.
Central and Southern Oregon Days on Market
❱ The average time it took to sell a home in the region rose 23 days compared to the same quarter in 2022. It took 15 fewer days for a home to sell compared to the first quarter of 2023.
❱ The average time it took to sell a home in the second quarter of 2023 was 52 days.
❱ All counties saw market time rise compared to the same quarter in 2022, but it took less time for homes to sell in all counties compared to the first quarter of this year.
❱ Buyers are taking advantage of greater choice in the market, regardless of higher mortgage rates.

Conclusions
This speedometer reflects the state of the region’s real estate market using housing inventory, price gains, home sales, interest rates, and larger economic factors.
Rising sales and home prices, shorter market time, and higher list prices suggest that the tide may have turned, especially following the very unimpressive data we saw in the first quarter of the year. With an uptick in inventory, I was happy to see sales rise even when faced with higher mortgage rates. The question going forward will be whether or not home prices will continue to increase with higher financing costs in place.
For the time being, it appears as if sellers have the upper hand. As such, I have moved the needle to show a market that is in their favor, but certainly not as much as it was in 2021 and early 2022.
About Matthew Gardner

As Chief Economist for Windermere Real Estate, Matthew Gardner is responsible for analyzing and interpreting economic data and its impact on the real estate market on both a local and national level. Matthew has over 30 years of professional experience both in the U.S. and U.K.
In addition to his day-to-day responsibilities, Matthew sits on the Washington State Governors Council of Economic Advisors; chairs the Board of Trustees at the Washington Center for Real Estate Research at the University of Washington; and is an Advisory Board Member at the Runstad Center for Real Estate Studies at the University of Washington where he also lectures in real estate economics.
Q1 2023 Central and Southern Oregon Real Estate Market Update

The following analysis of select counties of the Central and Southern Oregon real estate market is provided by Windermere Real Estate Chief Economist Matthew Gardner. We hope that this information may assist you with making better-informed real estate decisions. For further information about the housing market in your area, please don’t hesitate to contact your Windermere Real Estate agent.
Regional Economic Overview
The Central and Southern Oregon counties covered by this report continue to add jobs at a decent pace. Employment levels are now 3,860 higher than before the pandemic. The Medford metro area continues to lag, but the area is short by just 760 jobs. The only other county that has not recovered all the jobs lost due to COVID is Jefferson County, though it is only short by 20 jobs. The unemployment rate across the region was 5.3%. This is up from 4.5% in the first quarter of 2022, as the number of unemployed people has been rising. By county, the lowest jobless rate was in Bend (4.4%) and the highest was in Klamath County, where 6.6% of the labor force is still without a job.
Central and Southern Oregon Home Sales
❱ In the first quarter of 2023, 1,344 homes sold, representing a drop of 44% compared to the same period in 2022. Sales were 24.1% lower than in the fourth quarter of last year.
❱ Compared to the fourth quarter of 2022, sales fell in all counties except Crook County, where sales rose 8.3%.
❱ Sales fell across the board compared to the first quarter of 2022, with significant declines in all markets.
❱ Declining sales can mostly be attributed to lower inventory levels, uncertainty regarding the direction of mortgage rates, and lower affordability.
Central and Southern Oregon Home Prices
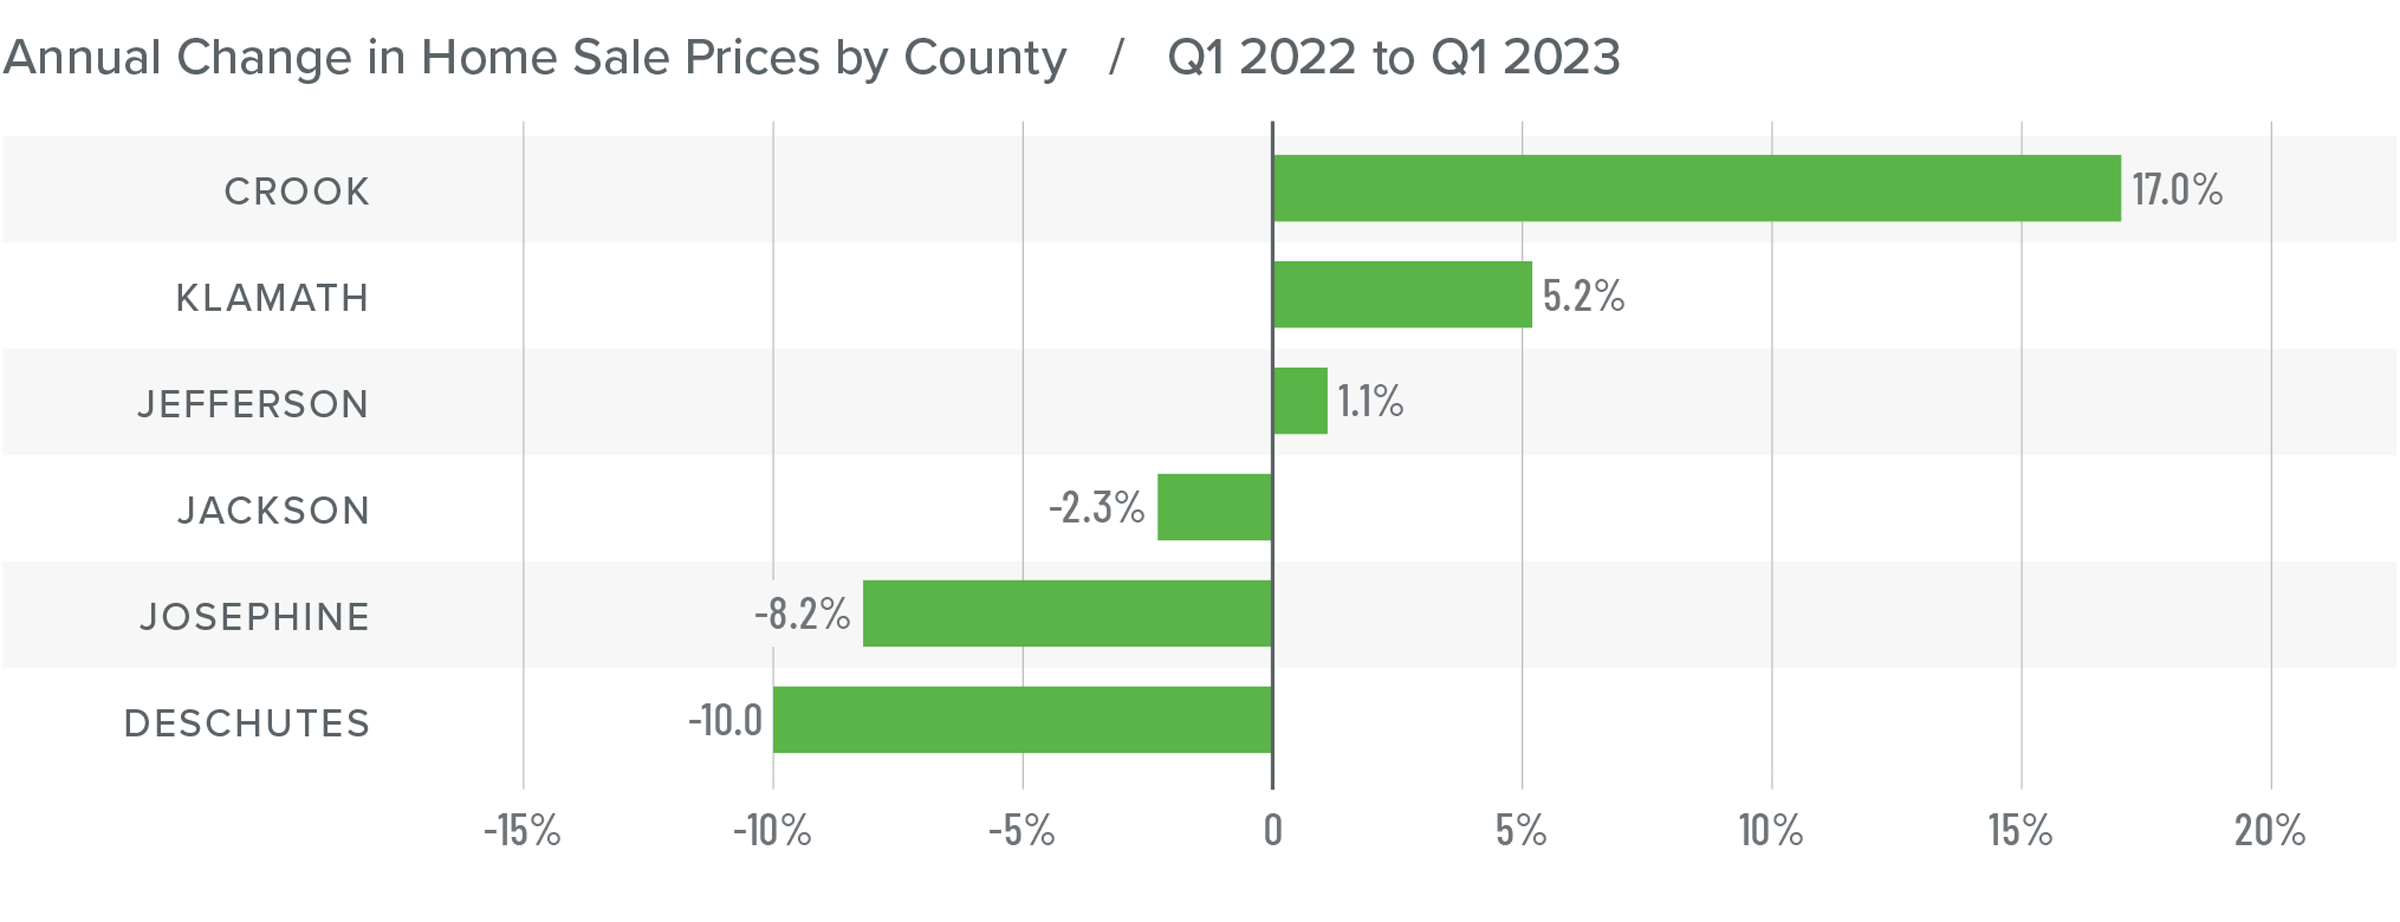
❱ The average home price in the region fell 5% year over year to $549,850. Prices were down .3% compared to the fourth quarter of 2022.
❱ Compared to the final quarter of 2022, home prices rose in Crook and Jackson counties, but fell in the rest of the market areas.
❱ Home prices rose in three counties year over year, while they fell in three. The Bend market area experienced a significant decline.
❱ Median listing prices rose in Crook, Deschutes, Jackson, and Klamath counties, but fell in the other two counties compared to the fourth quarter of 2022. It appears the overall market has not found equilibrium yet.
Mortgage Rates
Rates in the first quarter of 2023 were far less volatile than last year, even with the brief but significant impact of early March’s banking crisis. It appears that buyers are jumping in when rates dip, which was the case in mid-January and again in early February.
Even with the March Consumer Price Index report showing inflation slowing, I still expect the Federal Reserve to raise short-term rates one more time following their May meeting before pausing rate increases. This should be the catalyst that allows mortgage rates to start trending lower at a more consistent pace than we have seen so far this year. My current forecast is that rates will continue to move lower with occasional spikes, and that they will hold below 6% in the second half of this year.
Central and Southern Oregon Days on Market
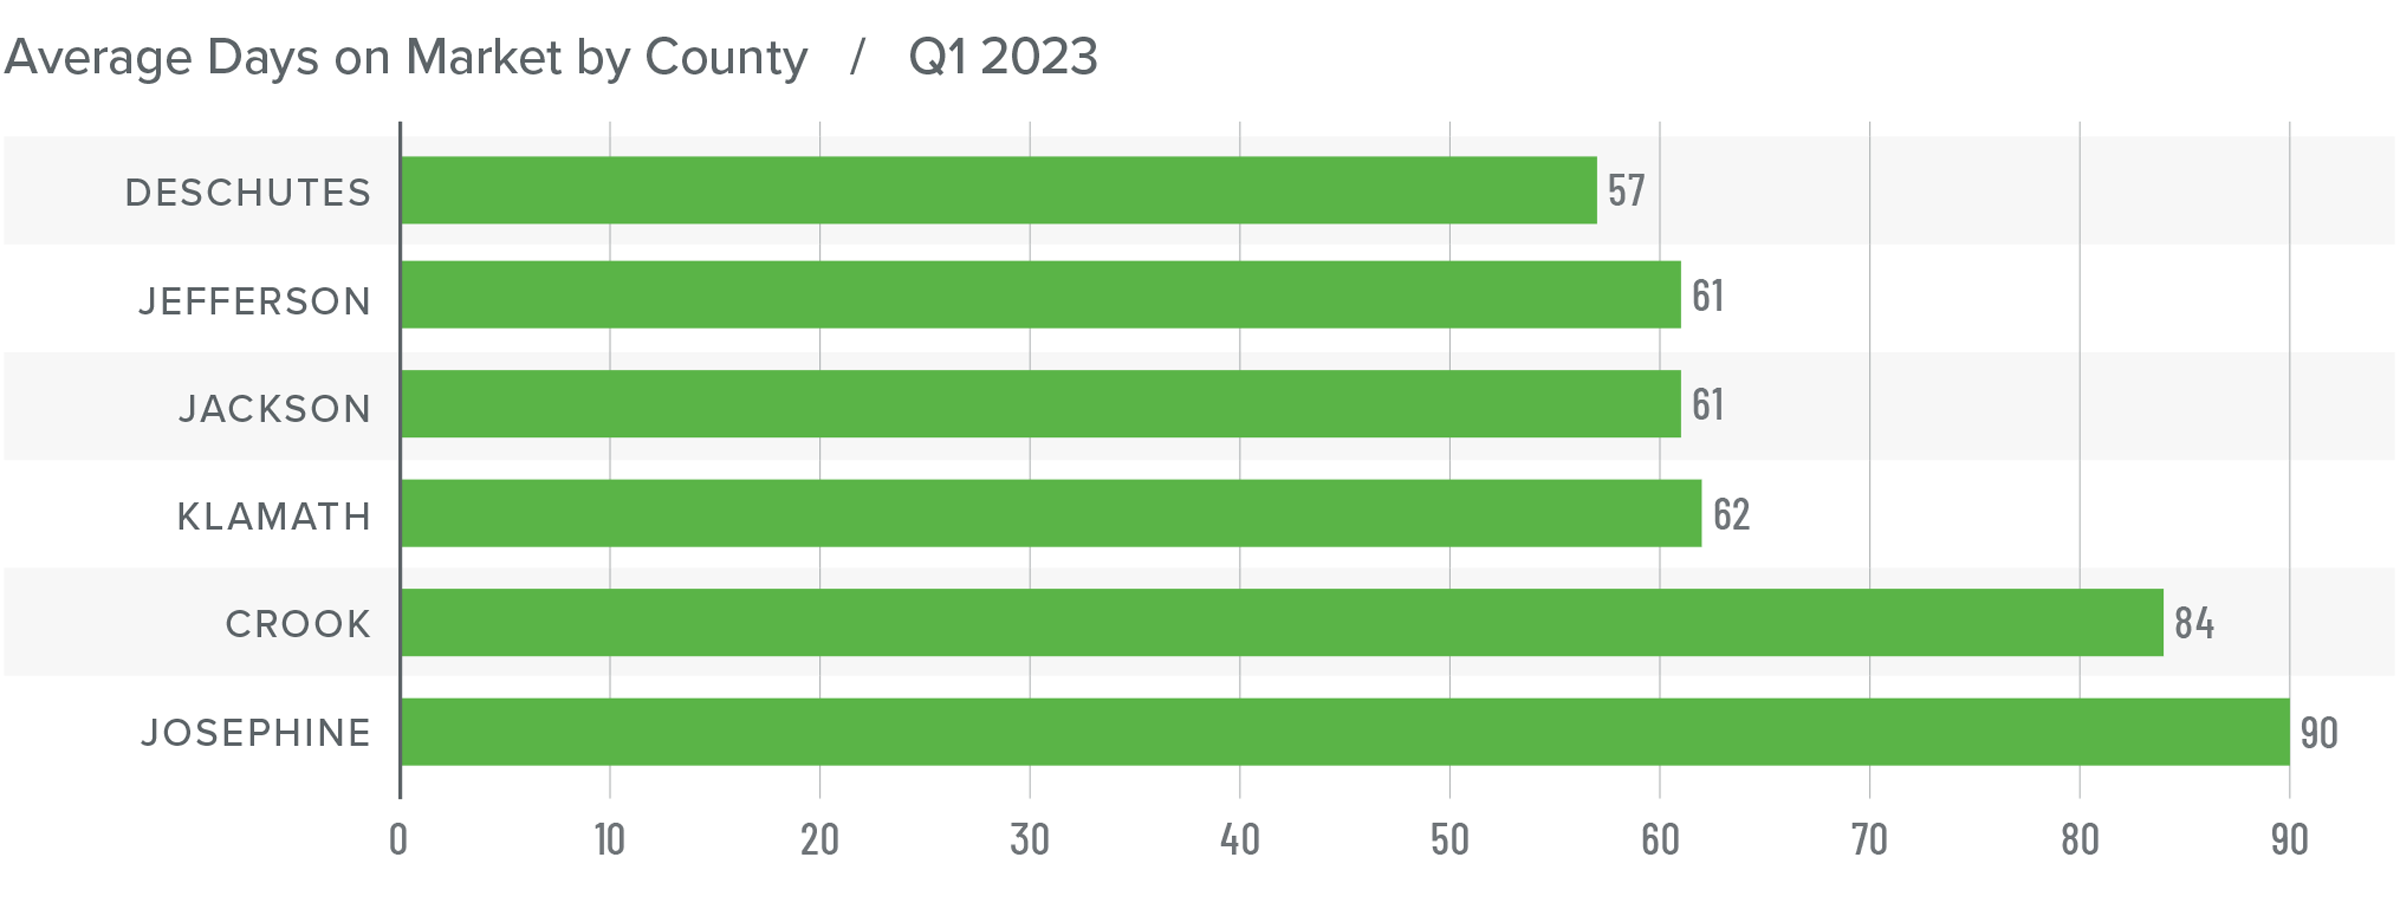
❱ The average time it took to sell a home in the region rose 29 days compared to the same quarter in 2022. It took 17 more days for a home to go under contract compared to the final quarter of 2022.
❱ The average time it took to sell a home in the first quarter of 2023 was 69 days.
❱ Market time rose in all counties compared to the first quarter of 2022. It took more time for homes to sell in all counties other than Jefferson compared to the fourth quarter of 2022.
❱ Buyers are being far more selective and continue to take their time making an offer on a home.
Conclusions
This speedometer reflects the state of the region’s real estate market using housing inventory, price gains, home sales, interest rates, and larger economic factors.
Lower sales, longer market time, and lower listing and home sale prices tell me that buyers currently have the upper hand. As such, sellers have had to adjust to market conditions they haven’t seen in several years. That said, prices have pulled back a fair amount over the past two quarters. If mortgage rates approach the 6% level in the late spring/early summer months, it’s quite possible that the housing market will stabilize and home prices will start to rise again.
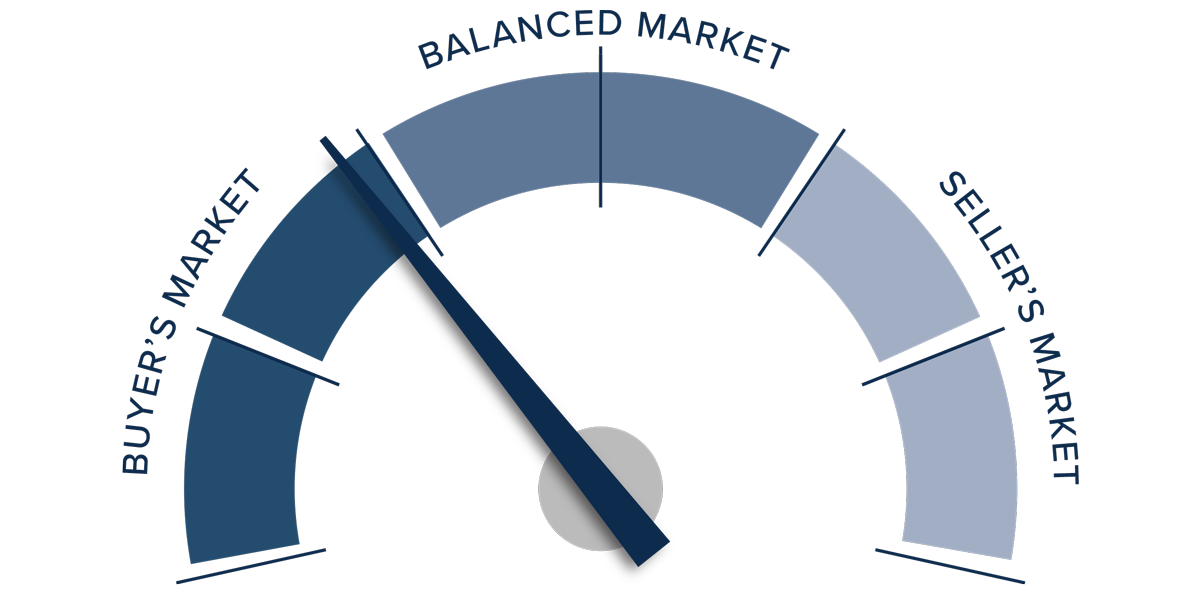
Given all the data contained in this report, I have decided that the market now favors home buyers. However, as I mention above, if stability is found, the needle will certainly move back toward sellers.
About Matthew Gardner
As Chief Economist for Windermere Real Estate, Matthew Gardner is responsible for analyzing and interpreting economic data and its impact on the real estate market on both a local and national level. Matthew has over 30 years of professional experience both in the U.S. and U.K.
In addition to his day-to-day responsibilities, Matthew sits on the Washington State Governors Council of Economic Advisors; chairs the Board of Trustees at the Washington Center for Real Estate Research at the University of Washington; and is an Advisory Board Member at the Runstad Center for Real Estate Studies at the University of Washington where he also lectures in real estate economics.
Q4 2022 Central and Southern Oregon Real Estate Market Update

The following analysis of select counties of the Central and Southern Oregon real estate market is provided by Windermere Real Estate Chief Economist Matthew Gardner. We hope that this information may assist you with making better-informed real estate decisions. For further information about the housing market in your area, please don’t hesitate to contact your Windermere Real Estate agent.
Regional Economic Overview
The Central and Southern Oregon areas covered by this report have now recovered all of the jobs that were shed due to the pandemic and added 720 new ones. Although the Medford metro area is still lagging, the other markets contained in this report have made up for the shortfall. The area’s unemployment rate was 4.8%, matching the level of a year ago. That said, the number of unemployed has started to trend a little higher across the board. By area, the lowest jobless rate was in Deschutes County (4.1%) and the highest was in Klamath County, where 6.1% of the labor force is still without a job.
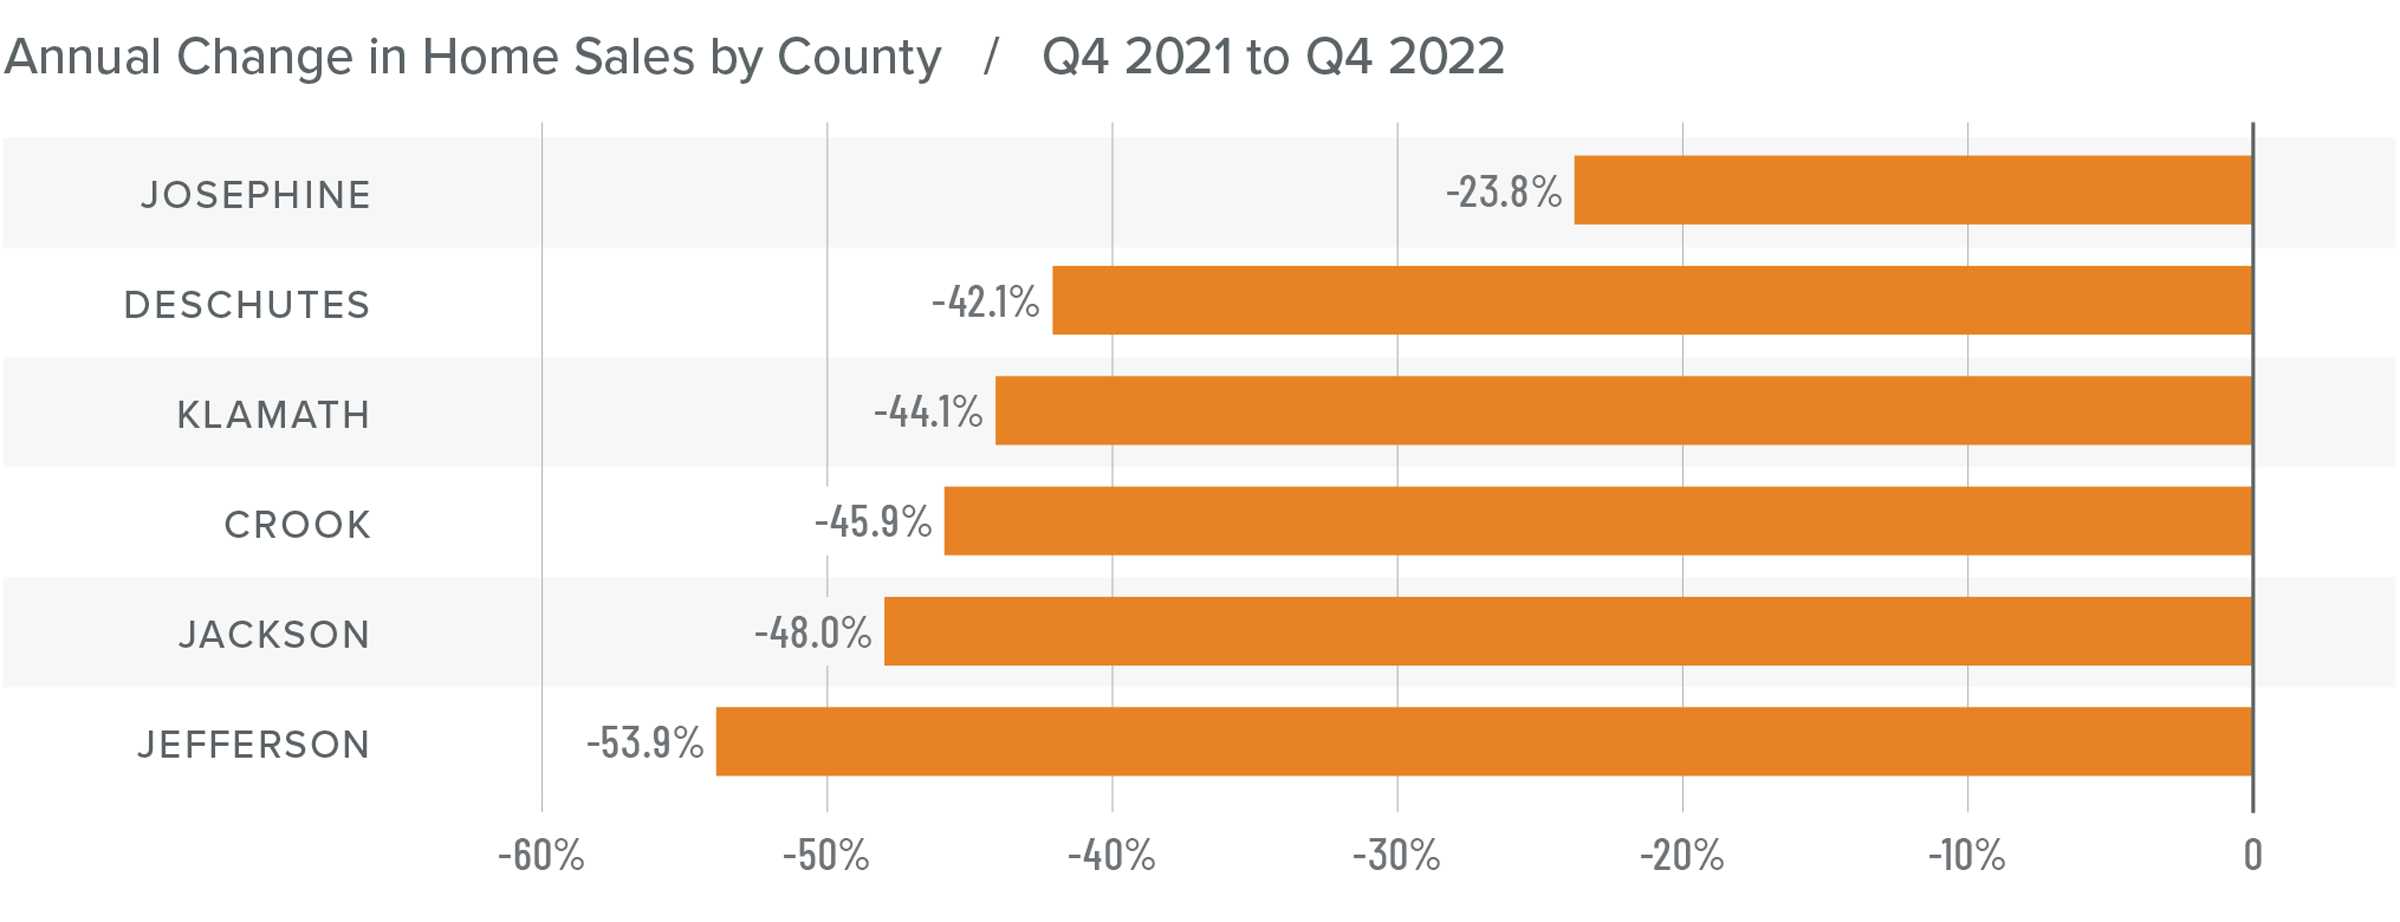
Central and Southern Oregon Home Sales
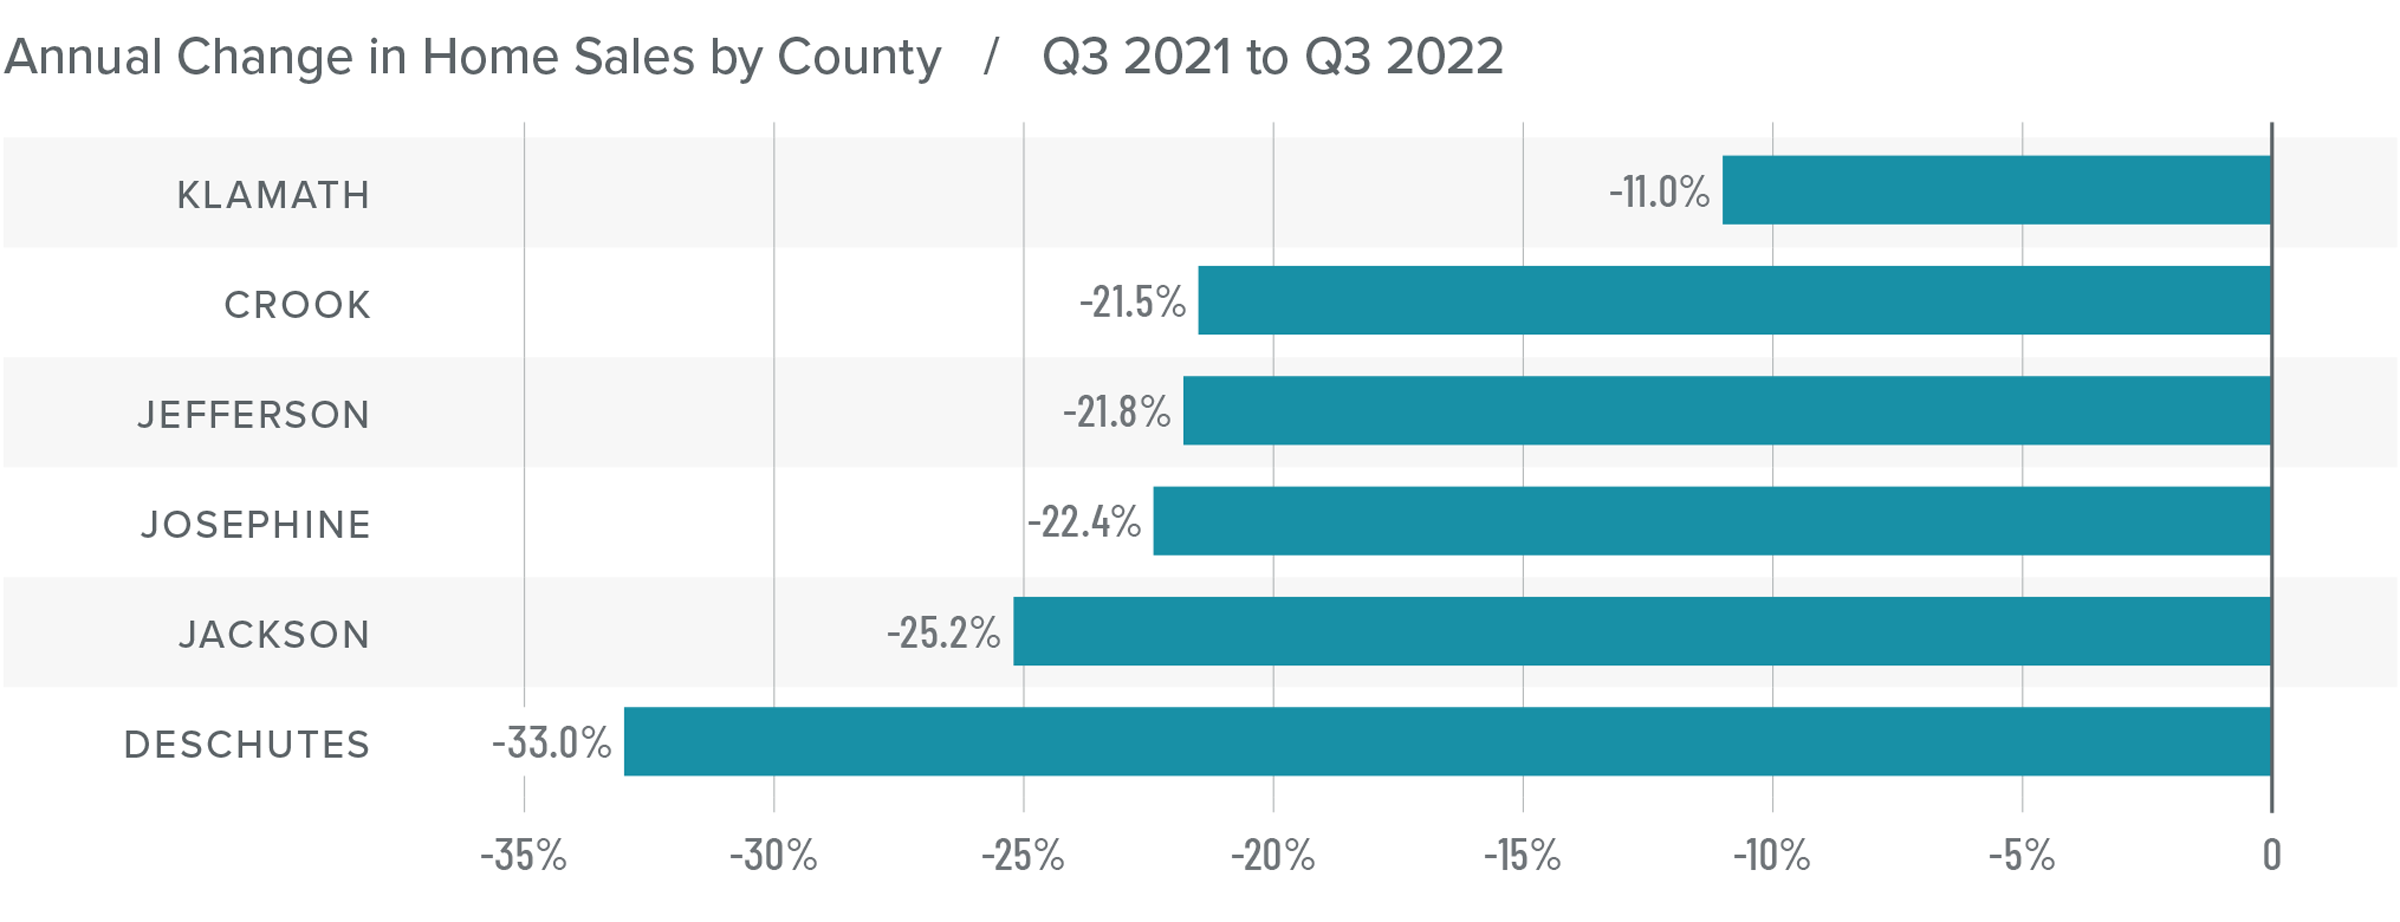
❱ In the final quarter of 2022, 1,721 homes sold, which represented a drop of more than 42% compared to the same period the prior year. Sales were 29.4% lower than in the third quarter of 2022.
❱ Home sales fell in all counties relative to the third quarter of 2022. Only Josephine County saw a decline in sales of less than 10%.
❱ Sales fell significantly in all counties compared to the fourth quarter of 2021.
❱ The reason for the drop in home sales is likely because higher inventory levels gave buyers more choice. It also appears that many buyers are waiting to make a move in the hopes that prices and mortgages will fall further in the coming months.
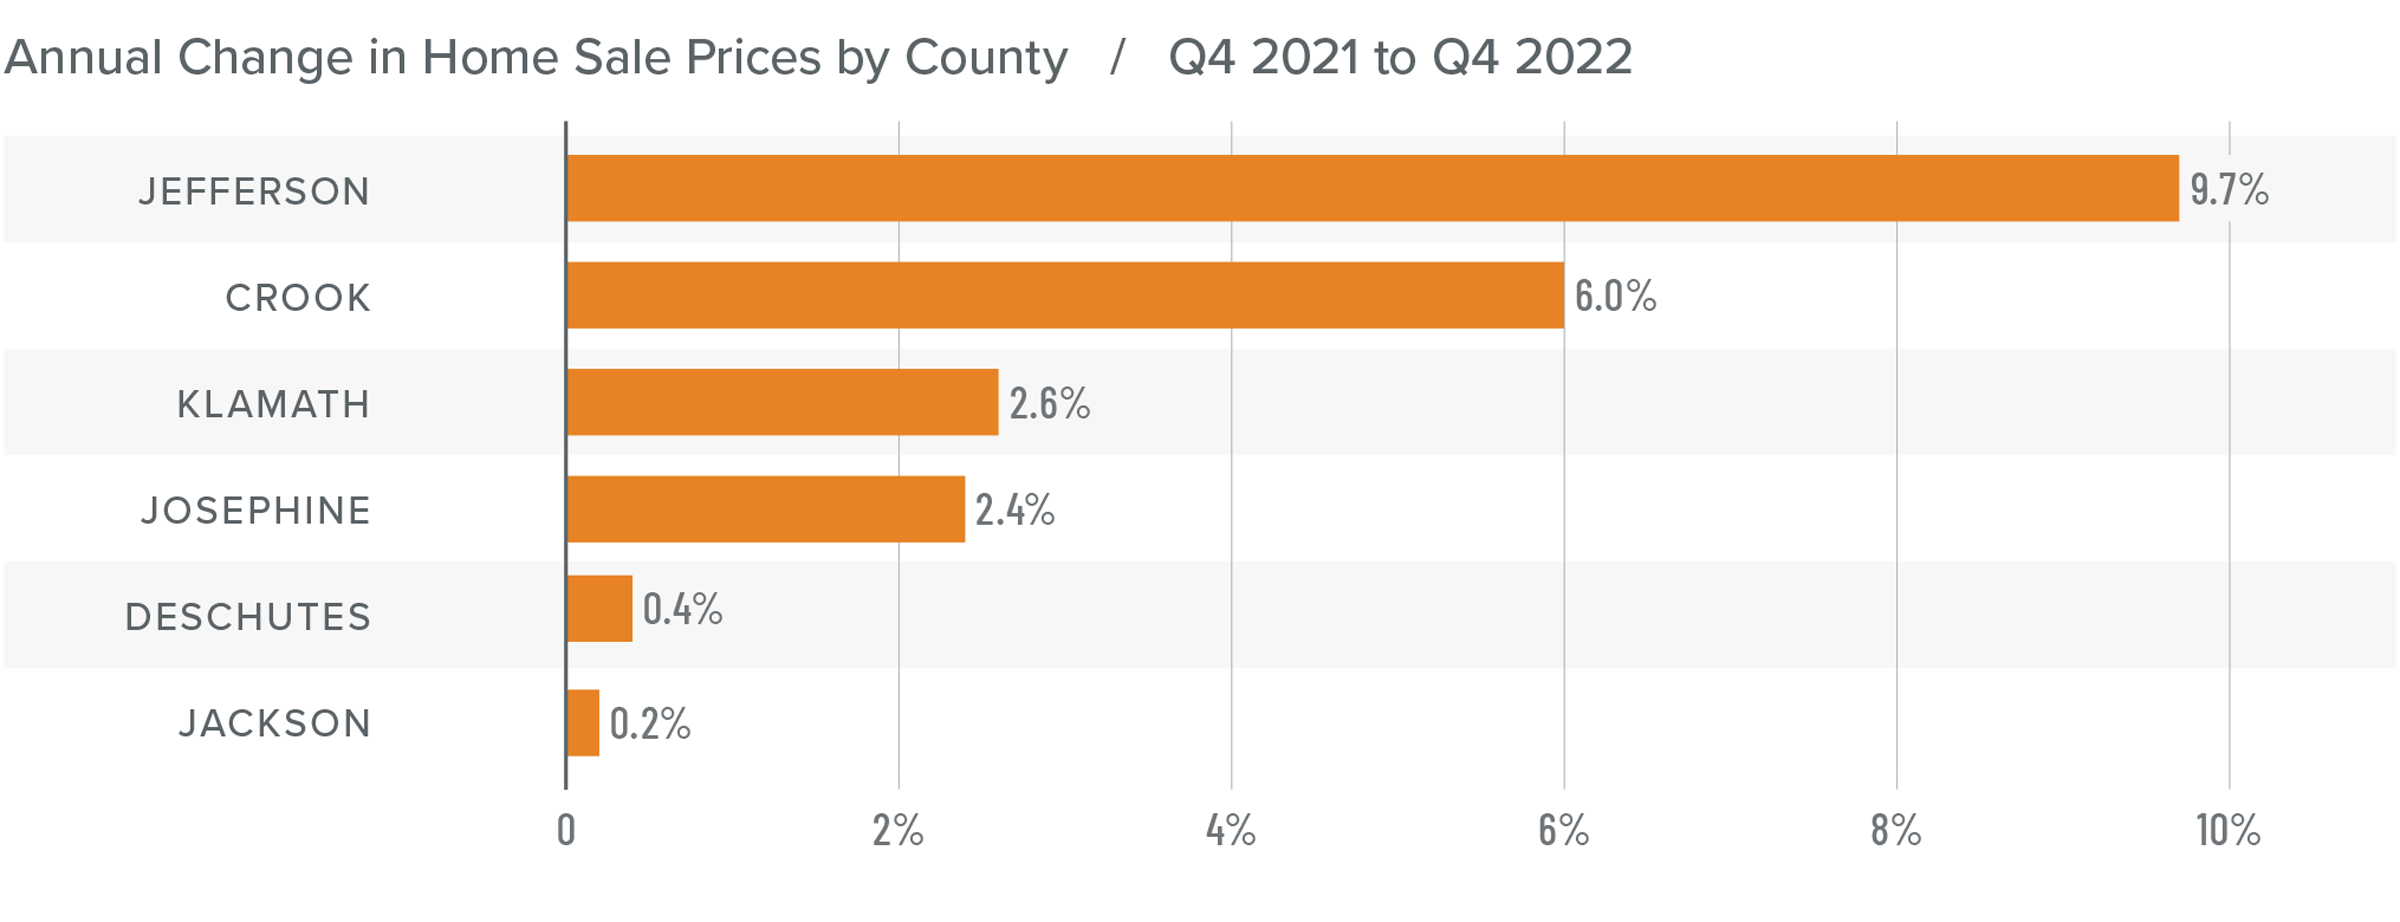
Central and Southern Oregon Home Prices
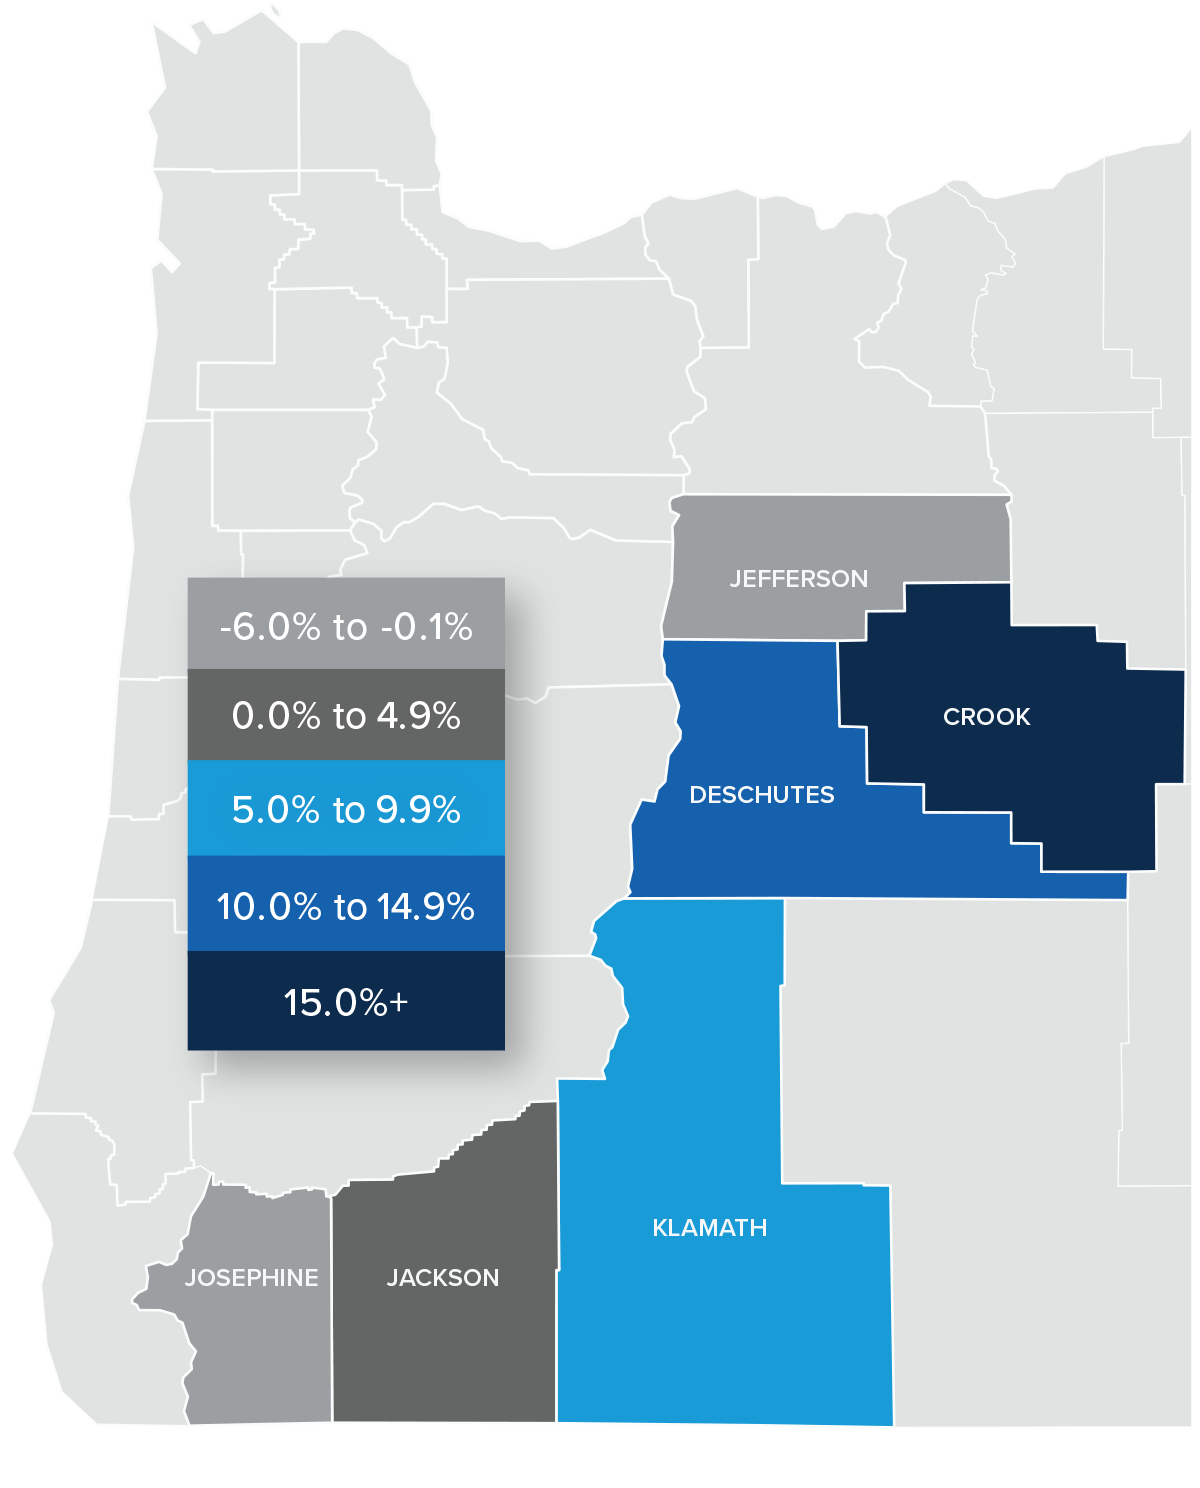
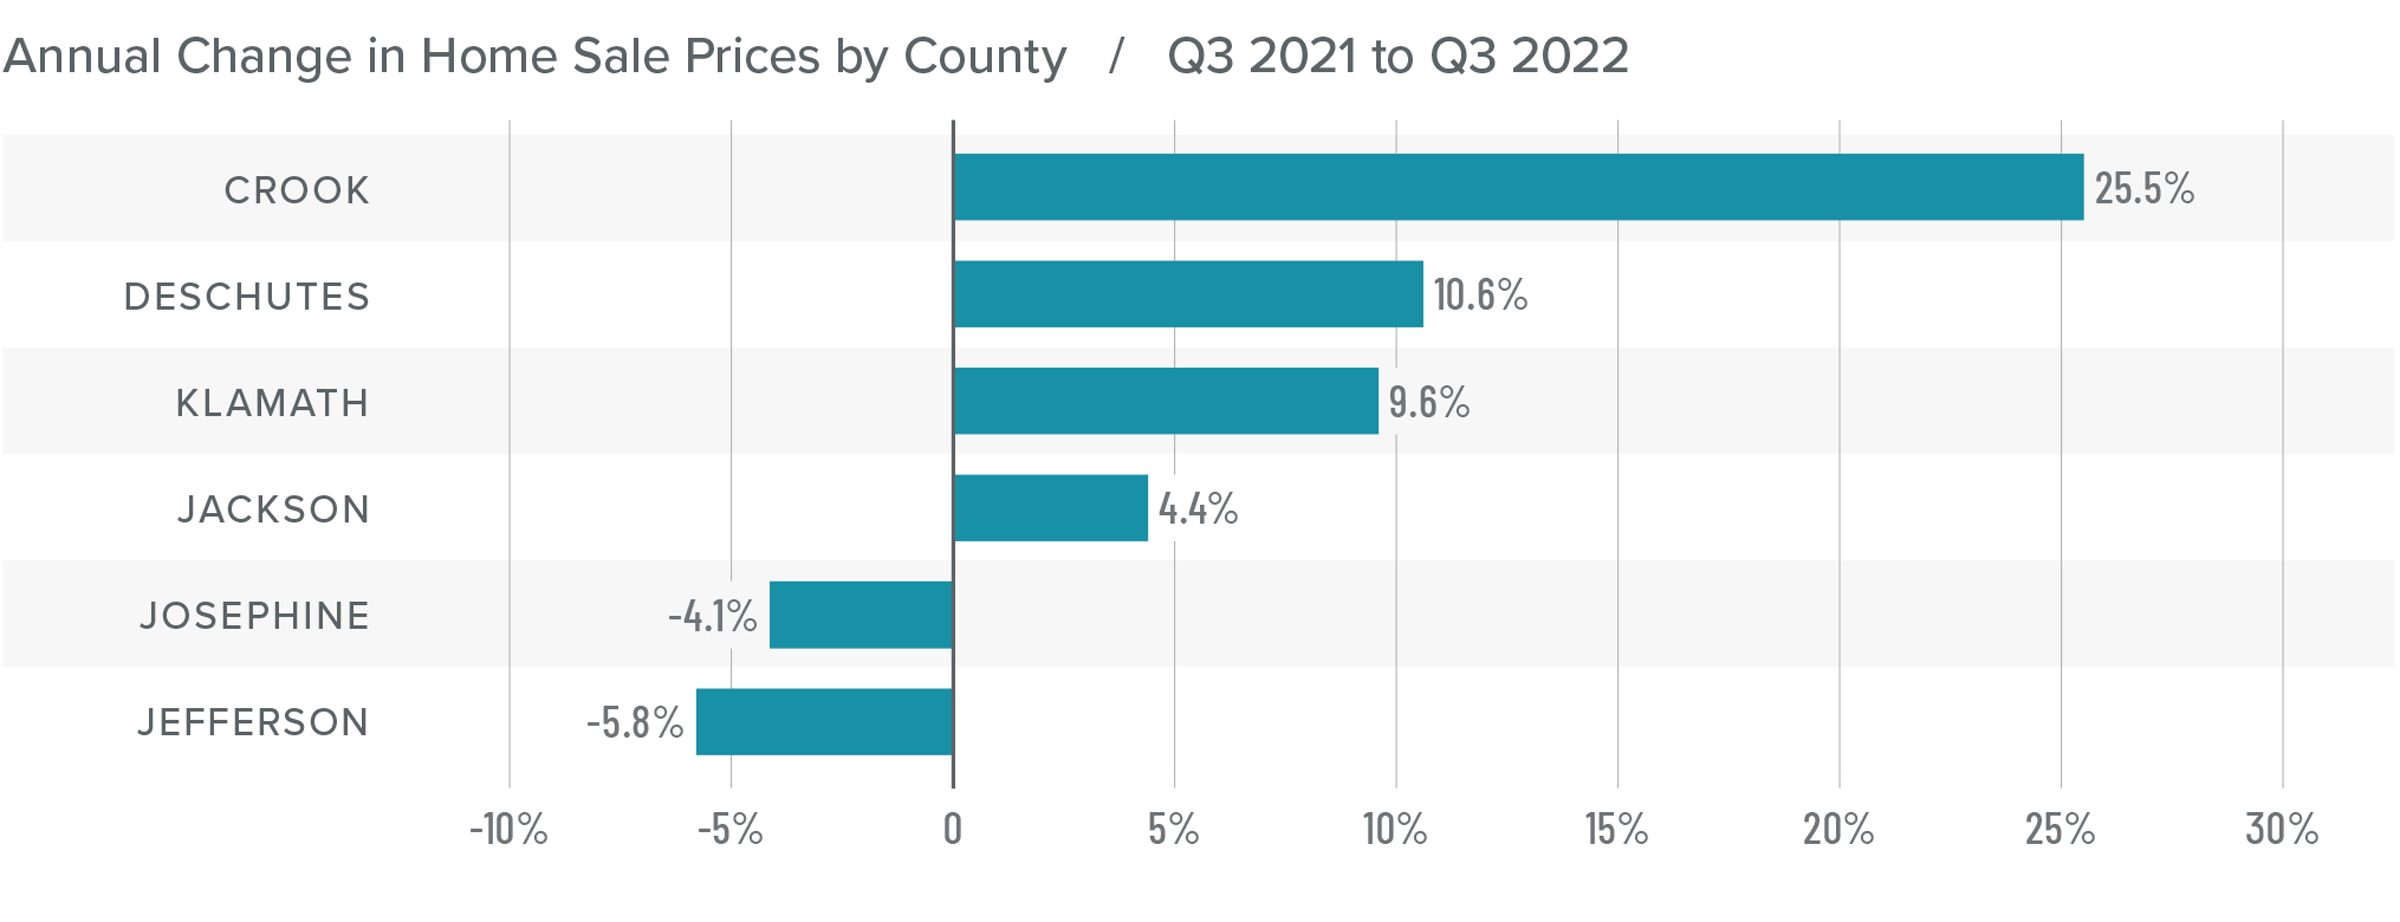
❱ The average home sale price in the region rose 1% year over year to $557,517, but it was down 8.4% from the third quarter of 2022.
❱ Compared to the third quarter of 2022, average prices fell in every county other than Jefferson, where they rose 3.4%.
❱ All counties contained in this report saw prices rise year over year, but prices in Deschutes and Jackson counties were essentially unchanged. It doesn’t appear that home prices have been significantly influenced by the increase in mortgage rates yet.
❱ Compared to the third quarter, median listing prices fell in Deschutes, Jackson, Crook, and Josephine counties, but rose in Klamath and Jefferson counties.
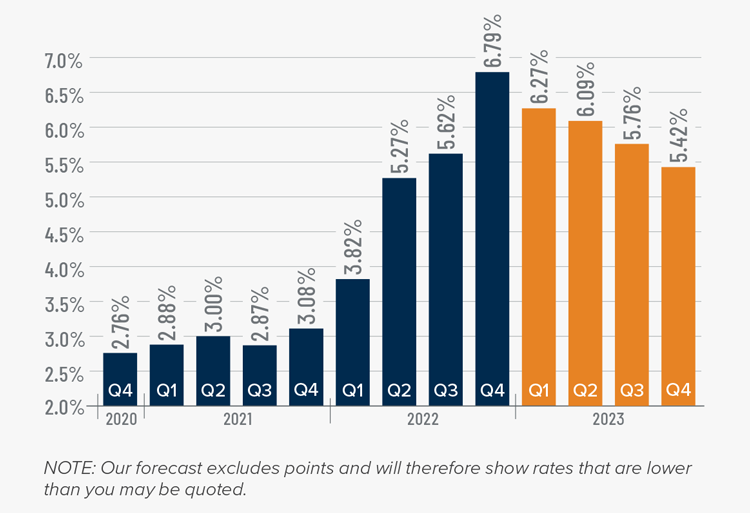
Mortgage Rates
Rates rose dramatically in 2022, but I believe that they have now peaked. Mortgage rates are primarily based on the prices and yields of bonds, and while bonds take cues from several places, they are always impacted by inflation and the economy at large. If inflation continues to fall, as I expect it will, rates will continue to drop.
My current forecast is that mortgage rates will trend lower as we move through the year. While this may be good news for home buyers, rates will still be higher than they have become accustomed to. Even as the cost of borrowing falls, home prices in expensive markets will probably fall a bit more to compensate for rates that will likely hold above 6% until early summer.
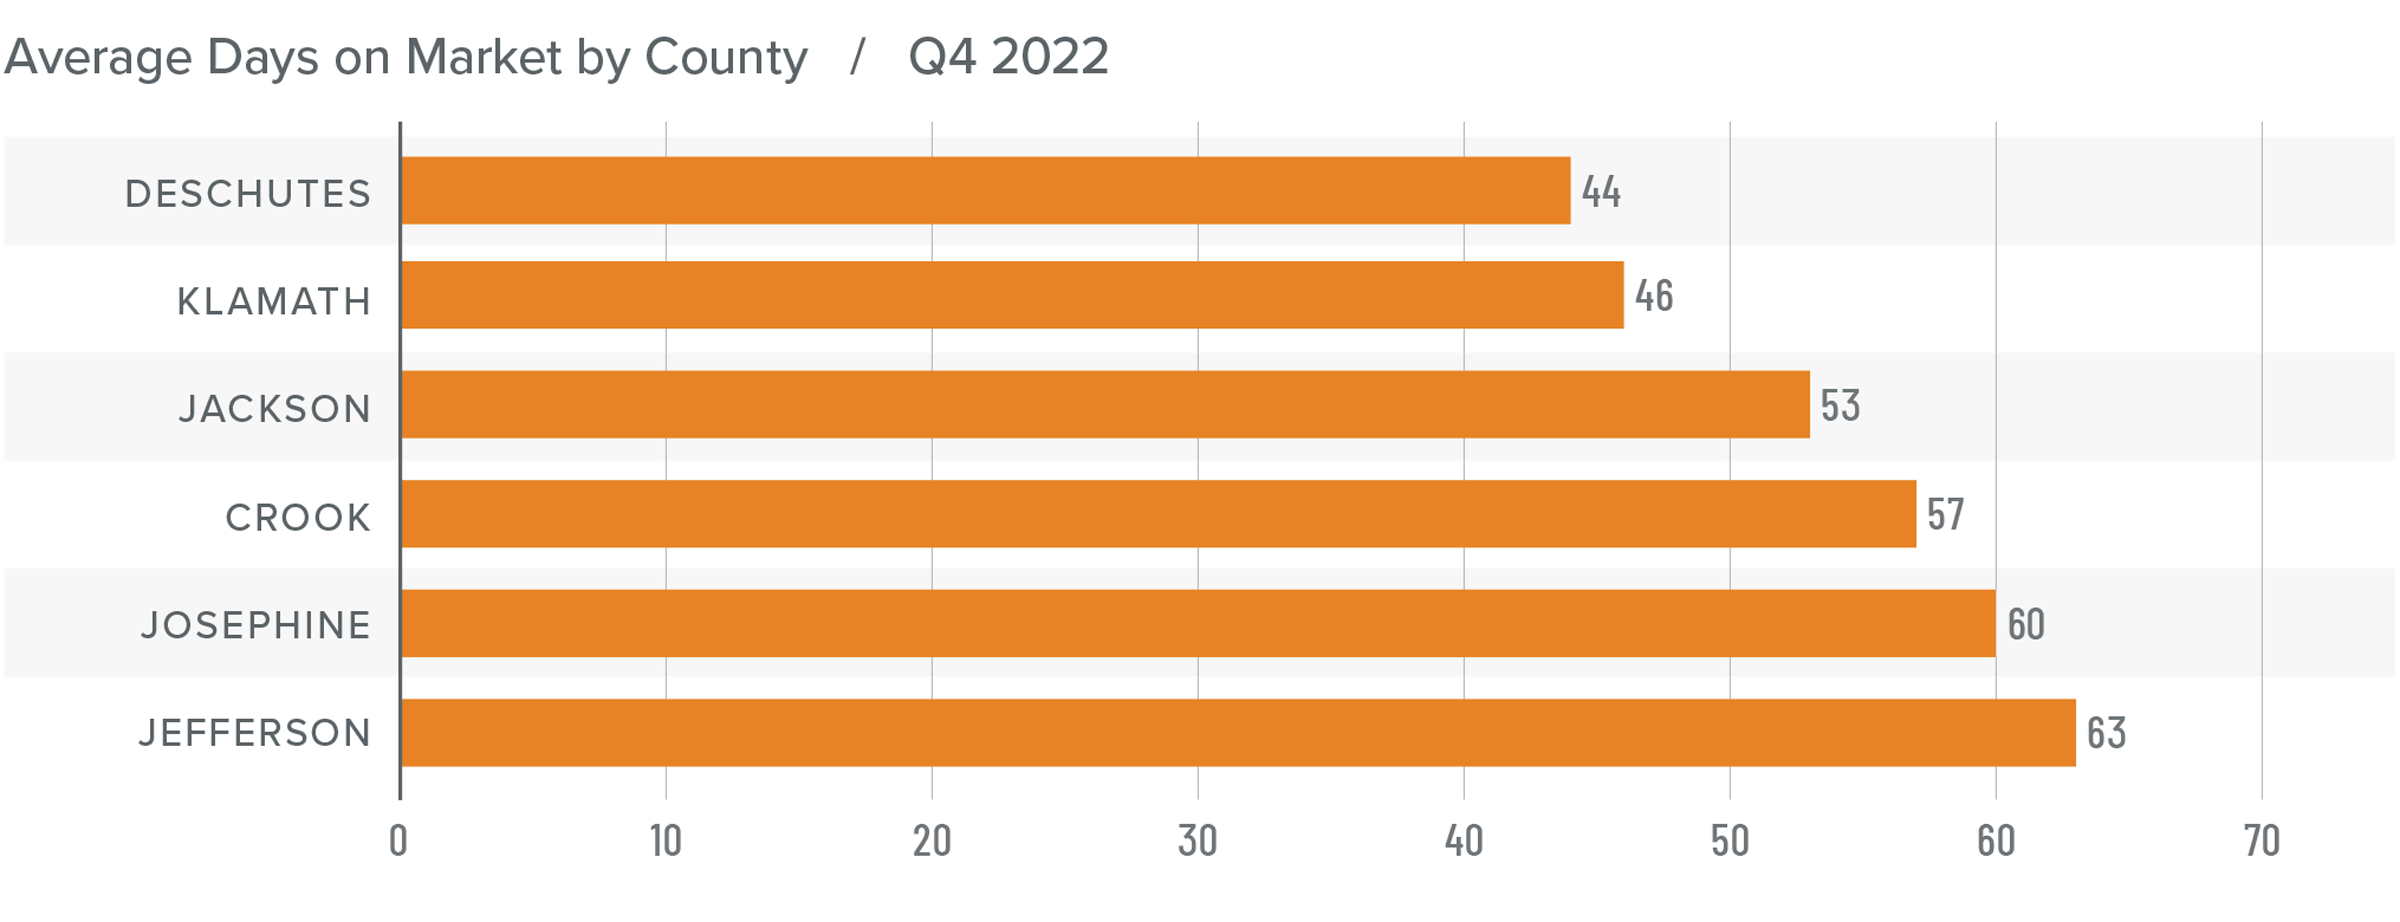
Central and Southern Oregon Days on Market
❱ The average time it took to sell a home in the region rose 26 days year over year. It took 21 more days for a home to sell compared to the third quarter of 2022.
❱ The average time it took to sell a home in the final quarter of 2022 was 54 days.
❱ All counties saw market time rise compared to both the same period the year prior and the third quarter of 2022.
❱ It appears that buyers are being far more selective and taking their time when it comes to making an offer on a home.
Conclusions
This speedometer reflects the state of the region’s real estate market using housing inventory, price gains, home sales, interest rates, and larger economic factors.
Sellers are adjusting to the changing market, as shown by the drop in asking prices in several markets, though this is not the case everywhere. The spring market will be a bellwether for the housing market in 2023. It appears as if mortgage rates have peaked, which should be good news for home buyers. Furthermore, sellers lowered their listing prices by almost 3% in the fourth quarter, demonstrating that they are aware that the market has shifted.

The market appears to be moving more toward buyers. As such, I have moved the needle closer to the center, but I cannot say definitively that the market completely favors buyers. The spring market will be very telling.
About Matthew Gardner
As Chief Economist for Windermere Real Estate, Matthew Gardner is responsible for analyzing and interpreting economic data and its impact on the real estate market on both a local and national level. Matthew has over 30 years of professional experience both in the U.S. and U.K.
In addition to his day-to-day responsibilities, Matthew sits on the Washington State Governors Council of Economic Advisors; chairs the Board of Trustees at the Washington Center for Real Estate Research at the University of Washington; and is an Advisory Board Member at the Runstad Center for Real Estate Studies at the University of Washington where he also lectures in real estate economics.
Q3 2022 Central and Southern Oregon Real Estate Market Update

The following analysis of select counties of the Central and Southern Oregon real estate market is provided by Windermere Real Estate Chief Economist Matthew Gardner. We hope that this information may assist you with making better-informed real estate decisions. For further information about the housing market in your area, please don’t hesitate to contact your Windermere Real Estate agent.
Regional Economic Overview
The Central and Southern Oregon counties covered by this report continue to see jobs return. The region is only 1,130 jobs shy of pre-pandemic peak employment. The Medford metropolitan statistical area (MSA) is still lagging, with employment levels 2,530 shy of the peak in January 2020. The other markets that have yet to see a full job recovery are Klamath County (-200 jobs) and Josephine County (-40 jobs). The area’s unemployment rate was 4.1%, down from 5.3% a year ago and .1% above the pre-pandemic low. By area, the lowest jobless rate was in Bend (3.6%) and the highest was in Klamath County, where 5.3% of the labor force is still without a job.
Central and Southern Oregon Home Sales
❱ In the third quarter of 2022, 2,436 homes sold, which was a drop of 26.3% from the same period a year ago. Sales were .5% higher than in the second quarter of the year.
❱ Compared to the second quarter of this year, sales fell in Crook, Jackson, and Josephine counties, but rose in the balance of the market areas covered by this report.
❱ Home sales fell in all counties compared to a year ago, with significant declines in the Medford and Bend markets.
❱ The growth in sales from the second quarter, while very small, was pleasing. The region is going through a transition, due in no small part to significantly higher financing costs, but I expect to see more stability come into play as mortgage rates start to even out.
Central and Southern Oregon Home Prices
❱ The average home sale price in the region rose 4.8% year over year to $608,654. Prices were up .9% compared to the second quarter of 2022.
❱ Compared to the second quarter of 2022, average prices rose in all counties other than Jackson, where prices dropped 1%.
❱ Four out of the six counties contained in this report saw sale prices rise year over year. The two counties where prices dropped only experienced a modest decline.
❱ Home prices don’t appear to have been significantly impacted by rising mortgage rates yet. Median list prices in the area rose in all counties other than Crook and Josephine, suggesting that home sellers are generally still confident.
Mortgage Rates
This remains an uncertain period for mortgage rates. When the Federal Reserve slowed bond purchases in 2013, investors were accused of having a “taper tantrum,” and we are seeing a similar reaction today. The Fed appears to be content to watch the housing market go through a period of pain as they throw all their tools at reducing inflation.
As a result, mortgage rates are out of sync with treasury yields, which not only continues to push rates much higher, but also creates violent swings in both directions. My current forecast calls for rates to peak in the fourth quarter of this year before starting to slowly pull back. That said, they will remain in the 6% range until the end of 2023.
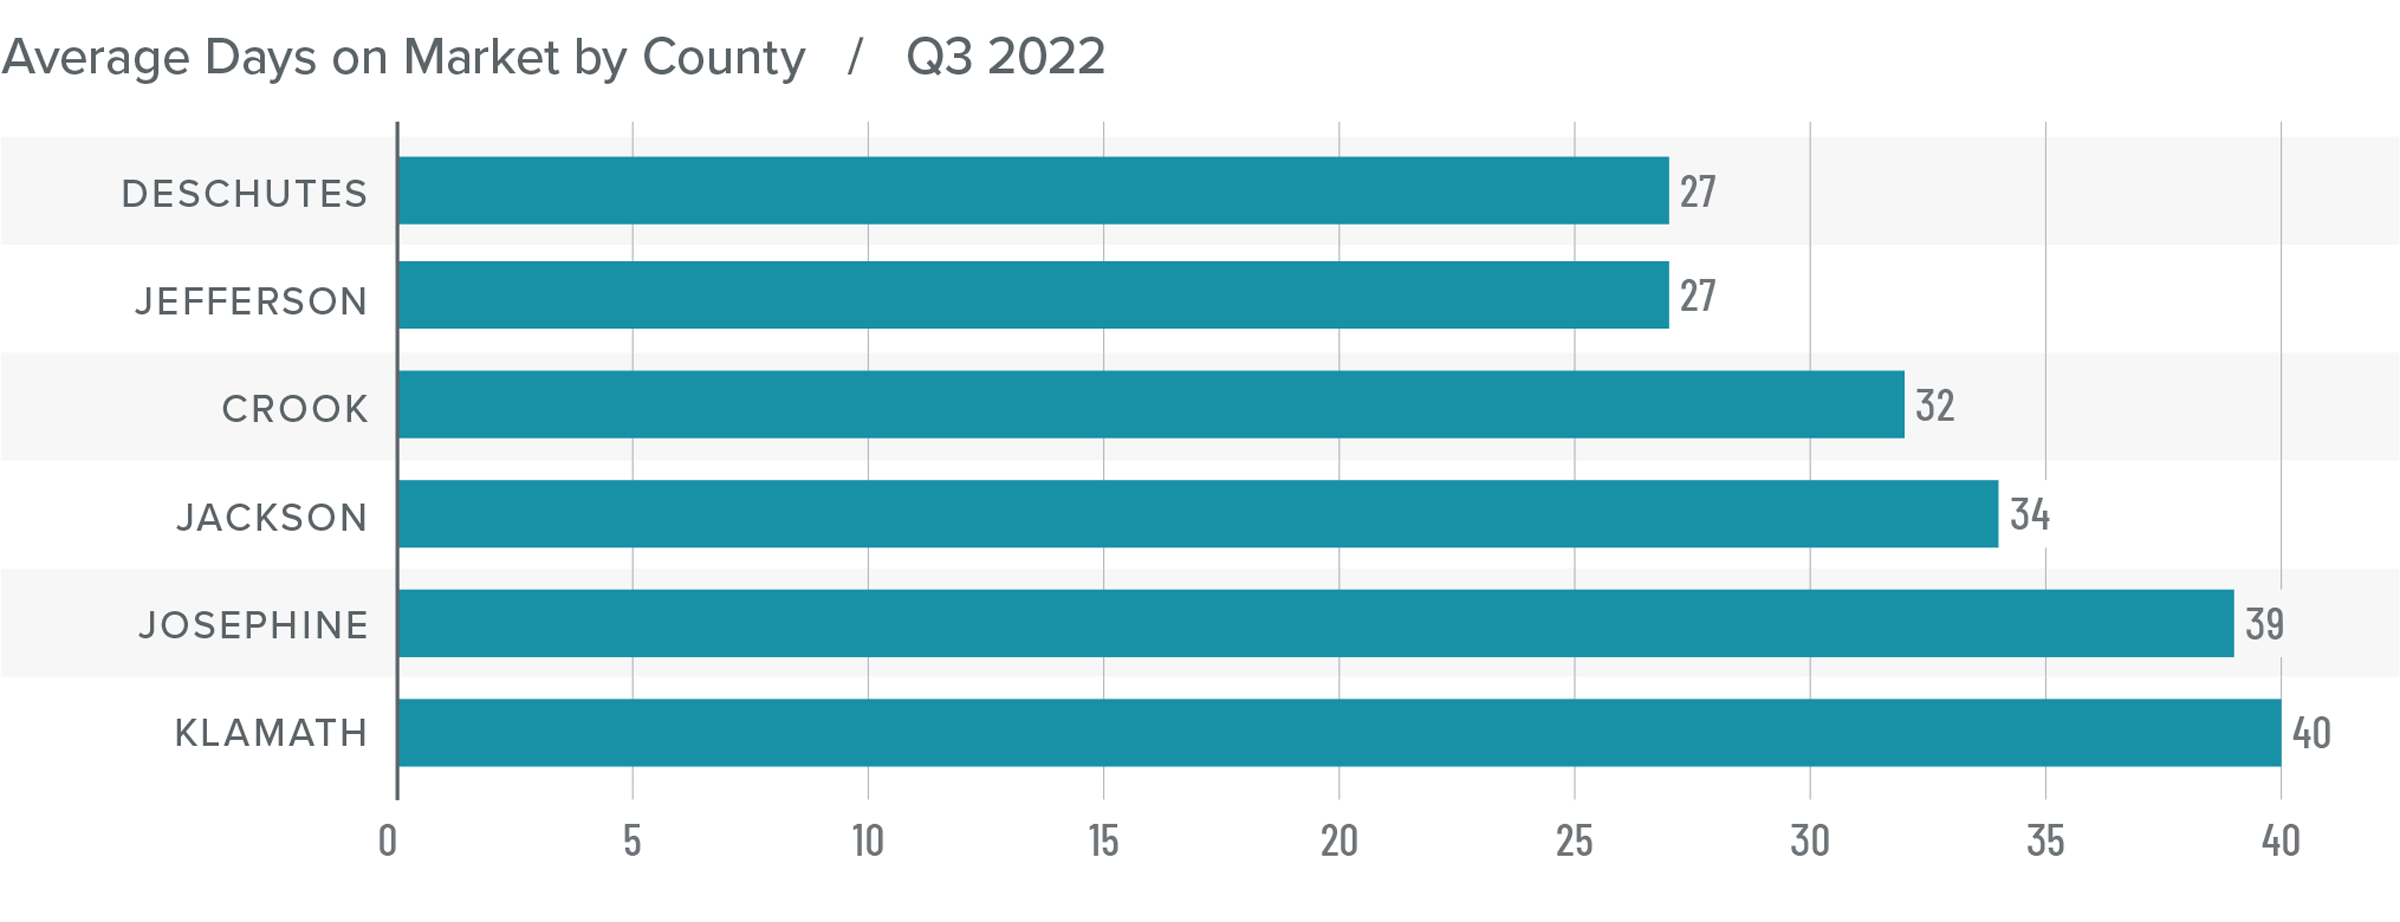
Central and Southern Oregon Days on Market
❱ The average time it took to sell a home in the region rose 12 days compared to a year ago. It took 5 more days for a home to go under contract than it did in the second quarter of the year.
❱ The average time it took to sell a home in the third quarter of 2022 was 33 days.
❱ All counties saw market time rise compared to a year ago. Crook and Jefferson counties saw market time fall compared to the second quarter of this year.
❱ Although rising, the time it took a home to sell in the third quarter remains well below the pre-pandemic average.
Conclusions
This speedometer reflects the state of the region’s real estate market using housing inventory, price gains, home sales, interest rates, and larger economic factors.
The labor market in Central and Southern Oregon continues to improve, but the housing market is starting to experience a period of uncertainty. I mentioned in the second quarter Gardner Report that buyers and sellers may believe the market is underperforming, but this isn’t actually the case. What we are seeing is a pullback from the overstimulated market of 2020 and 2021. The primary reason for this reversion is that mortgage rates have jumped from the all-time lows that were seen during that period.

Homeowners may feel frustrated by this slowing of activity and may also be worried that prices will decline. Though some markets may experience a very modest drop in sale prices, homeowners have seen their property values leap since the pandemic started, and an average of 56% of owners with a mortgage in Central and Southern Oregon are sitting on at least 50% equity. The region will continue to shift back toward equilibrium. As such, I moved the needle closer to signifying a more balanced market than we have seen in over a decade.
About Matthew Gardner
As Chief Economist for Windermere Real Estate, Matthew Gardner is responsible for analyzing and interpreting economic data and its impact on the real estate market on both a local and national level. Matthew has over 30 years of professional experience both in the U.S. and U.K.
In addition to his day-to-day responsibilities, Matthew sits on the Washington State Governors Council of Economic Advisors; chairs the Board of Trustees at the Washington Center for Real Estate Research at the University of Washington; and is an Advisory Board Member at the Runstad Center for Real Estate Studies at the University of Washington where he also lectures in real estate economics.
Q2 2022 Central and Southern Oregon Real Estate Market Update

The following analysis of select counties of the Central and Southern Oregon real estate market is provided by Windermere Real Estate Chief Economist Matthew Gardner. We hope that this information may assist you with making better-informed real estate decisions. For further information about the housing market in your area, please don’t hesitate to contact your Windermere Real Estate agent.
Regional Economic Overview
The Central and Southern Oregon counties covered by this report have added 5,470 new jobs over the past 12 months, representing an annual growth rate of 2.3%. The region has now recovered all but 2,400 of the more than 37,000 jobs that were lost due to the pandemic.The Bend Metro Service Area (MSA) and Crook County have both returned the jobs lost during the pandemic, but the Medford MSA is still lagging, with employment levels 3,200 lower than at the start of 2020. The area’s unemployment rate was 4%, down from 6.1% a year ago and matching the pre-pandemic low. By area, the lowest jobless rate was in Bend (3.4%) and the highest was in Klamath County, where 5.3% of the labor force is still without a job.
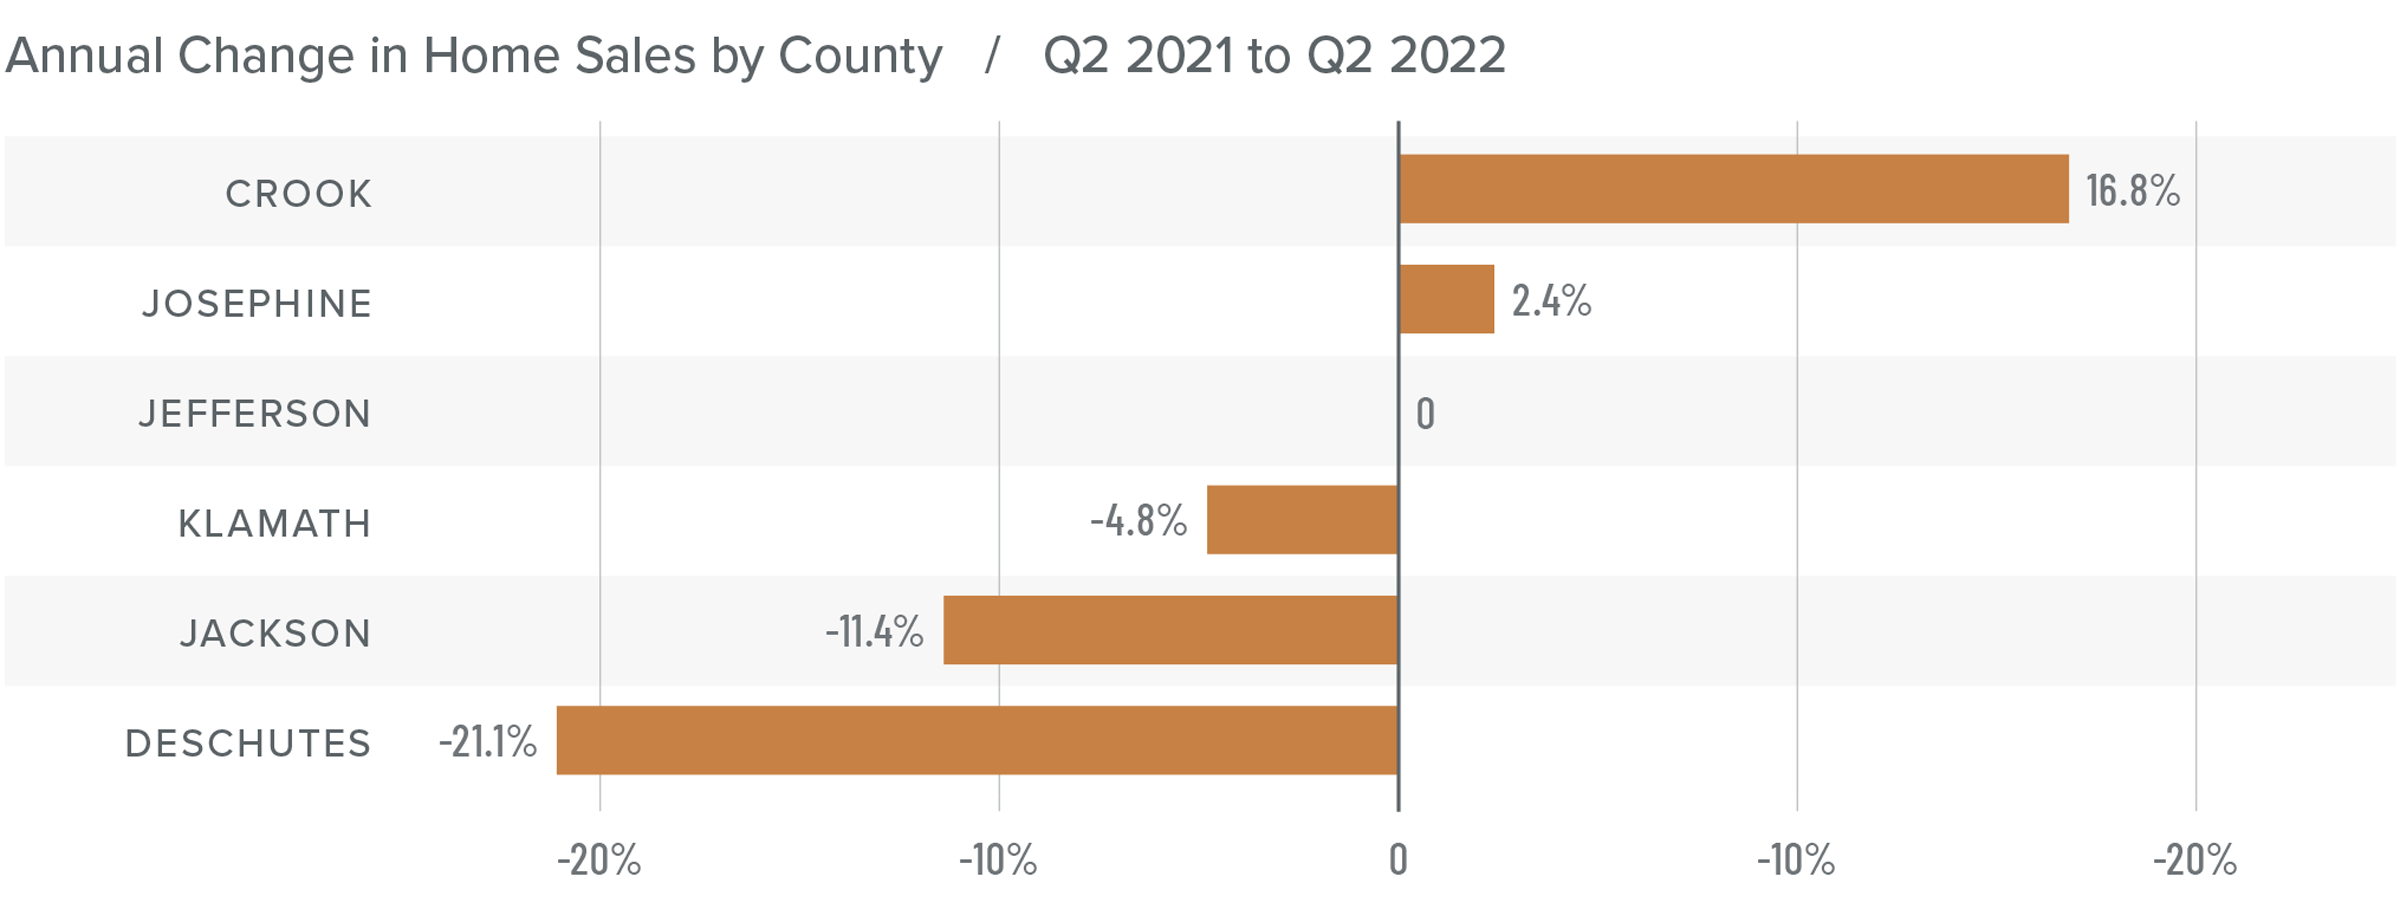
Central and Southern Oregon Home Sales
❱ In the second quarter, 2,424 homes sold, which represented a drop of 11.1% compared to the same period a year ago. Sales were 9.6% lower than in the first quarter of the year.
❱ Compared to the first quarter of this year, sales grew in Crook, Jackson, Josephine, and Klamath counties, but fell in Deschutes and Jefferson counties.
❱ Although sales fell overall, Crook and Josephine counties saw transactions grow by 16.8% and 2.4%, respectively.
❱ The drop in sales is not troubling; the market is only reverting back to its pre-pandemic pace. There will certainly be some markets that underperform, and this may make it feel as if the market is collapsing, but it isn’t.
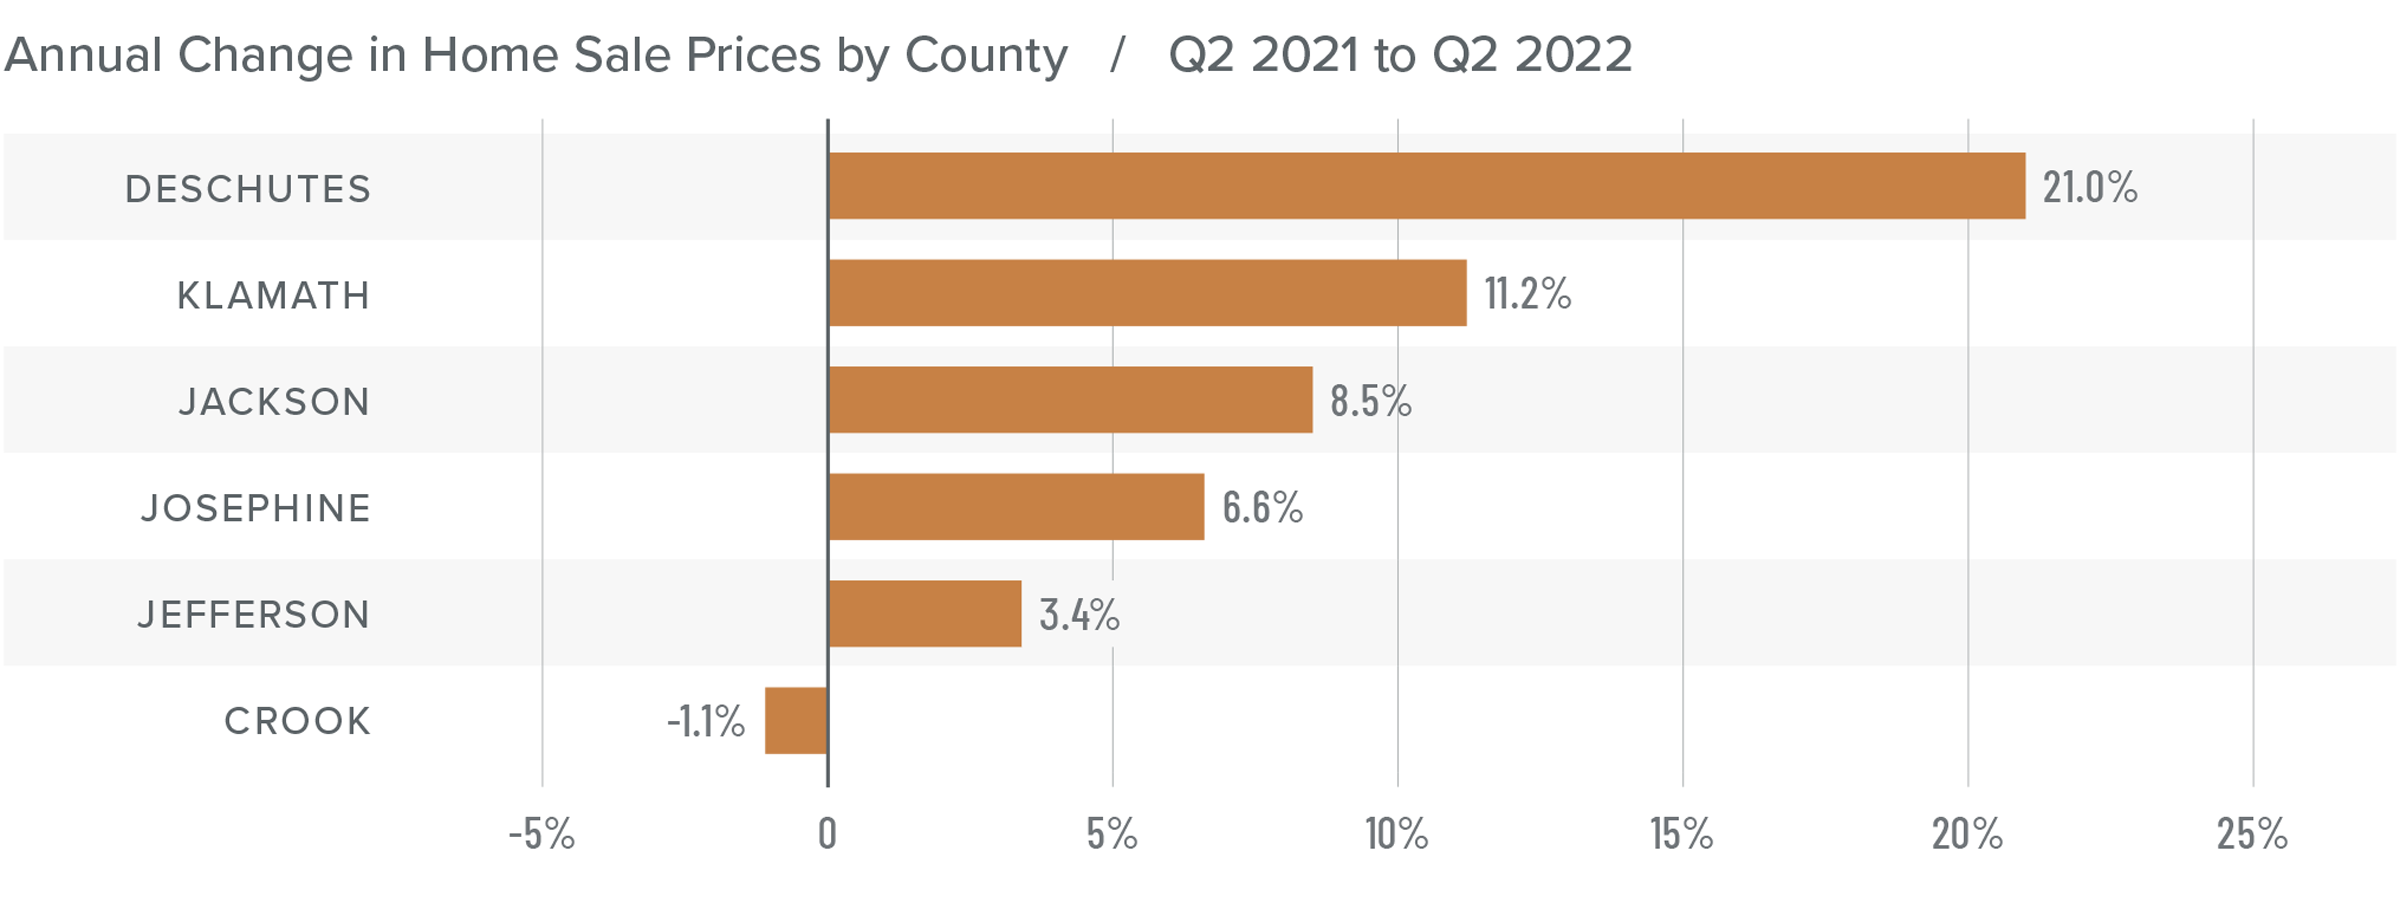
Central and Southern Oregon Home Prices
❱ While home sales fell, prices did not. The average sale price in the region rose 10.8% year over year to $603,271. Prices were up 1.5% compared to the first quarter of 2022.
❱ Compared to the first quarter of the year, average prices rose in all counties other than Josephine. In Bend, prices were up more than 13%.
❱ All counties contained in this report except Crook saw average prices rise compared to a year ago. The Bend area experienced significant increases.
❱ Home prices have not been significantly influenced by the increase in mortgage rates yet. Median list prices in the area rose in all counties other than Josephine (where they were flat), which suggests that home sellers are still confident. I will be closely monitoring list prices going forward, as they will be the first indicator that the market is cooling.
Mortgage Rates
Average rates for a 30-year conforming mortgage were 3.11% at the end of 2021, but since then have jumped over 1.5%—the largest increase since 1987. The speed of the surge in rates is due to the market having quickly priced in the seven-to-eight rate increase that the Fed is expected to implement this year.
Because the mortgage market has priced this into the rates they are offering today, my forecast suggests that we are getting close to a ceiling in rates, and it is my belief that they will rise modestly in the second quarter before stabilizing for the balance of the year.
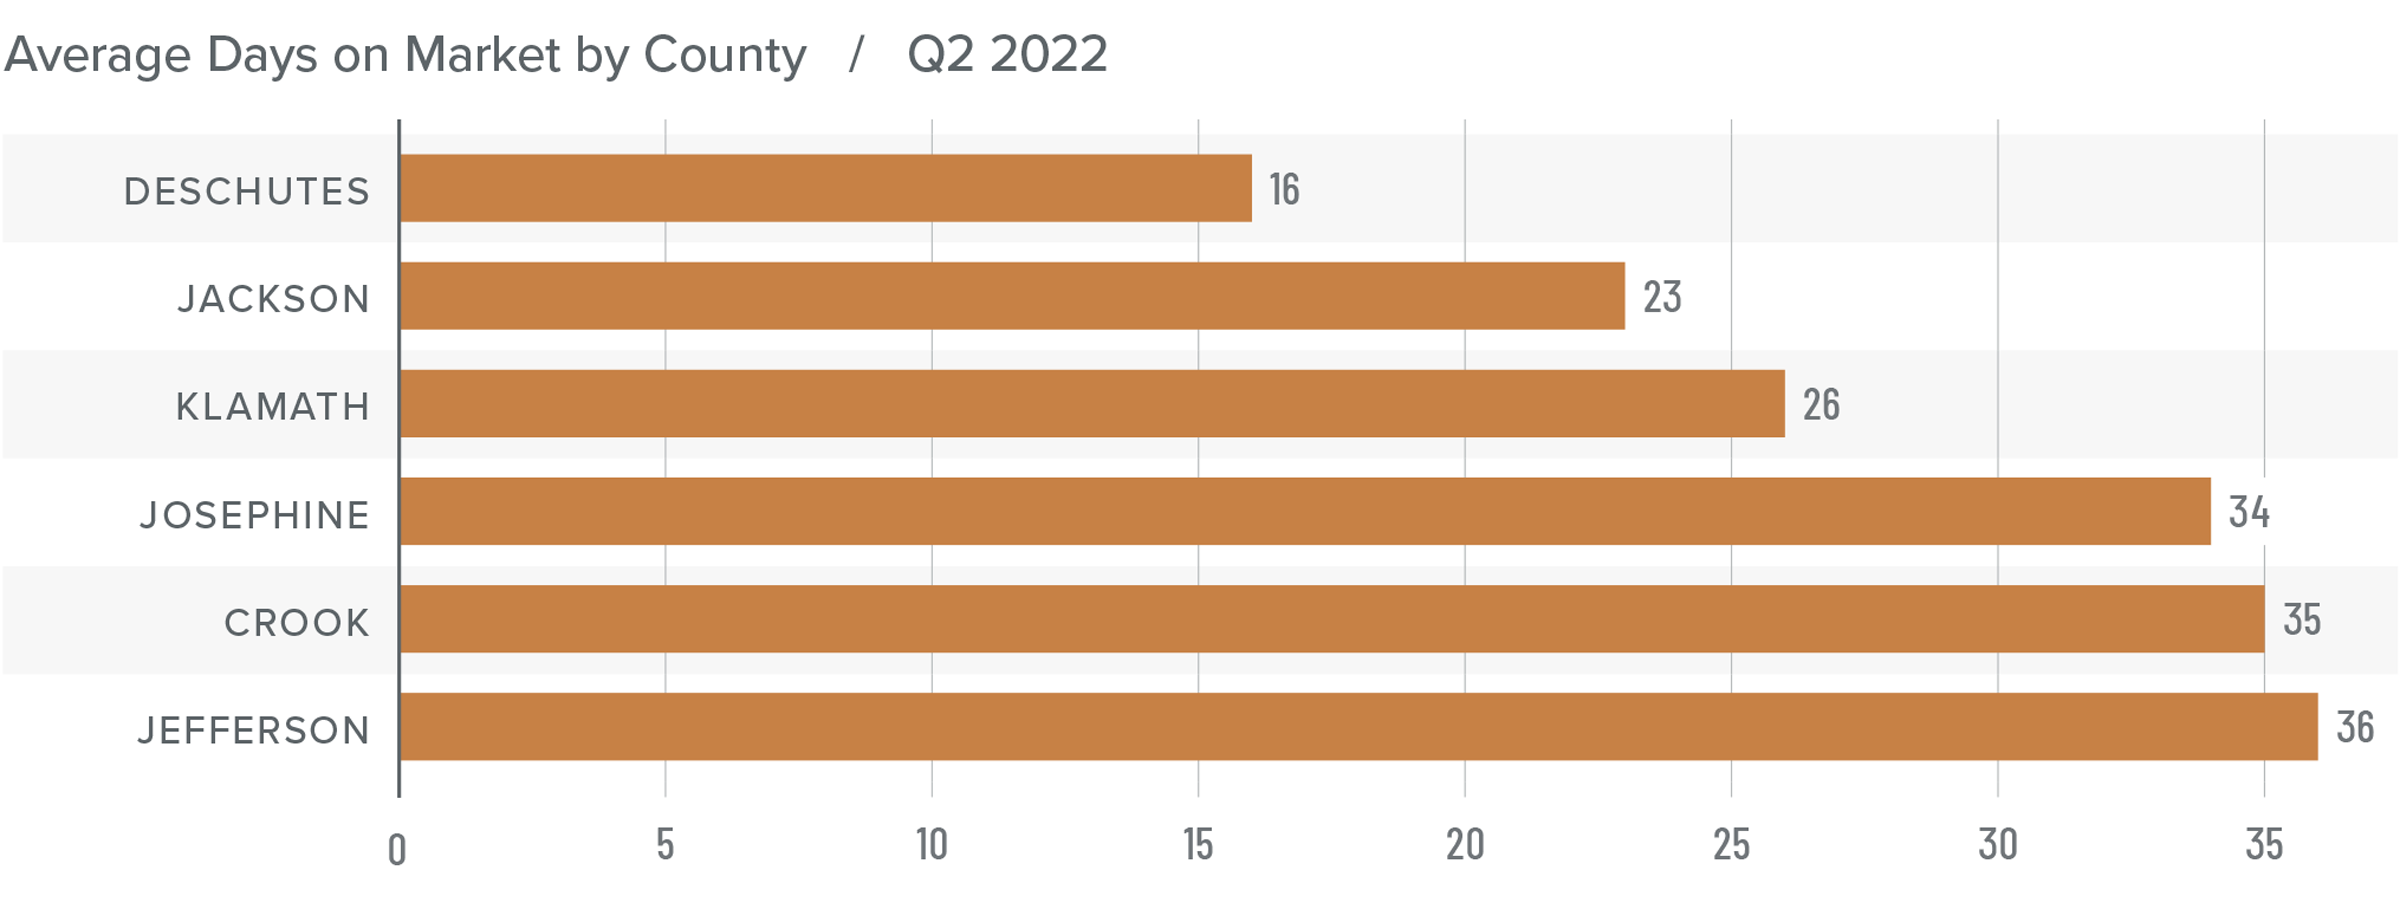
Central and Southern Oregon Days on Market
❱ The average time it took to sell a home in the region rose 2 days compared to a year ago, but it took 14 fewer days for a home to go under contract compared to the first quarter of the year.
❱ The average time it took to sell a home in the second quarter of 2022 was 28 days.
❱ Klamath (-2 days) and Jefferson (-7 days) saw market time drop, while market time rose or remained static in the rest of the region compared to a year ago. Market time fell across the board compared to the first quarter of this year.
❱ Interestingly, the average market time in the second quarter of 2019 (pre-pandemic) was 82 days, which is just one indicator as to the vibrancy of the region’s housing market.
Conclusions
This speedometer reflects the state of the region’s real estate market using housing inventory, price gains, home sales, interest rates, and larger economic factors.
Though the job market is recovering more slowly than I would like, the housing market is still performing strongly. As we move through the year, some may believe that the market is underperforming, but this is not the case. Along with much of the rest of the country, the Central and Southern Oregon housing market has been overperforming since the pandemic started. As the market starts to trend back to its pre-pandemic pace of sales and price growth, the slowdown might feel exaggerated but there is no cause for concern.

Despite dramatically rising financing costs, buyers still appear to be motivated. List prices have yet to “roll over,” suggesting that sellers are still confident. This, combined with the other data presented here, tells me that they are still in the driver’s seat.
About Matthew Gardner
As Chief Economist for Windermere Real Estate, Matthew Gardner is responsible for analyzing and interpreting economic data and its impact on the real estate market on both a local and national level. Matthew has over 30 years of professional experience both in the U.S. and U.K.
In addition to his day-to-day responsibilities, Matthew sits on the Washington State Governors Council of Economic Advisors; chairs the Board of Trustees at the Washington Center for Real Estate Research at the University of Washington; and is an Advisory Board Member at the Runstad Center for Real Estate Studies at the University of Washington where he also lectures in real estate economics.
")


