
 Facebook
 X
X
 Pinterest
 Copy Link

The following analysis of the Oregon and Southwest Washington real estate market is provided by Windermere Real Estate Chief Economist Matthew Gardner. We hope that this information may assist you with making better-informed real estate decisions. For further information about the housing market in your area, please don’t hesitate to contact your Windermere Real Estate agent.
Regional Economic Overview
The region’s job recovery, which stalled in the fall of 2020, has picked up again and I am hopeful this will continue.
Of the more than 285,000 Oregon jobs that were shed at the onset of the pandemic, 153,000 have now returned. Although employment levels are still 132,000 below the prior peak in February of 2020, the trend is again heading in the right direction. That said, rising COVID-19 infections have led the state to pull back on reopening and it is uncertain how this might impact the job market this spring. In Southwest Washington, 10,400 of the 22,000 jobs that were lost have returned and the trajectory appears to be similar to Oregon’s. With more jobs returning, the unemployment rate in Oregon continues to trend lower and now stands at 6% — a significant improvement from the 14.9% rate last April. The jobless rate in Southwest Washington currently stands at 6.7%, matching the level at the end of 2020.
oregon and southwest washington Home Sales
❱ In the first quarter of 2021 sales rose 7.1% compared to the same period a year ago, with a total of 12,342 homes sold.
❱ Sales rose in 14 counties but dropped in 12. As I mentioned in the last edition of the Gardner Report, most of the counties that saw sales drop were small and these markets can see significant swings. It appears as if this trend continues as smaller markets again saw lower sales.
❱ Following the trend seen last fall, sales were lower than fourth quarter. This can be attributed to a very significant lack of homes for sale rather than a slowdown in demand.
❱ Housing demand remains strong and is only being impacted by a lack of supply. Additionally, buyers are even more active today given the recent rise in mortgage rates. I expect an increase in inventory and sales in the coming year as homeowners who are able to continue working remotely sell and move to more affordable markets.

oregon and southwest washington Home Prices
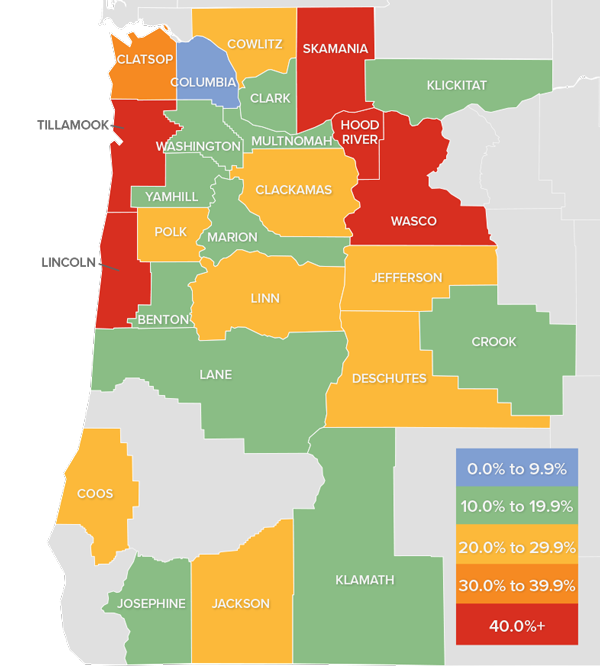
❱ Home prices in the region continue to skyrocket. The average sale price was up 21.7% year over year to $503,089. Prices were 5.7% higher than in the fourth quarter of 2020.
❱ Tillamook County led the market with the strongest annual price growth, but this is a very small market prone to significant swings. The most expensive market was Hood River County, where the average sale price was $694,333.
❱ Prices were higher in all counties contained in this report, with double-digit appreciation in all but one.
❱ Home prices continue to rise at a very significant pace, but I anticipate some headwinds—mainly in the form of higher mortgage rates—that may cool the market somewhat. That said, the pace of appreciation will remain above its longterm average throughout 2021.

Days on Market
❱ The average number of days it took to sell a home in the region dropped 30 days compared to the first quarter of 2020. It took 6 fewer days to sell a home compared to the final quarter of last year.
❱ The average time it took to sell a home in the first quarter of 2021 was 51 days.
❱ All but one county (Tillamook, +1 day) saw the length of time it took to sell a home drop compared to a year ago.
❱ Homes again sold fastest in Washington County, where it took 17 days to sell. An additional eight counties saw the average market time drop to below a month.

Conclusions

This speedometer reflects the state of the region’s real estate market using housing inventory, price gains, home sales, interest rates, and larger economic factors.
Home sales continue to grow, and robust demand is causing prices to rise significantly, resulting in a market that strongly favors sellers. The additional supply of homes that I’m predicting for 2021, combined with modestly rising interest rates, may start to slow the momentum in price growth, but for now I have moved the needle further in favor of sellers.
About Matthew Gardner

As Chief Economist for Windermere Real Estate, Matthew Gardner is responsible for analyzing and interpreting economic data and its impact on the real estate market on both a local and national level. Matthew has over 30 years of professional experience both in the U.S. and U.K.
In addition to his day-to-day responsibilities, Matthew sits on the Washington State Governors Council of Economic Advisors; chairs the Board of Trustees at the Washington Center for Real Estate Research at the University of Washington; and is an Advisory Board Member at the Runstad Center for Real Estate Studies at the University of Washington where he also lectures in real estate economics.
")


