Summer is just around the corner and there is no better way to prepare than indulging in some exciting backyard inspiration. Your outdoor living space can be more than just a place to spend time with family and friends; it can be your sanctuary as well. This year is the time to turn your backyard into your own personal vacation spot.
If you don’t have a tub already, consider adding a sunken hot tub into your backyard with a deck of natural stone, tall grasses, and outdoor curtains for privacy. Include pillar candles and some twinkling lights for ambiance.
If you entertain a lot, a kitchen is the ideal outdoor space for summer entertaining. Bring out your inner Bobby Flay with a cooking station that includes a high-end grill, refrigerator, wine chiller, and elegant washbasin. Round this all out with a concrete counter, bluestone tile floor, and stainless steel.
Nothing says summer like outdoor movies and your own personal drive-in. All you need is a projector to watch your favorite movie, some dangling lights in the trees, blankets, and pillows. You could also watch it from a hanging bench or my personal favorite, a floating bed.
Gardening can go beyond being a relaxing pastime; consider growing your favorite foods and join the “farm to table” movement. In 2012, people spent $1.2 billion more dollars on food gardening than they did flower gardening. An easy way to incorporate this is to use blueberries as foundation plants or other fruits, such as raspberries. If you already have flowers planted, tuck a pepper plant or basil in between your flowers.
A reading nook outdoors is the perfect way to get lost in your favorite book or magazine. You can convert a small shed into a private reading spot, an arbor with a bench surrounded by clematis, or a relaxing hammock. These hideaway spots are what turn your home into a staycation resort.
Is your ideal summer situated by a campfire? Build a fire pit and enjoy s’mores in the comfort of your backyard. Use an old wine barrel, bricks, stones, or a concrete bowl. A lowered fire pit is great if you want to use sand for a beachy atmosphere. On a warm summer night a campfire sets just the right mood for outdoor fun.
Having a water feature in your backyard instantly creates a Zen space. They can deflect unwanted attention by drowning out unwelcome sounds. Add a fountain, pondless waterfall, or small stream to complete the vibe. If you want a smaller commitment, a shallow recirculating foundation will also do the trick. All you need is a simple foundation and recirculating pump.
To enhance your space with little to no cost, add dangling vines or twinkling lights as a finishing touch to create your backyard haven. Time is something there never seems to be enough of, but these low-maintenance enhancements will enable you to spend that time in your very own outdoor living space.
Windermere Real Estate is proud to partner with Gardner Economics on this analysis of the Oregon and Southwest Washington real estate market. This report is designed to offer insight into the realities of the housing market. Numbers alone do not always give an accurate picture of local economic conditions; therefore our goal is to provide an explanation of what the statistics mean and how they impact the Oregon and Southwest Washington housing economy. We hope that this information may assist you with making an informed real estate decision. For further information about the real estate market in your area, please contact your Windermere agent.
Regional Economics
From a job growth perspective, numbers for the end of the first quarter showed a vast majority of the counties contained within this report having added to their job bases over the past 12 months rather nicely.
In aggregate, the market has added 32,621 jobs over the past four quarters which represents an annual growth rate of 1.9 percent. For comparison purposes, the state as a whole grew by 2.9 percent, but the U.S. expanded by a more modest 1.64 percent.
Even though the growth was less robust than seen in Oregon as a whole, we were impressed that the growth crossed all major industry sectors. This is an important fact as it suggests that the job recovery is not limited to lower paying, service jobs but has become broad-based and, therefore, sustainable.
Compared to the end of the first quarter of 2013, growth was most robust in Washington County, which added 8,800 jobs (+3.3%). This was followed by Clark County (+3%), and Klamath, Cowlitz, and Deschutes Counties, each increasing their employment base by 2.5 percent.
When compared to March of 2013, job losses were extremely modest and seen in just three counties. Lincoln County lost 70 jobs while Skamania and Klickitat Counties lost just 20 jobs, respectively. In my last report I suggested that the region should add 35,000 jobs in 2014. With the current annual growth of 32,600 jobs, we appear to be squarely on track.
The unemployment rate continues to drop with every county—other than
Benton—seeing unemployment rates lower than a year ago. We should note that Benton County did not see its rate rise, rather it remained static at a still-fairly-respectable six percent.
That said, I would taper all this enthusiasm with the fact that there are still several counties where the unemployment rate remains stubbornly above 10 percent. In as much as I would like to attribute this to an expanding labor force, this is not the case. Generally, these counties represent areas where there is little economic diversity, which is slowing their recoveries. Still, I am hopeful that they will start to see their unemployment rates drop as we move through 2014.
Although the counties shown here have, generally, seen improvements in their respective job markets, several have seen a slowdown in the first quarter when compared to the end of 2013. However, this is not unusual. County-level data is not seasonally adjusted, which makes direct comparisons to the previous quarter somewhat erroneous. Even with any perceived slowdown, I am still raising the grade to a “C+” from the “C’ grade given at the end of 2013.
Regional Real Estate
The housing market showed a fairly substantial deviation in the first quarter of the year which is worthy of discussion. On the positive side, price growth was quite impressive and generally broad-based; however, this was offset with a somewhat counterintuitive drop in sales activity.
Any hopes of a spring “bump” in sales were eroded by the fact that total listings dropped by five percent when compared to a year ago. It is clear that lower listing activity has started to have a pronounced effect on the market, but that said, it has yet to translate into any real effect on sale prices.
Listings grew at the fastest rate in Cowlitz County where total listings were up by 6.5 percent year-over-year. The only other counties that saw an increase in listings were Klickitat County (+3.2%) and Clark County (+0.5%).
With the lower level of inventory, home sales took a hit in early spring and were two percent lower in the first quarter of this year when compared to a year ago. In total, the quarter saw a total of 6,392 sales—down from 6,524 in the first quarter of 2013.
Compared to the first quarter of 2013, sales rose in just two counties, with Cowlitz County up by 7.6% and Multnomah County growing by 1.9%. Declines were widespread, with the largest drops seen in Hood River (-17.5%), Skamania (-16.7%), and Klickitat (-13.6%) Counties.
It might seem that the drop in sale activity would have a negative impact on prices; however, this was not the case. When we looked at home prices, the picture was generally bright, with 11 counties showing home values above those seen in the first quarter of 2013, and six registering double-digit growth. In total, the markets surveyed saw average home prices rise from $255,508 to $285,091—an increase of a healthy 11.6 percent. Compared to the fourth quarter of 2013, sale prices have risen by 2.9 percent.
We continue to see some very impressive price gains in smaller counties; however, prices in these markets tend to move erratically due to the limited number of home sales. In Coos County, for example, prices rose by 48 percent year-over-year (from $125,000 to $184,667). Other counties that saw large increases in average sale prices were Skamania (+36%) and Columbia (+35%).
There were just two counties where prices fell. Klickitat County saw the greatest drop in value compared to a year ago (-30.7%), but we again attribute this to the fact that it is a small market. The other market where prices dropped was Hood River (-2.1%).
On a positive note, just one county—Klickitat—is showing home values that are below those seen two years ago. Additionally, over half of the counties surveyed saw home prices in the first quarter exceed those seen in early 2009. This is important, as it was at that time that the market started to see a major decline in values.
Home prices are certainly influenced by the number, quality and mix of homes that are being offered for sale. Many times, markets with limited supply demonstrate stronger price growth than markets where inventory is less tight. However, the drop in sales as well as listing activity, although nothing to panic about, does give us pause for thought and may lead to slower price appreciation unless we start to see more activity.
As such, I am maintaining the “C+” grade that I have given this market for the past year.
Conclusions
On a whole, Oregon’s economy is starting to perform well, with seasonally adjusted employment growing by 46,300 jobs over March of 2013.
In the markets covered by this report, employment growth has not been as robust, but is still— on a percentage basis—higher than that seen in the U.S. as a whole. It is also pleasing to see that employment growth is not limited to service sector industries (which are generally lower paying), which bodes well for the housing market.
As discussed earlier, the housing market itself is somewhat contradictory. Prices are, on the whole, higher than those seen a year ago and in the fourth quarter of 2013. That said, the boost in inventory that I was hoping to see this quarter did not occur.
As predicted, interest rates are moving modestly higher and we are standing by our forecast that the year will end with average 30-year fixed rates marginally below five percent. The upward move in rates continues to get prospective buyers off the fence, but they are still faced will little in the way of choice in homes to buy.
I remain hopeful that the region will start adding to its supply of homes for sale, but it will take a dramatic rise during the balance of the year for me to start believing that the market is heading toward equilibrium.
About Matthew Gardner
Mr. Gardner is a land use economist and principal with Gardner Economics and is considered by many to be one of the foremost real estate analysts in the Pacific Northwest.
In addition to managing his consulting practice, Mr. Gardner chairs the Board of Trustees at the Washington Center for Real Estate Research at the University of Washington; sits on the Urban Land Institutes Technical Assistance Panel; is an Advisory Board Member for the Runstad Center for Real Estate Studies at the University of Washington; and is the Editor of the Washington State University’s Central Puget Sound Real Estate Research Report.
He is also the retained economist for the Master Builders Association of King & Snohomish Counties. He has twenty-five years of professional experience in the U.K. and U.S.
He has appeared on CNN, NBC and NPR news services to discuss real estate issues, and is regularly cited in the Wall Street Journal and all local media.
Windermere Real Estate is proud to partner with Gardner Economics on this analysis of the Western Washington real estate market. This report is designed to offer insight into the realities of the housing market. Numbers alone do not always give an accurate picture of local economic conditions; therefore our goal is to provide an explanation of what the statistics mean and how they impact the Western Washington housing economy. We hope that this information may assist you with making an informed real estate decision. For further information about the real estate market in your area, please contact your Windermere agent.
Regional Economics
With the first quarter of 2014 now in the rear view mirror, I think that it is fair to say that our state as a whole, and specifically the counties covered within this report, continue to improve from an economic perspective.
Washington State added just shy of 61,000 jobs over the past 12-month period, an annualized growth rate of 2.1 percent, while the markets covered by our report added 50,690 jobs (a 2.3 percent increase over a year ago).
This annual rate was modestly better than the 2.1 percent growth rate seen in our last report and, additionally, the market added 23,730 jobs during first quarter.
The tri-county areas of King, Snohomish and Pierce Counties continue to dominate in terms of employment growth with the addition of 43,700 total jobs over the past 12 months—slightly higher than the 42,800 jobs added in calendar year 2013.
On a county level, King County (+3.3%) maintains its top position relative to annualized employment growth. Somewhat surprisingly, this was matched by San Juan County (+3.3%), but in real terms this meant the addition of only 160 jobs. Rounding out the top three growth markets was Cowlitz County which added 900 jobs, a 2.5 percent annual rate. It is pleasing to see some of the southern counties starting to improve. It has been a while!
Job losses were limited to just two counties, with Jefferson County (-1.0%) and Kittitas County (-0.2%) seeing a decline in employment over the last year.
Looking at unemployment rates in the region, all but two counties saw an unemployment rate that was lower than that seen a year ago.
When compared to March of 2013, the greatest declines in the unemployment rate were in Lewis County and Cowlitz County where the rate dropped by 1.7 percent to 10.7 percent and 9.4 percent respectively. This was followed by San Juan County (6.2%) and Grays Harbor County (11.4%).
We saw the unemployment rate rise in Snohomish County which moved up from 5.7 percent to 6.0 percent, and in King County where the rate rose marginally from 5.1 percent to 5.2 percent. Although this may appear surprising, it really isn’t. The principal reason for this statistic was that the labor force in both areas grew by a substantial three percent. I’ll explain: As job markets improve, more people start to look for work. When they look for work, they are officially counted as being unemployed and, therefore, it is not a surprise to see the rate rise. In fact, this is actually good news! The current labor force in these counties was measured at 1.565 million—a figure that has never been higher. As such, I am not worried about the increase and anticipate that the rate in both these counties will start to drop again shortly.
In my last report, I suggested that in 2014 the region should add approximately 50,000 new jobs. At the current rate of 50,690, I appear to be right on track. That said, we are still not “outperforming” and, as such, I am still maintaining the “B+” grade that I have given the employment situation for the past three quarters.
Regional Real Estate
Brokers throughout Western Washington that I have talked to this spring are, on the whole, confident that the market will continue to improve as we move through 2014, but there are some obstacles. In general, these revolve around the disappointing levels of inventory which in certain markets have led to frantic bidding wars—something that holds little appeal to anyone other than sellers.
Year-over-year, listings are generally higher than March 2013, with the market reporting a five percent rise in inventory levels. This is a good thing; however, the total number of homes for sale still remains well below historic levels. By example, total listing activity is 49 percent below that seen in March of 2009. Many, including myself, hope that this will improve in the coming months.
The greatest growth in listings was again seen in Snohomish County which saw a 35 percent increase in homes for sale. This was followed by Pierce County where total listings were 18 percent higher than a year ago, and Cowlitz County where inventory levels were 11 percent higher. Five other counties experienced single-digit increases in listings, but eight counties saw listing activity at the end of 2013 below that seen a year ago. The largest losses were seen in Skagit (-15.7%), Grays Harbor (-11%), and Mason (-10%) Counties.
Year-to-date, home sales in 2014 were 10.8 percent higher than seen in the first quarter of 2013, with a total of 14,896 sales recorded. The greatest increase in home sales was seen in Grays Harbor County (+46.6%), which would explain their lack of inventory at the present time. This was followed by Snohomish County (+37.3%), Island County (+22.3%) and Kittitas County (+20.5%). Five additional counties saw year-over-year home sales rise by 10 percent during the first quarter, while two others saw single-digit growth. All-in-all, positive momentum for home sales in Western Washington.
There were five counties where home sales fell compared to a year ago, but these declines were fairly modest. What was of particular interest, and just a little concern, was the number of home sales in the first quarter versus fourth quarter of 2013. Total sales were down by 20.2 percent, which is somewhat counterintuitive as one would expect the spring market to be better than the winter. At the present time, I am putting this down less to inventory limitations, and more to the fact that interest rates fell last quarter, which may have pulled some buyers forward who would have normally bought in the spring. Time will tell if this is an accurate hypothesis or not!
The average home price in the Western Washington region was $315,835 – up by 7.1 percent over the first quarter of 2013. As is seen in the chart to the right, all but two counties saw average sales prices rise versus those seen in the first quarter of 2013. Prices have been evening out over the past year, which is actually good news and indicates that growth rates are moving toward more sustainable levels.
When we look at individual counties, the strongest annual gains were in King County where prices rose by 11.4 percent. There were also double-digit gains seen in Grays Harbor County (+10.8%) and Pierce County (+10.4%). Of the balance, all but two saw price increases in the single digits. These modest declines were in the small Lewis County market (-8.6%) and the equally diminutive Kittitas County (-6.1%).
Compared to the fourth quarter of 2013, home prices were higher in five counties, with King County remaining at the same level. Home prices fell in ten of the counties analyzed but most of the declines were relatively modest.
Not particularly surprising was the comparison to sales prices seen two years ago. All but two counties (Thurston and Mason) showed home pricesrising. At long last, we saw a county where prices are now higher than seen five years ago, with King County home prices 9.2 percent higher than seen in the first quarter of 2009. Home prices in several other counties are now less than ten percent below that seen five years ago, and I anticipate that they will all enter positive territory before the end of the year.
It is now time to bump the grade on home prices from a “B-” to a “B”. Although home sales activity has slowed, sustained price growth is likely to be seen in 2014 assuming that numbers of listings continue to rise.
Conclusions
Some people I’ve spoken to appear to be waiting for “the other shoe to drop”; meaning that we should expect to see a decline in home values after a rather bullish market over the past two years.
For my part, I am not seeing that happen. In fact, I still believe that there is quite reasonable upside potential for home values in 2014. Why do I say this? Well, there are several reasons that suggest a relatively healthy prognosis for our region.
The first reason is that economically the region continues to add jobs. This is a critical component of the housing market. With a regional growth rate that is well above that seen in the U.S. as a whole, we are in pretty good shape. And as of yet, I do not think we are firing on all cylinders.
Secondly, the interest rate environment is still really good. Although interest rates are above the historic lows seen in 2013, they are still remarkably modest. I do expect to see rates continue to rise this year, but my forecast suggests that average 30-year fixed mortgage rates will still end 2014 at a level around five percent.
Finally, although banks have been notoriously tight in terms of qualifying potential buyers for mortgages, all indications suggest that they are starting to ease a little. Average FICO scores are slowly coming down, which will only add to potential buyers’ abilities to qualify for mortgages.
There is, however, a flip side to this argument and that is inventory-related. Although we did see a five percent increase in listings in March of 2014 compared to March of 2013, the current level is still well below where it should be. Despite that, I remain confident that we will see further growth in listing activity as we move through the year, but do not expect to see a “balanced” market in the near-term.
Belief in home ownership has returned. That being said, I anticipate that buyers will continue to outpace sellers in the coming year. This will be frustrating to some, but a benefit to others. So goes the market!
About Matthew Gardner
Mr. Gardner is a land use economist and principal with Gardner Economics and is considered by many to be one of the foremost real estate analysts in the Pacific Northwest.
In addition to managing his consulting practice, Mr. Gardner chairs the Board of Trustees at the Washington Center for Real Estate Research at the University of Washington; sits on the Urban Land Institutes Technical Assistance Panel; is an Advisory Board Member for the Runstad Center for Real Estate Studies at the University of Washington; and is the Editor of the Washington State University’s Central Puget Sound Real Estate Research Report.
He is also the retained economist for the Master Builders Association of King & Snohomish Counties. He has twenty-five years of professional experience in the U.K. and U.S.
He has appeared on CNN, NBC and NPR news services to discuss real estate issues, and is regularly cited in the Wall Street Journal and all local media.
Home Security Systems: Protecting the People and Things You Value the Most
With warmer weather come open windows and extended vacations, so it should come as no surprise that the highest percentage of home burglaries happen during the summer months. With that in mind, now is a good time to start thinking about the security of your home. From old-school security tricks to new digital home monitoring tools, there are many options when it comes to keeping our homes safe. Read on to learn more about how you can modify your home and keep it safe from intruders.
Security bars and gates:
Sometimes the simplest security is just deterring people from trying to get in. While security bars across windows are a great way to keep intruders out of your home, they can be a real eyesore. Luckily, there are now options for decorative security bars that simultaneously protect your home while enhancing its beauty.
Upgrade you locks:
A poorly installed deadbolt can make it easy for an intruder to kick in your door. Start by making sure that your doorframes are in good condition and then look into getting a higher quality deadbolt. You’ll find everything from classic models with keys, or digital options that require passcodes or a fingerprint.
It’s also a good idea check all the locks on your windows. Some older models are easy to jimmy open with a little wiggling. For ground floor windows, you may want to consider double locks. It goes without saying, leaving windows open during the summer is a bad idea – especially those that can be easily accessed.
Exterior and interior home lighting:
Having your exterior lights on timers or motion sensors is a good way to deter nighttime snoopers. Add sensor lights to key entry points on your home, including the front door, back door, and/or basement entries. If you have an unused side yard, consider lighting there too. Keeping your home lit makes unwanted visitors weary of being seen.
If you will be gone from your home for an extended period of time, consider using timed lighting options in your home to make it appear someone is around. You can select timers for bedrooms or living areas. Also, you can program a radio to turn on and off for sound.
Alarm systems:
If you are considering an alarm, you have an array of options that vary from self-install motion detection kits to full-service home security systems. If you choose to do-it-yourself, you will want to install motion detectors on doors and windows – especially those that can be easily accessed on the ground floor. In most cases, these kits also offer a 24 hour call service for an extra fee.
Full-service security systems can include everything from an alarm system and panic buttons to and integration with your smoke detectors/ fire prevention system. These services are expensive up front, but usually have a reasonable monthly rate. And keep in mind, having a home security system installed can also reduce your insurance rates.
If installing an alarm system is cost-prohibitive or does not fit your lifestyle, consider purchasing stickers and a sign that state that your home is monitored by a trusted security system, and place them so they are visible at every entrance.
Security cameras:
Security cameras are readily available for home installation. You can install these in prominently viewed places to deter burglars. There are do-it-yourself install options, and professional systems that come along with monitoring services. There are even options that will work with your smart phone. If the cost for security cameras is too steep for your budget, you can purchase fake cameras to act as a visible deterrent for intruders.
Build your community:
Programs like Neighborhood Watch are very successful in some communities, by creating an environment where everyone is looking out for each other. Building close-knit relationships with your neighbors can go a long way in making you feel safe at home. Whether this is through a formalized program, or a shared agreement with your community, developing relationships with your neighbors is a great way to keep your home safe.
Sometimes the best part of security systems is the peace of mind that comes with knowing your home is protected. Many of our personal items can be replaced thanks to homeowners insurance, but you cannot put a price on feeling safe at home. How do you keep your home safe?
This year, Windermere is participating in the fourth annual Seattle Foundation GiveBIG event! The Seattle Foundation's GiveBIG is a one-day, online charitable giving event to inspire people to give generously to nonprofit organizations who make our region a healthier and more vital place to live.
On Tuesday, May 6, from 12:00 am to 12:00 pm, a portion of each donation made on behalf of the Windermere Foundation through the Seattle Foundation website will be matched, allowing your donation to go even further towards helping our neighbors in need. All the money raised through the GiveBIGprogram will benefit nonprofits in the King County region, with specific emphasis on providing emergency services to low-income and homeless families.
This year’s GiveBIG theme honors the heroes in our community. Your support of the Windermere Foundation and GiveBIG makes you a hero to us and to all of the low-income and homeless families your donation will help.
Working together to change lives and renew hope in your community
THE HEART OF THE MATTER
You’re more than a good samaritan; you’re a HERO!
From Christine Wood Executive Director
I’ll bet you didn’t know this but in my book, YOU ARE MY HERO!
When you give to the Windermere Foundation, you make a dramatic difference in the lives of so many hurting people. Men, women, teens and even families who are barely hanging on are finding hope — and it’s all because your kindness is giving them the strength and courage to move their lives forward.
We created this newsletter, Agents of Change, because we wanted you to know how much good your generosity is doing.
As you read the stories of David and Allison, Josh, Heidi Leineweber, and Consuelo and her family, please know that it is your giving that has rescued them from the point of desperation to where they now can see a future filled with positives.
In some circles, that would qualify you as a good samaritan. But to me you’re more than that. You have done something heroic. In the face of incredible odds, you have stepped up because you care about people, and your community.
Thank you!
Christine Wood Executive Director
You've got the power!
Your help with their utility bills was a life-saver for this family
Life can be overwhleming for young families, particularly when the unexpected happens. Thank goodness for generous people like you who are always ready to come to their rescue.
Many low-income families are just one emergency from financial ruin.
That's where David and Allison found themselves after complications from the birth of their second child forced Allison to take six weeks off of work without pay.
Even before the birth of their son, this hard-working young couple was barely making it from one month to the next. Then their little boy was born with a congenital heart defect, and a routine two-day hospital stay turned into six weeks in intensive care.
Without two incomes, David and Allison quickly fell behind on their bills and got a notice from the power company that their electricity was about to be turned off.
Making the shut-office notice doubly serious: their newborn required around-the-clock monitoring on several pieces of home medical equipment — including an energy-draining infant oxygen machine.
For a while, all seemed lost. Then you came through and, with the help of other caring friends, helped this family catch up with their electric bill, which by that time had climbed to almost $600.
Eighteen months later, we’re happy to report that the family is doing better, and their young son no longer requires around-the-clock monitoring. “He’s a fun little guy,” his mother beams.
It wasn’t so long ago that this family was facing the real possibility of losing their electricity and ending up on the streets. But your kindness rescued them just in the nick of time.
Thank you for using your compassion to light up their world!
Reporting from SEATTLE CHILDREN’S HOSPITAL
Drugs lost their stranglehold on Josh, thanks to you
One smart move led to a brand new life
Josh needed a new beginning.
Only 18, he was already hooked on heroin and crystal meth. He tried going through rehabilitation in Utah but sobriety proved elusive. That’s when he headed for Las Vegas in search of a new start — and was introduced to the organization Street Teens.
Homeless and addicted, Josh knew he didn’t have many options. So he swallowed his pride, asked for help, and got it, thanks to you and our community partners in southern Nevada.
The first thing Street Teens did for Josh was get him off the streets. Once he knew he had three nutritious meals a day and a safe place to sleep at night, he turned his attention to going back to school and finding steady work.
Today, Josh has a part-time job, is a full-time student and, perhaps most important, is taking back control of his life.
Because you made his success possible, Josh wants you to know,
“I will never forget you. The love and support you gave me will forever stay in my heart.”
It’s because of your generosity that Josh is living drug-free, and care-free. Isn’t it amazing the difference your kindness makes?
Reporting from STREET TEENS, Las Vegas, Nevada
Without your support, these students’ hands-on cooking class would have been eliminated.
How you became this teacher's best friend
Heidi Leineweber is a school teacher who’s not afraid of a fight…at least when that fight has to do with the education her students receive.
For Leineweber, who is constantly faced with dwindling school budgets, it’s not about cutting the core classes like math, English and science. It’s more about how to keep important electives that give kids real-world experience, like food programs and auto and metal shop.
“Hands-on learning is one of the most effective methods of teaching,” Leineweber says.
“For many vulnerable children, these classes provide skills they’ll carry with them throughout their lifetime.”
That’s one reason why Leineweber is so excited about the support you have offered her students at Franklin High School in Portland. Because of you, classes like her popular food program are not only off the chopping block, but thriving.
“Together, we are keeping children in school where they belong, we are continuing to raise the graduation rate, and we are developing children to be confident, self-reliant, and ready to tackle life in this ever-changing century we live in.”
The children of today are the leaders of tomorrow. And because of your generosity, they’re being equipped to face the challenges of the future head-on, in both creative and innovative ways.
Thank you for strengthening families, and showing them a future that can be filled with hope.
Reporting from FRANKLIN HIGH SCHOOL, Portland, Oregon
You came to their rescue … and turned this family’s despair into joy.
Last Christmas, Consuelo and her kids found a new holiday hero: YOU!
Imagine how difficult it would be if you couldn’t provide Christmas presents for your kids. On top of that, imagine not having anyplace to stay, and facing the real possibility of your family spending Christmas Eve in your car with four kids squeezed into the back seat.
That was the horrible prospect Consuelo and her husband, Carlos, were facing last December…until you came to their rescue and turned this family’s despair into joy, just in time for Christmas morning!
Your kindness not only provided them with a week’s stay at a local motel — so they had a warm, dry place to enjoy the holidays — but also armloads of toys for the kids.
Consuelo and Carlos have now gone back to work and are supporting themselves. But they will always remember Christmas 2013. Because what could have been a disaster turned out to be a celebration they’ll never forget. All because of your compassion.
Reporting from THE FORGOTTEN CHILDREN’S FUND, Mount Vernon, Washington
You make your community a better place to live with each contribution.
Click here to DONATE to help low-income homeless families by providing shelter, clothing, children's programs, emergency assistance, and other life-changing help.
Saturday, May 3, marks the twenty-eighth anniversary of an event that is a touchstone for our company, the University of Washington, and the Seattle Yacht Club. The Windermere Cup, held annually on the first day of boating season, is both an international sporting event and an opening day celebration, followed by the world’s largest boat parade. But more than that, it’s a celebration of camaraderie, teamwork, and a commitment to excellence.
The camaraderie is everywhere you look: on the banks of the Montlake Cut, where Seattle residents and visitors from around the world flock to the University of Washington campus; and on the water, where great athletes join together to do what none of them could do individually. Thousands of people coming together for a common cause. That, in and of itself, is powerful stuff.
But what we find most remarkable about this sport is the teamwork. Though it may look easy from the sidelines, rowing is a physically demanding full-body sport. Rowers practice long hours, starting before dawn and ending after sunset, both on the water and in the gym. As Daniel James Brown points out in the book, The Boys in the Boat, “Rowing is perhaps the toughest of sports. Once the race starts, there are no time-outs, no substitutions. It calls upon the limits of human endurance.”
A crew boat can only race if all eight members plus the coxswain show up, and they can only perform as well as the weakest among them. There are no superstars in crew. It’s one for all, and all for one. So they leave their personal issues at home and push themselves to the limit, every time, for the love of the team.
It’s that commitment to excellence, seen on the face of every rower on every shell at the Windermere Cup that makes us proud to sponsor this event each year. It reminds us of our own guiding principles at Windermere: strong relationships built on trust, goodwill, and mutual respect; a spirit of teamwork that makes us more successful as a whole than we are individually; and a ceaseless commitment to excellence and unparalleled service.
Whether you add a new bright color, paint a pattern, or install decorative wallpaper, creative walls are an easy and exciting way to enhance your space.
Freshen up your space with the unexpected. Install decorative tiles, wallpaper, or paint the ceiling a different color. Or think outside the box and add sculptural elements.
Color is big this season! If you cannot paint your walls or ceiling, add a pop of color by choosing some statement furniture pieces to add color and interest to your room.
Over the last few years, tile has really become a fashion item for the home. Check out these styles when considering a backsplash or a bathroom renovation.
If you don’t have large statement art to fill a blank wall, consider curating your own gallery wall. You can alter the look for a modern space with uniform frames and images, or you can go eclectic with mixed frames and art styles.
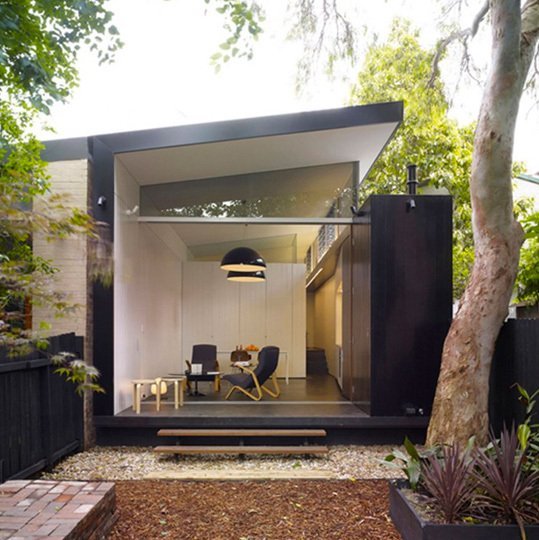
Are you fascinated about downsizing? Do you love small places? Does a simple and serene ambiance sound like music to your ears? Then hop on the bandwagon and get yourself a ‘tiny house’ because we all know the best things come in small packages.
What’s a tiny house? Tiny houses have recently hit the real estate market by storm. The to-go models typically range from 100-175 square feet, while the larger, more permanent cottage styles are usually around 250 to 500 square feet. With a multitude of floor plan choices that include full kitchens and bathrooms, heating, AC, and a reasonable range of prices, a tiny house couldn’t be more practical.
What tiny house are you? The best part about tiny homes is that you get to pick whichever one compliments your lifestyle and needs the most. Are you more of a beach house or cabin in the woods type of person? What about a pool house for your backyard or an art or yoga studio? Or maybe you’re guilty of always wishing there was somewhere else for your mother-in-law to stay while she’s in town. On the other hand, if you’re looking for something less permanent, then a to-go model might be more your speed. You can grab your house whenever you are feeling an itch of wanderlust and head out on the open road. You can park it near the coast or somewhere concealed for a relaxing and quiet weekend. If being on the water is more your thing, there are even tiny floating homes.
Who owns one? The small, but rapidly growing number of tiny house homeowners can be found all over the country. People are shedding their square footage and downsizing from coast to coast. In 2013, the tiny home movement saw 2,600 residents, while 2014 currently has about 4,000 residents and growing. People are joining the tiny house movement for various reasons. Some want to downsize due to environmental or financial concerns, others are looking for more time and freedom in their lives. Having tiny homes encourages people to live beyond their own walls and spend more time in the outdoors and their community. Tiny homes have redefined the American dream by promoting quality over quantity.
If you think you might want a tiny house as your primary home, the only sacrifice is space; the gains however, are countless. Tiny homes come in all shapes and sizes and can be modern, minimal, or luxurious. These tiny homes are a fun and exciting endeavor to which you can easily add your own flavor. And because you can get a prefab tiny home delivered right to your door, the home buying process is as simple as the homes themselves.
We would like to extend a huge thank you to everyone who participated in the Windermere Foundation Charity Challenge! We had high expectations for this event, but were amazed by the more than 78,500 votes that were cast over the past three weeks.
So, without further ado, here are the winners of the Windermere Foundation Charity Challenge:
Western Washington: Hand-in-Hand with 50.8% of the votes
Each of these organizations will receive $25,000, for a total donation of $125,000 from the Windermere Foundation. We couldn’t think of a better way to celebrate the Windermere Foundation’s 25th anniversary and all that our agents and non-profit partners do to support our neighbors in need.

 Facebook
 X
X
 Pinterest
 Copy Link

 Mr. Gardner is a land use economist and principal with Gardner Economics and is considered by many to be one of the foremost real estate analysts in the Pacific Northwest.


 Drugs lost their stranglehold on Josh, thanks to you
 Without your support, these students’ hands-on cooking class would have been eliminated.
 You came to their rescue … and turned this family’s despair into joy.


")


