
 Facebook
 X
X
 Pinterest
 Copy Link
Q3 2023 Northwest Oregon and Southwest Washington Real Estate Market Update

The following analysis of select counties of the Northwest Oregon and Southwest Washington real estate market is provided by Windermere Real Estate. We hope that this information may assist you with making better-informed real estate decisions. For further information about the housing market in your area, please don’t hesitate to contact your Windermere Real Estate agent.
Regional Economic Overview
Employment growth in the Oregon counties covered by this report continues to slow. With 13,370 jobs added over the last 12 months, the growth rate was only .9%. Non-agricultural employment in Northwest Oregon is still down 11,690 jobs compared to its pre-COVID 2020 peak. That said, the jobless rate pulled back to 3.3% from 4.1% in the third quarter of 2022.
In the Southwest Washington market areas, the pace of job gains picked up a little. The areas covered by this report added 7,997 jobs over the past year, which represented an annual growth rate of 3.4%. Unemployment was 4.2%, which is up from the 5.2% level we saw in August 2022.
Northwest Oregon and Southwest Washington Home Sales
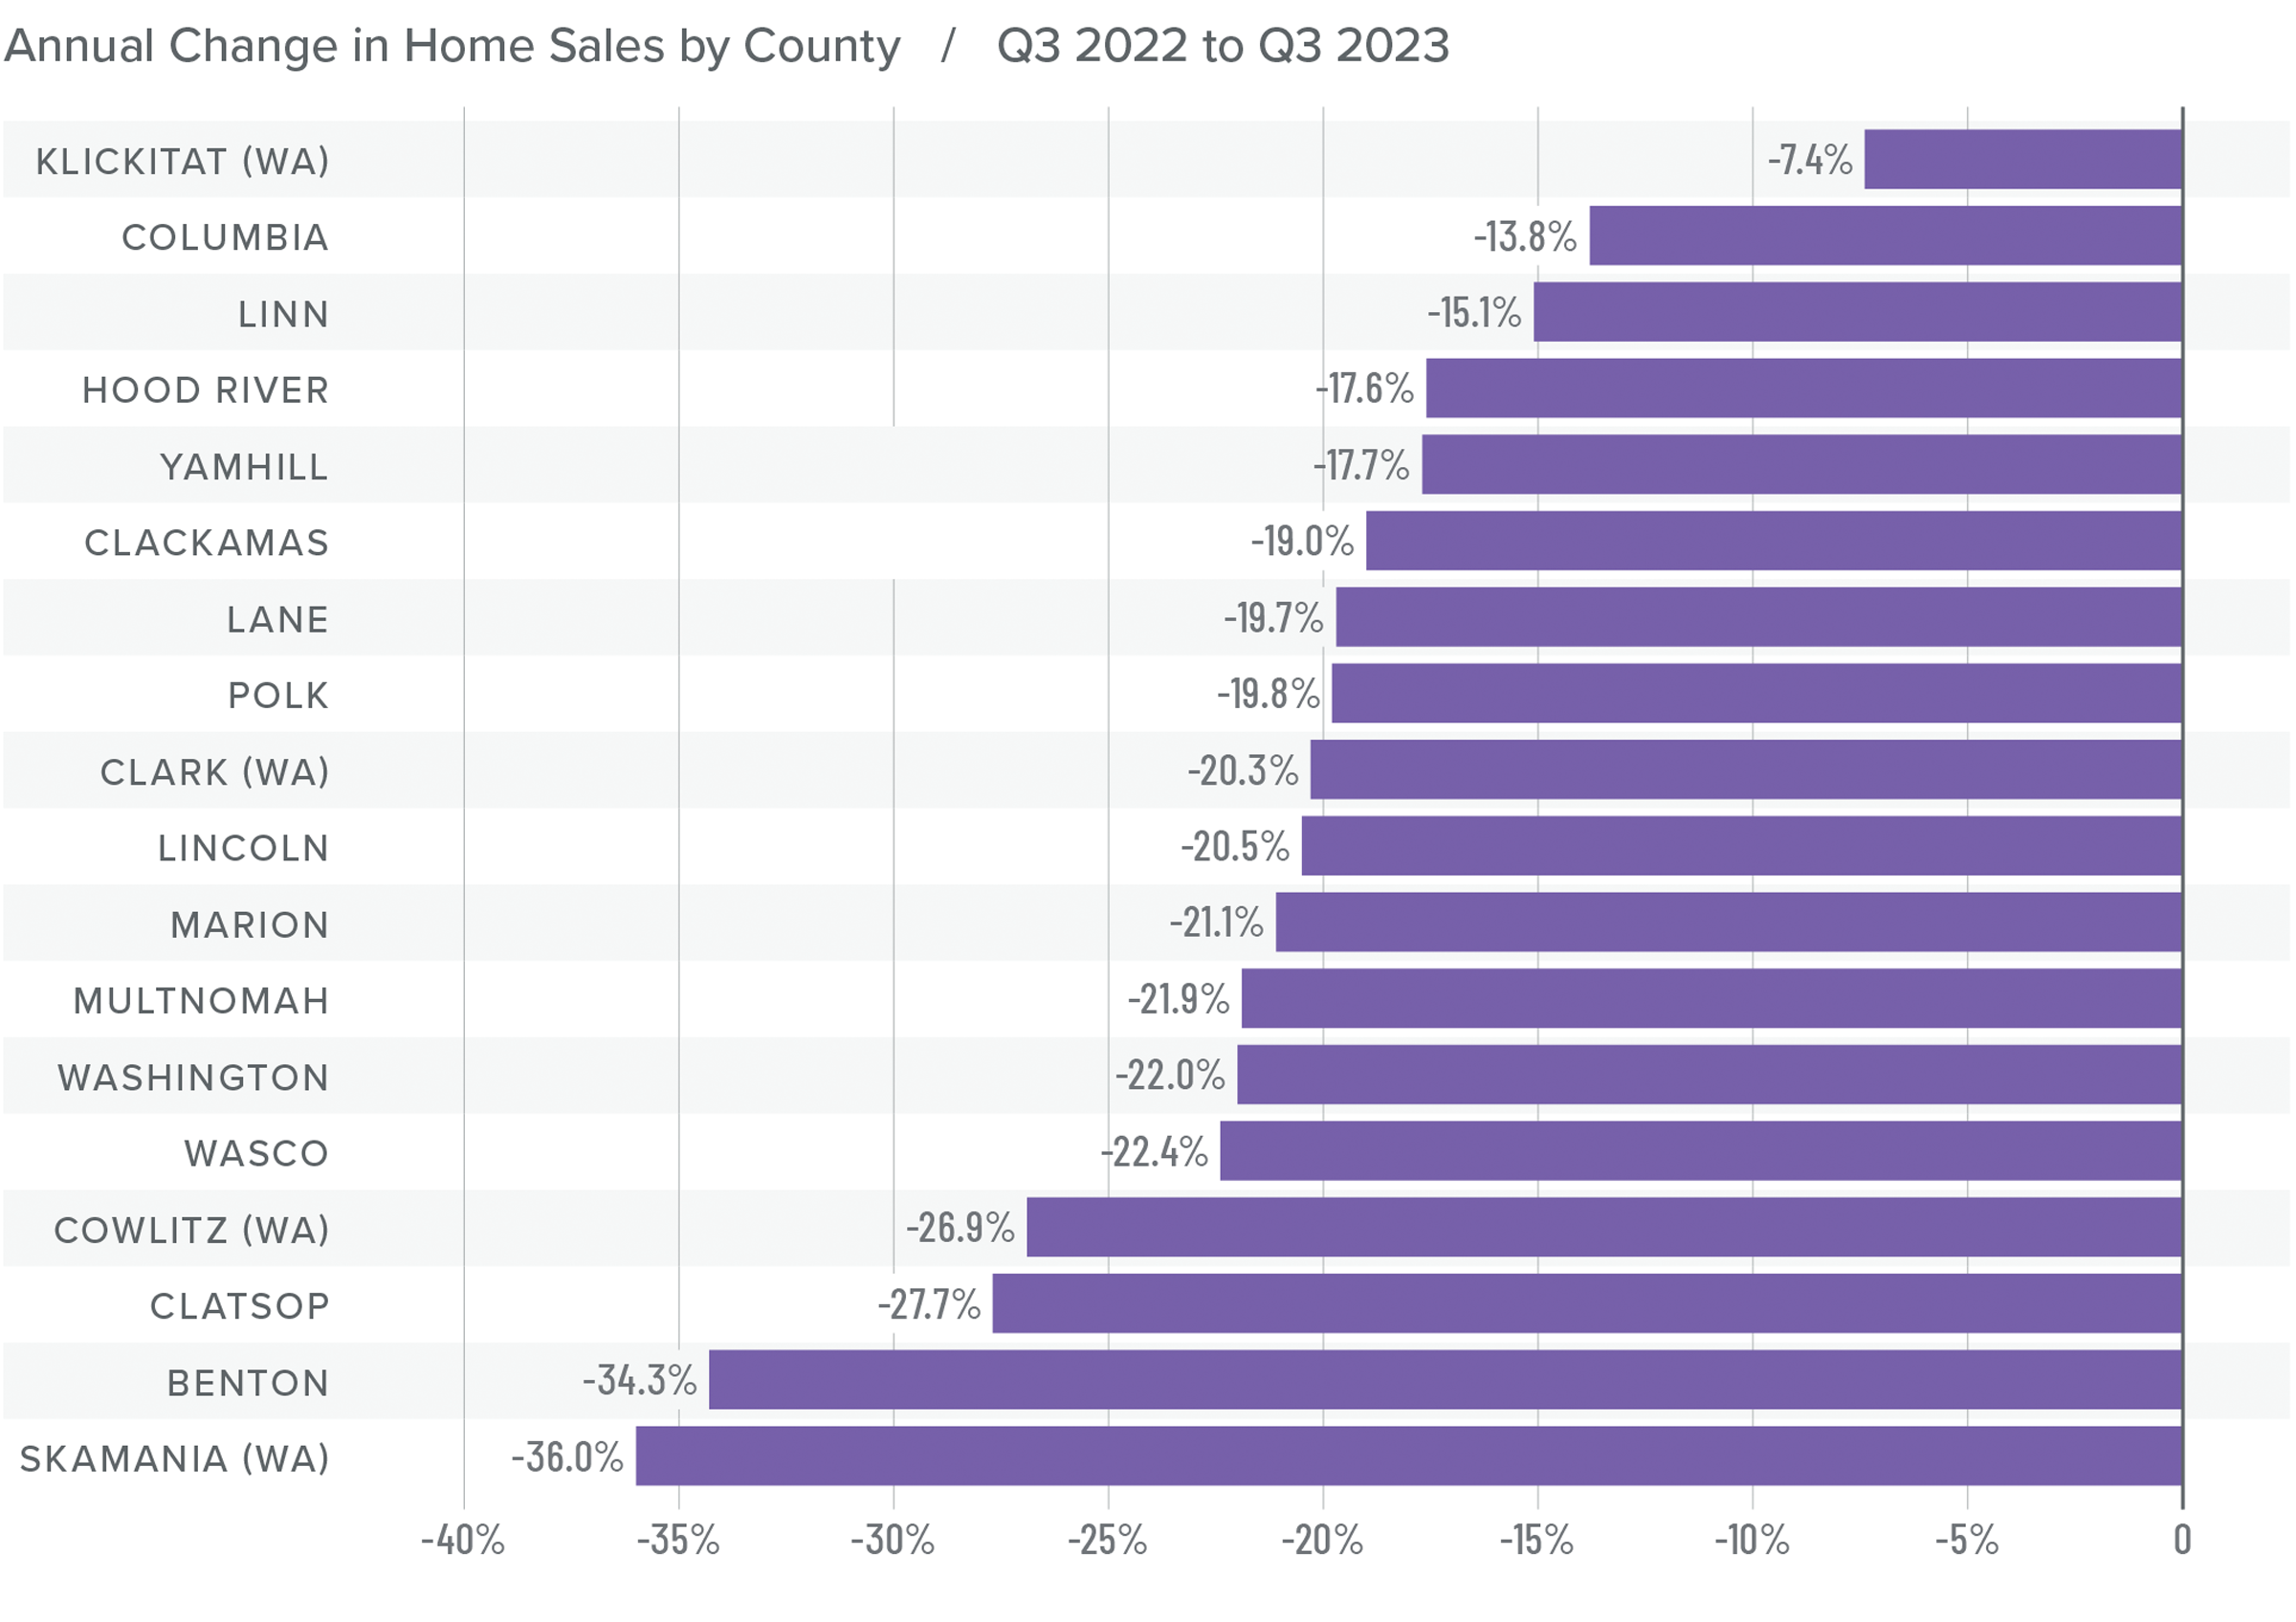
❱ In the third quarter of 2023, 10,279 homes sold. This was down 21% from the same period in 2022 and was 1.3% lower than in the second quarter of this year.
❱ Compared to the second quarter of this year, sales fell in eight counties but rose in ten. Klickitat and Hood River counties had significant growth; however, sales fell more than 10% in Lincoln, Skamania, and Wasco counties.
❱ Sales fell in every county compared to the third quarter of 2022, with significant declines in every county other than Klickitat.
❱ It appears as if higher mortgage rates are now starting to impact the market. Additionally, inventory levels did not rise in any of the counties in this report, which could also be a factor in slowing sales activity.
Northwest Oregon and Southwest Washington Home Prices
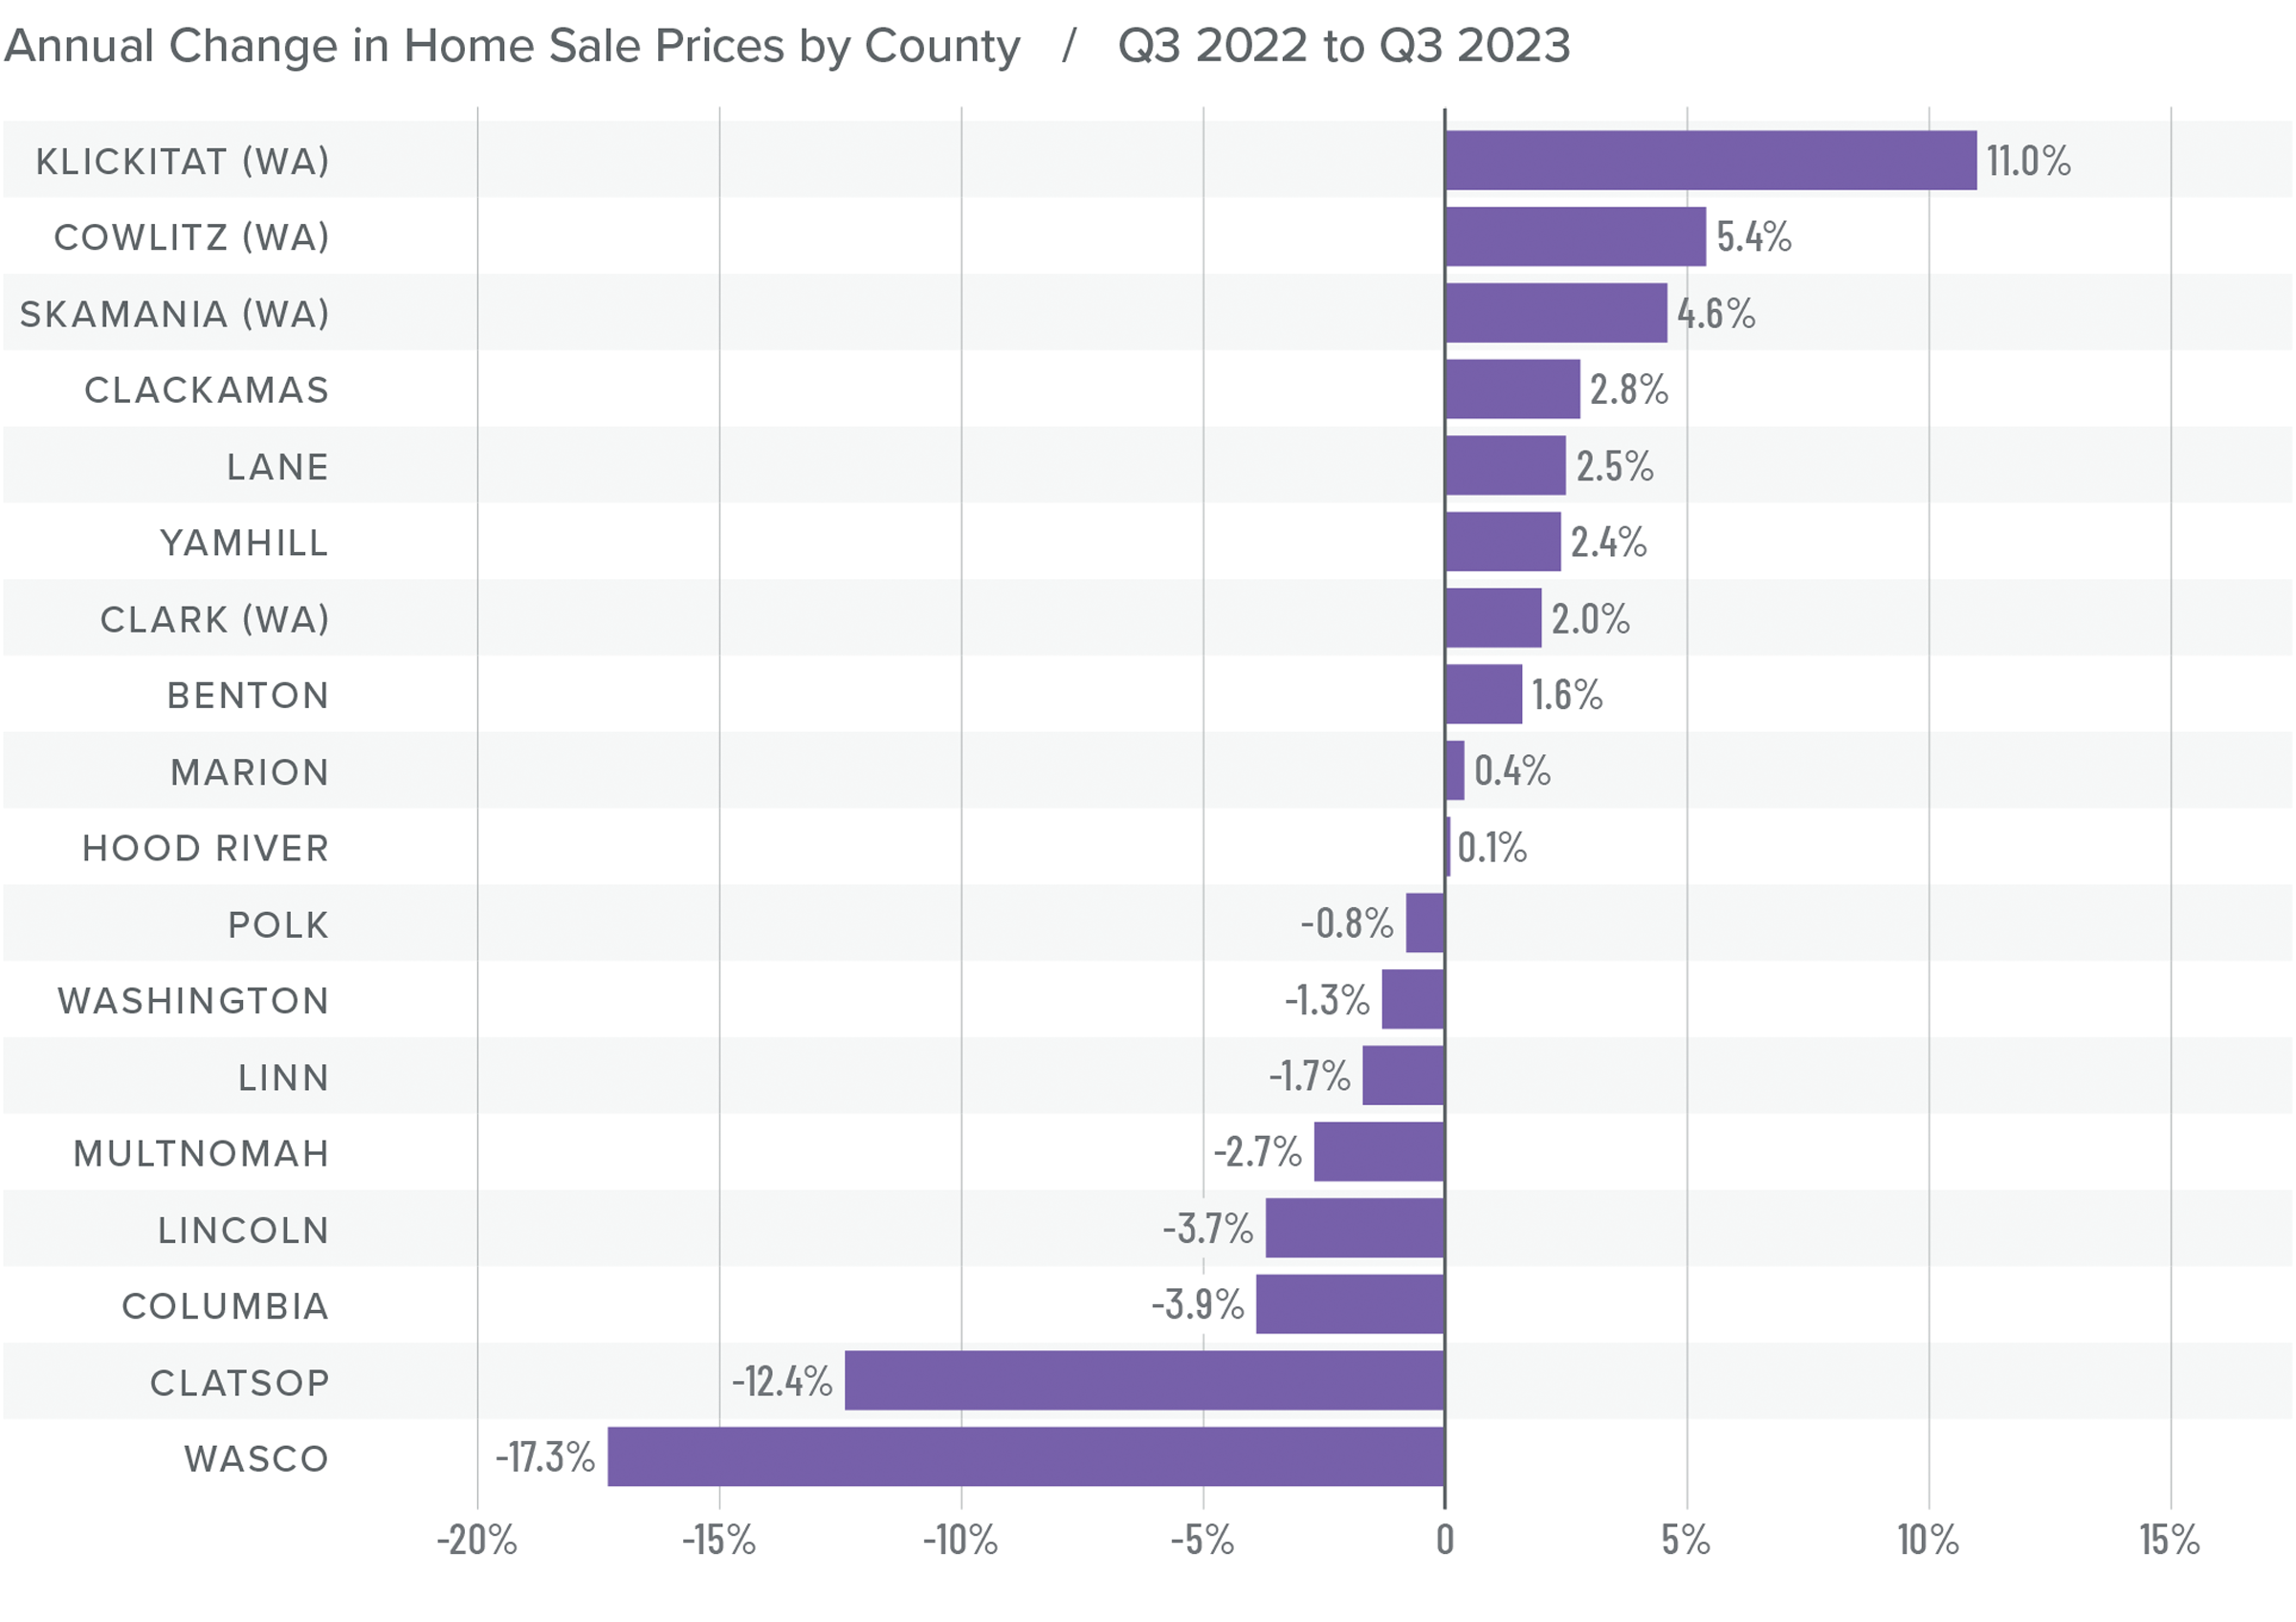
❱ The average price that a home sold for in the region fell .1% year over year and was essentially flat compared to the second quarter of 2023.
❱ On average, the median listing price of a home rose a modest 1.9% compared to the second quarter of this year, suggesting that home sellers are starting to be realistic about the impact higher mortgage rates are having on buyers.
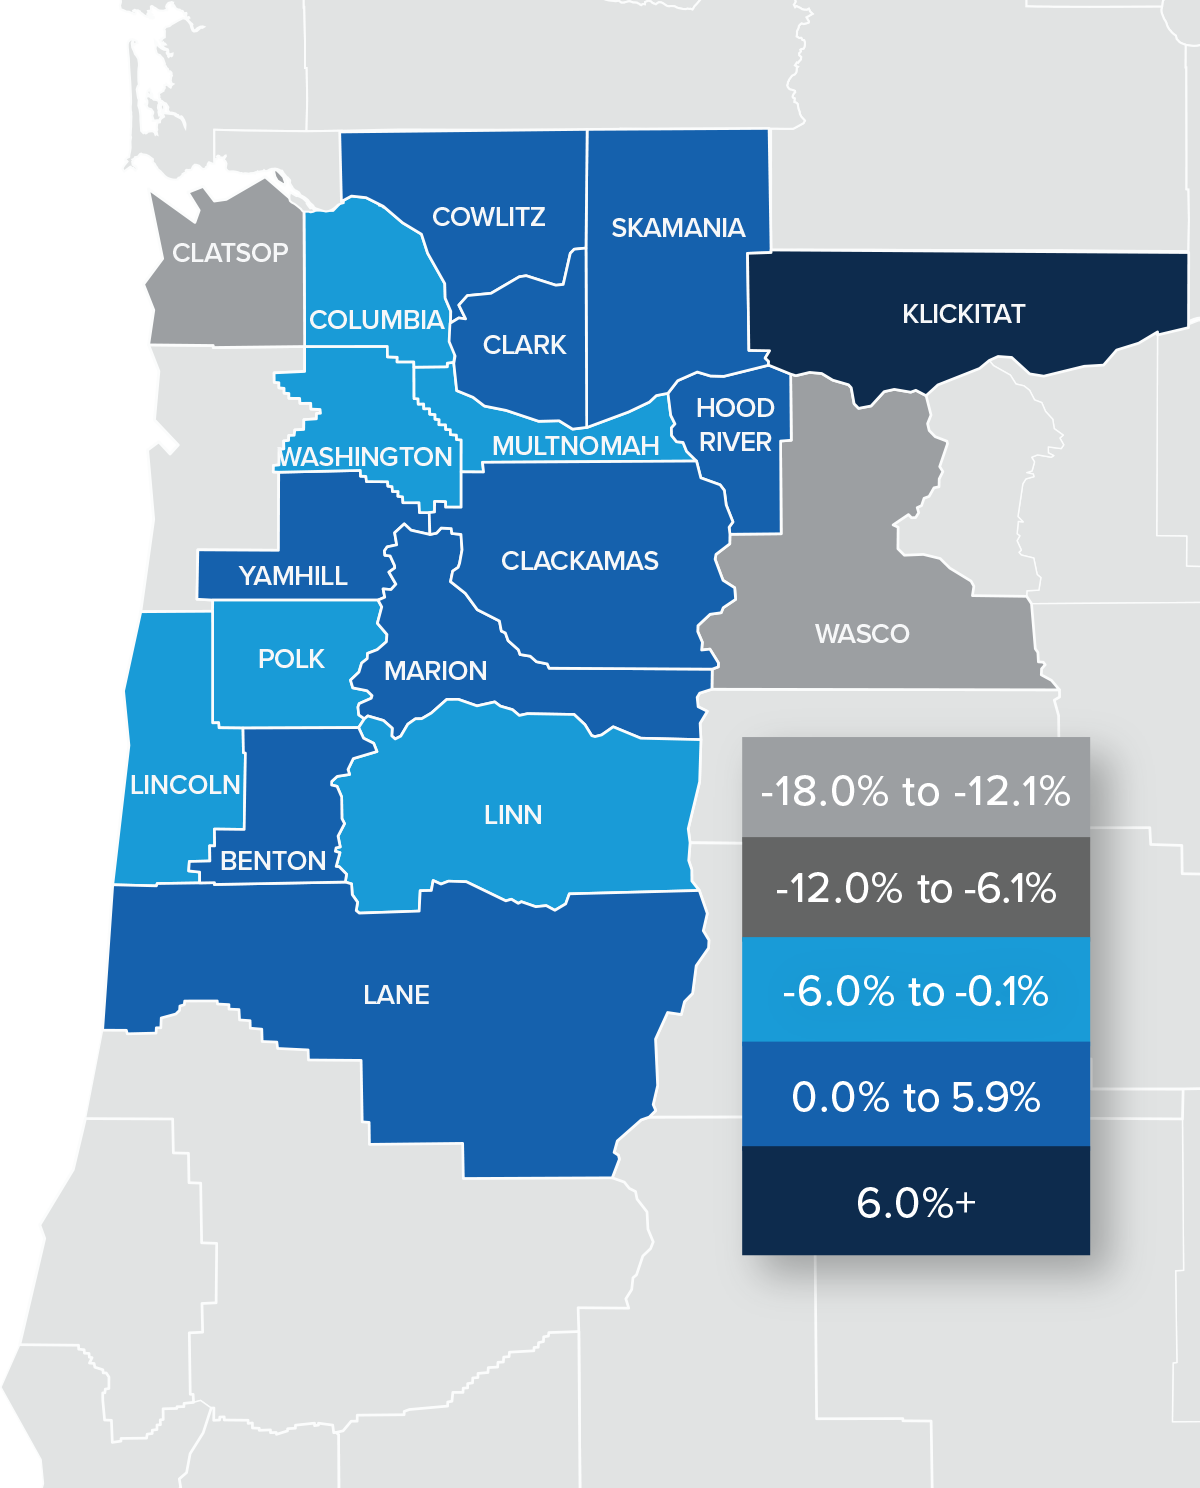
❱ Average sale prices rose in 10 counties compared to the third quarter of 2022, while eight saw prices fall. Wasco and Clatsop counties experienced fairly significant declines in prices, but these are relatively small markets where significant swings can occur. The same can be said when looking at markets where prices rose, with prices in Klickitat County up more than 10%.
❱ Price growth appears to have stalled out, which isn’t surprising given that mortgage rates were above 7% for almost the entire quarter. I expect home prices to remain fairly static for the fourth quarter as buyers and sellers wait to see where mortgage rates are headed.
Mortgage Rates
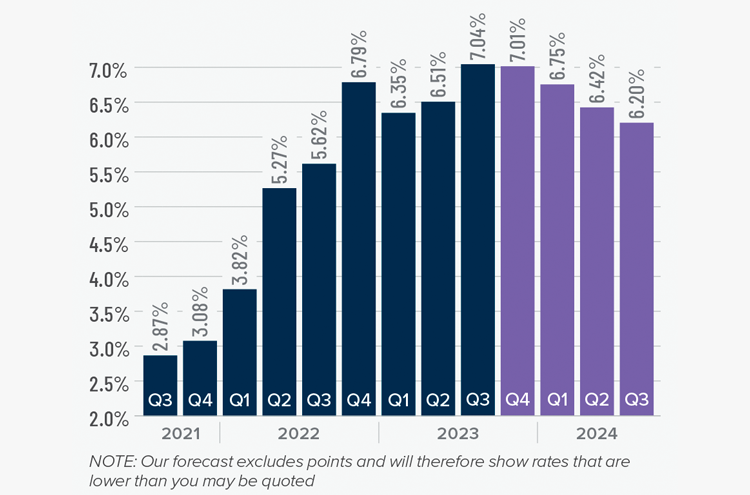
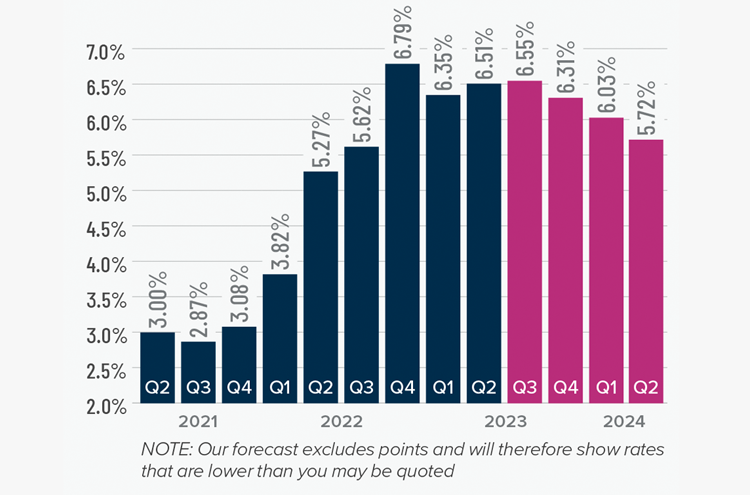
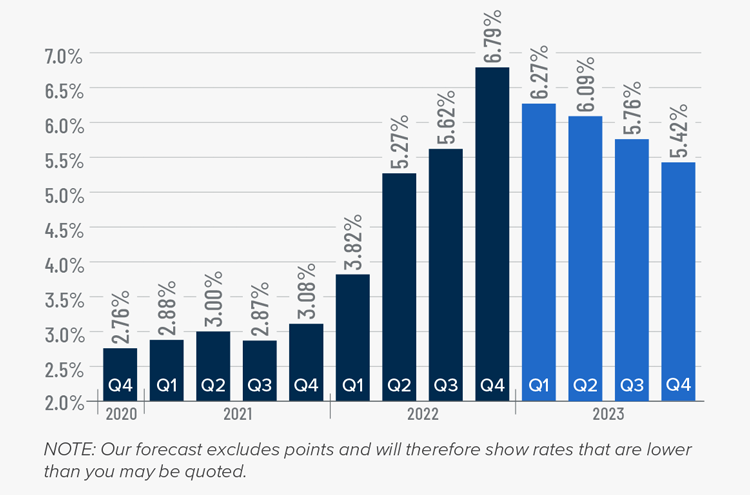
Mortgage rates continued trending higher in the third quarter of 2023 and are now at levels we have not seen since the fall of 2000. Mortgage rates are tied to the interest rate (yield) on 10-year treasuries, and they move in the opposite direction of the economy. Unfortunately for mortgage rates, the economy remains relatively buoyant, and though inflation is down significantly from its high, it is still elevated. These major factors and many minor ones are pushing Treasury yields higher, which is pushing mortgage rates up. Given the current position of the Federal Reserve, which intends to keep rates “higher for longer,” it is unlikely that home buyers will get much reprieve when it comes to borrowing costs any time soon.
With such a persistently positive economy, I have had to revise my forecast yet again. I now believe rates will hold at current levels before starting to trend down in the spring of next year.
Northwest Oregon and Southwest Washington Days on Market
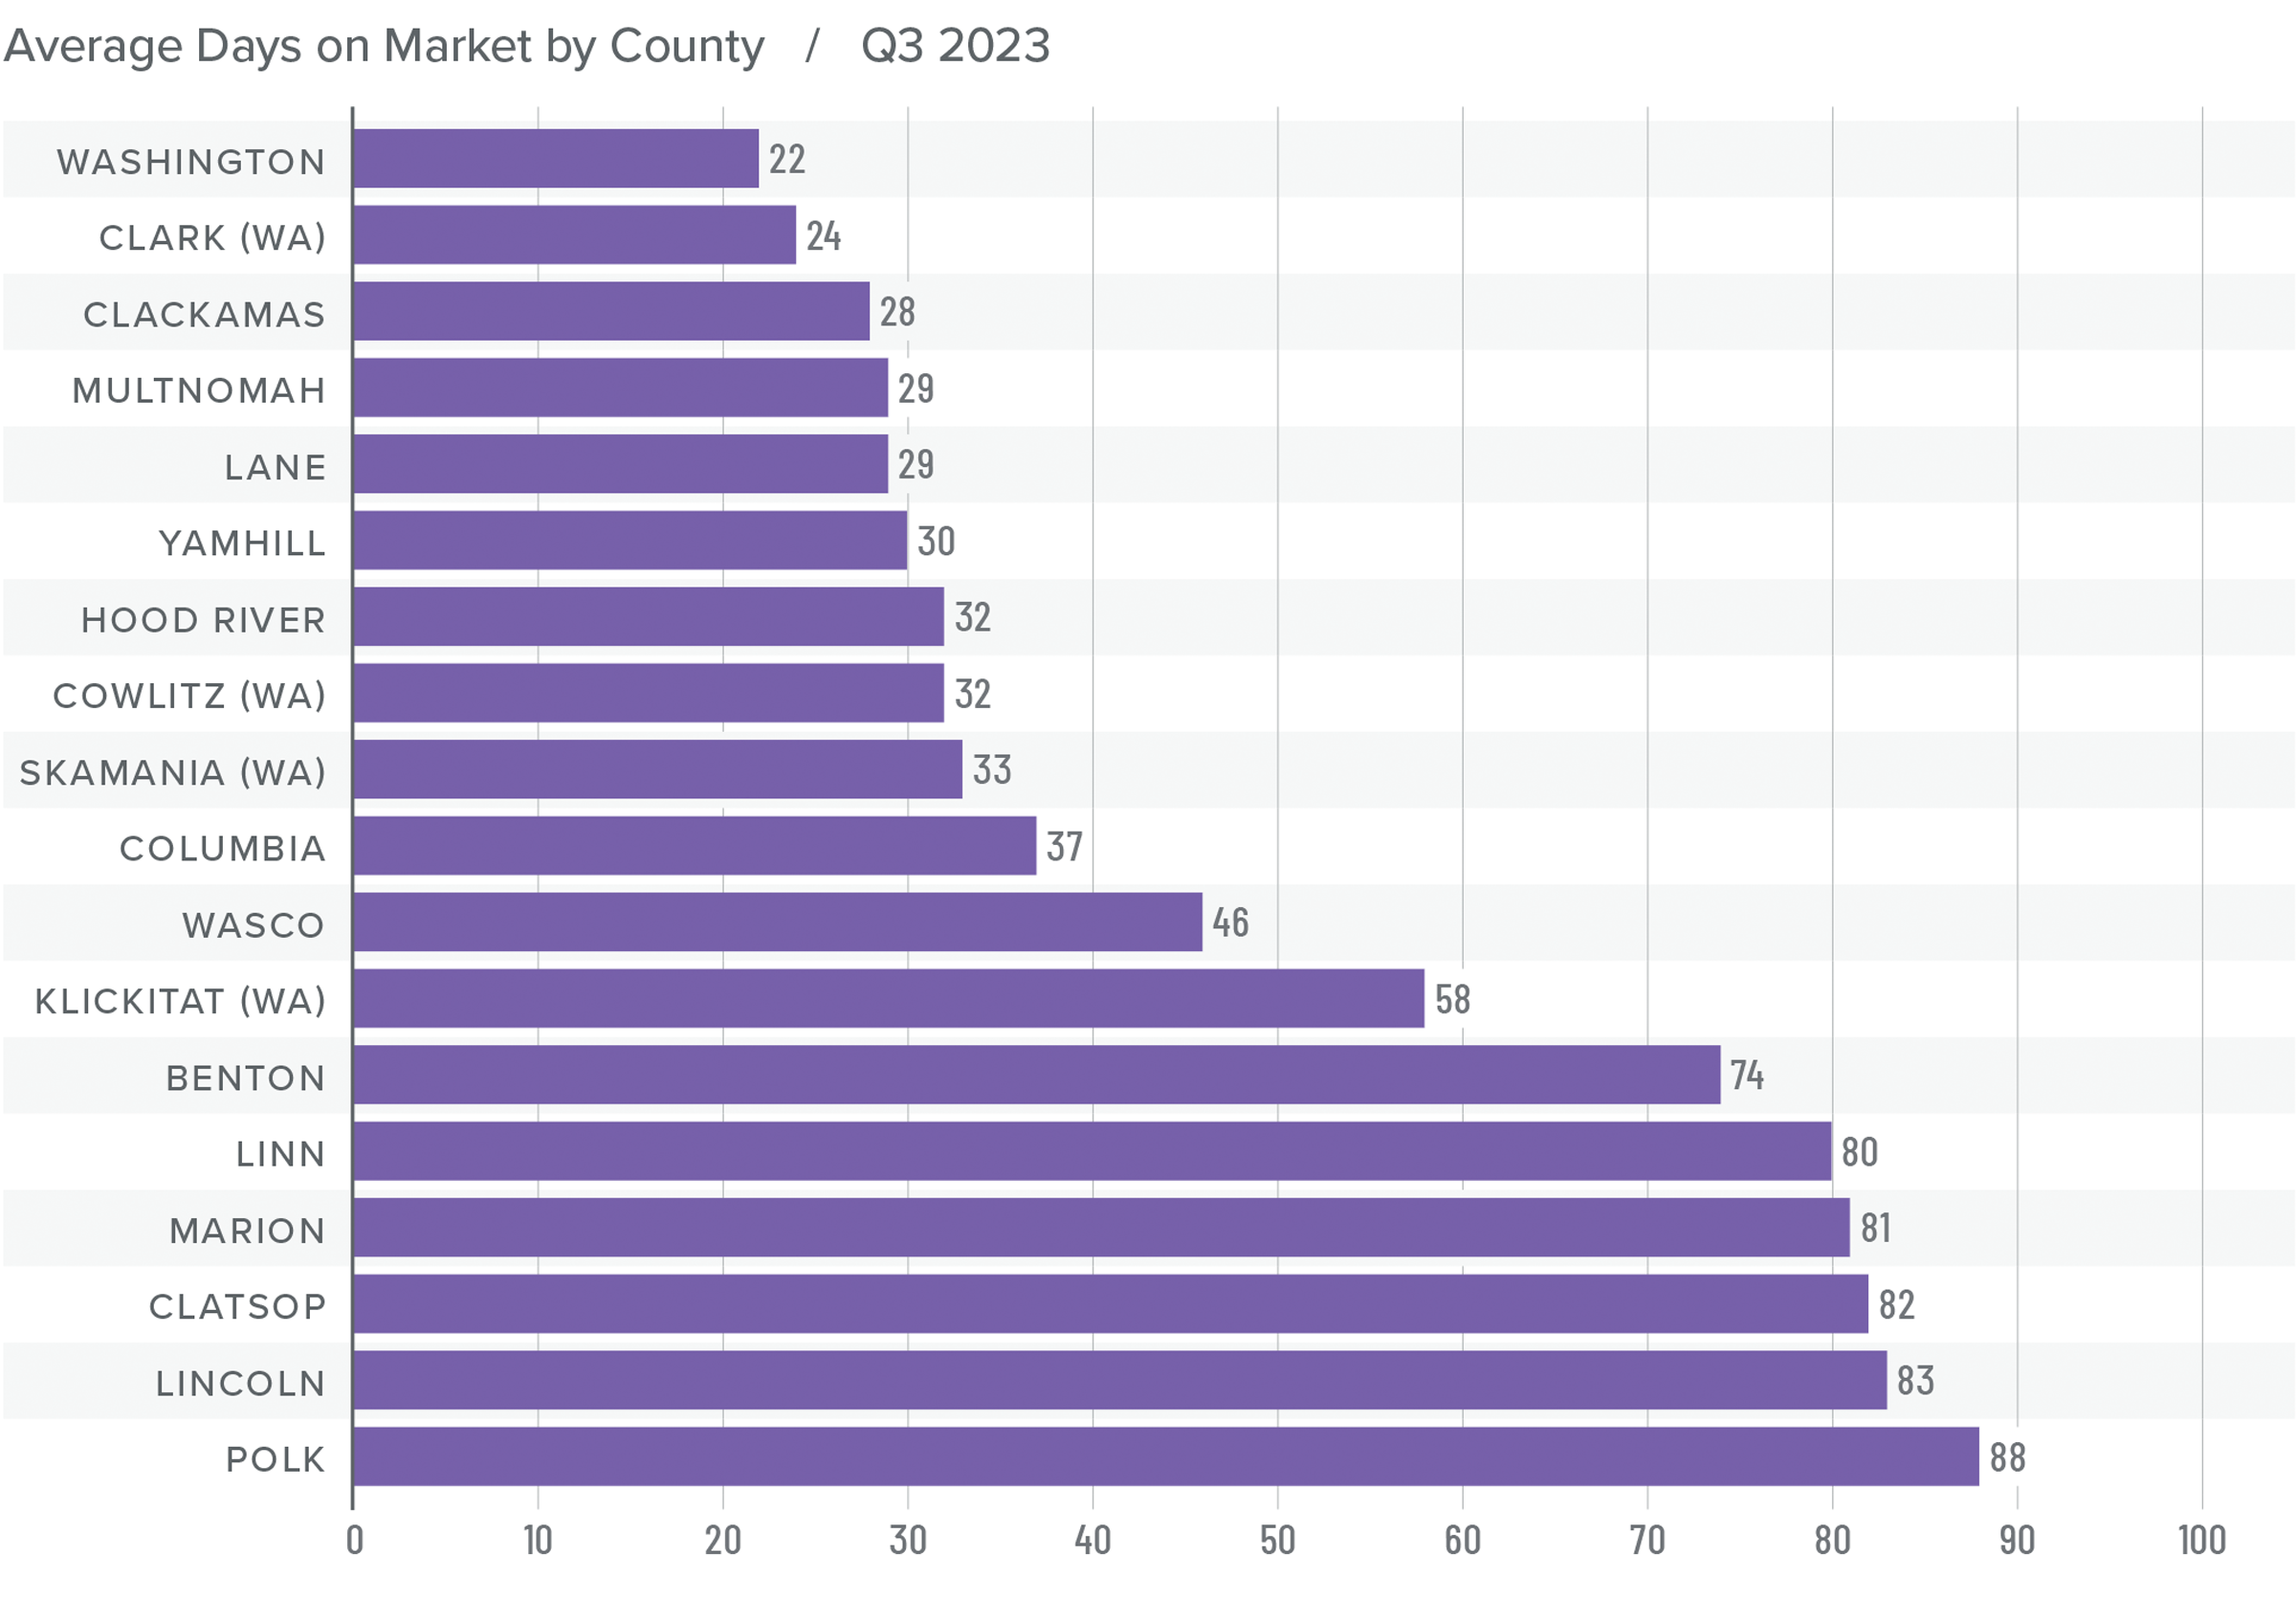
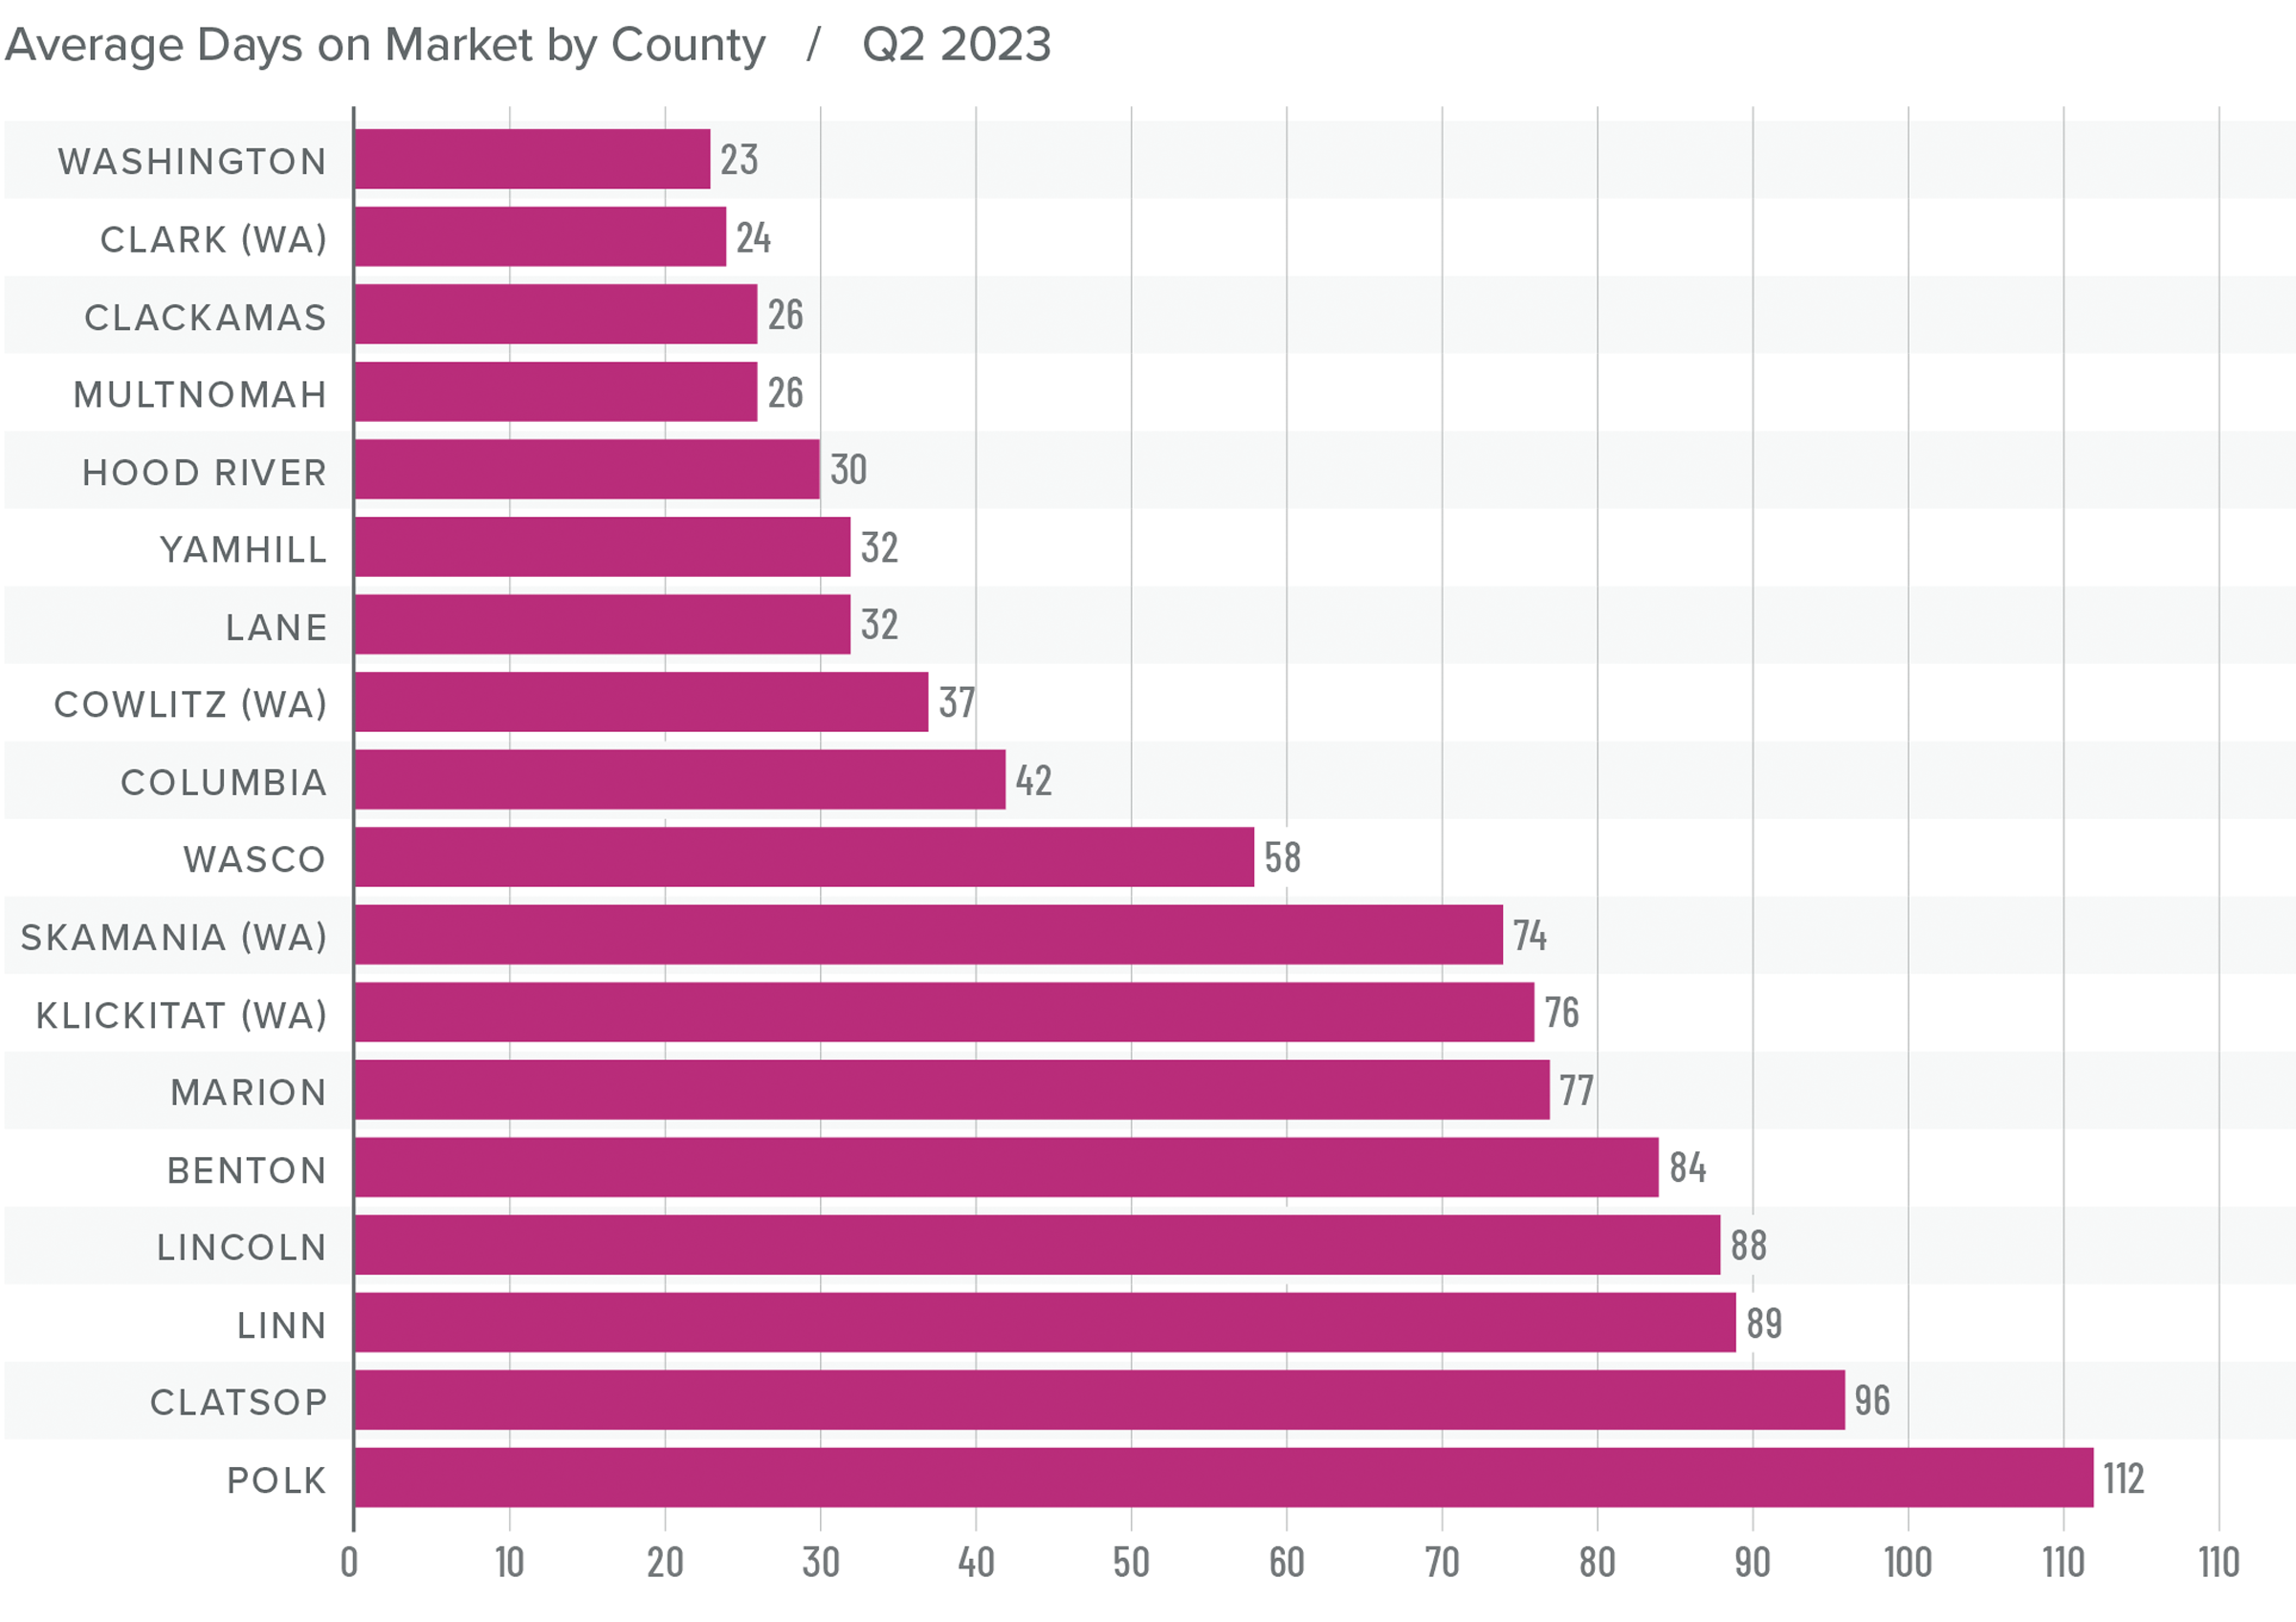
❱ The average time it took to sell a home in the third quarter of 2023 was 49 days.
❱ The average time it took to sell a home in the region rose eight days compared to the same period in 2022, but it took seven fewer days for a home to sell compared to the second quarter of 2023.
❱ Except for Benton and Skamania Counties, all counties in this report saw the length of time it took for a home to sell rise compared to the third quarter of 2022. Compared to the second quarter of 2023, market time fell in 13 counties. Days on market rose in Clackamas, Hood River, Marion, and Multnomah counties.
❱ The numbers seem to suggest that buyers are moving relatively swiftly when they do find a home that they want, even in the face of higher mortgage rates.
Conclusions
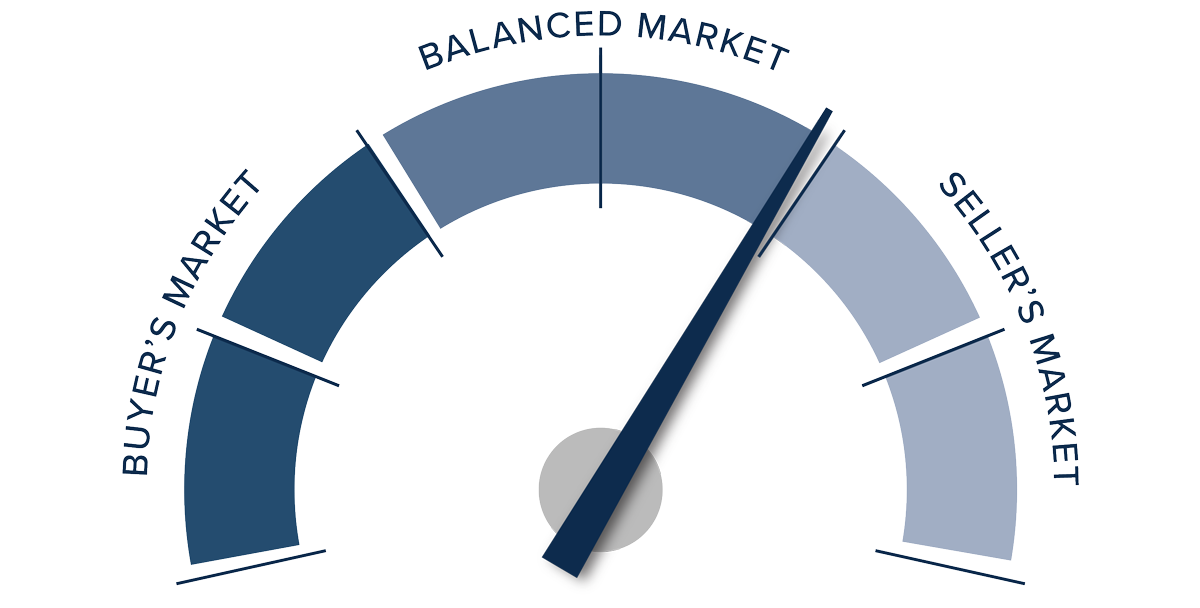
This speedometer reflects the state of the region’s real estate market using housing inventory, price gains, home sales, interest rates, and larger economic factors.
Although modestly lower home sales could suggest that buyers are in a better position when it comes to negotiating for a home, list prices, sale prices, and shorter market time favor home sellers.
In the second quarter market update, it was suggested that the market was returning to one that favors sellers and moved the needle accordingly. This is still the case, but mortgage rates remain a significant obstacle. Therefore the needle stays in the same position as last quarter: very slightly favoring sellers, but not by much.

Q2 2023 Northwest Oregon and Southwest Washington Real Estate Market Update

The following analysis of select counties of the Northwest Oregon and Southwest Washington real estate market is provided by Windermere Real Estate Chief Economist Matthew Gardner. We hope that this information may assist you with making better-informed real estate decisions. For further information about the housing market in your area, please don’t hesitate to contact your Windermere Real Estate agent.
Regional Economic Overview
Employment in the Oregon counties covered by this report continues to expand, though the pace of growth is slowing. As it stands, employment levels are still down 20,220 jobs from the 2020 pre-COVID peak. Over the last 12 months, employers added 15,990 new jobs, representing an annual growth rate of 1.1%. Unemployment in the region continues to improve. The 3.5% jobless rate we saw in the second quarter was marginally lower than the 3.6% rate during the second quarter of 2022. In the Southwest Washington market areas, the pace of job gains is also slowing, but the area added 6,719 jobs over the past year for an annual growth rate of 2.9%. Unemployment was 3.6%, which is an improvement from the first quarter, as the area saw its labor force fall modestly.
Northwest Oregon and Southwest Washington Home Sales
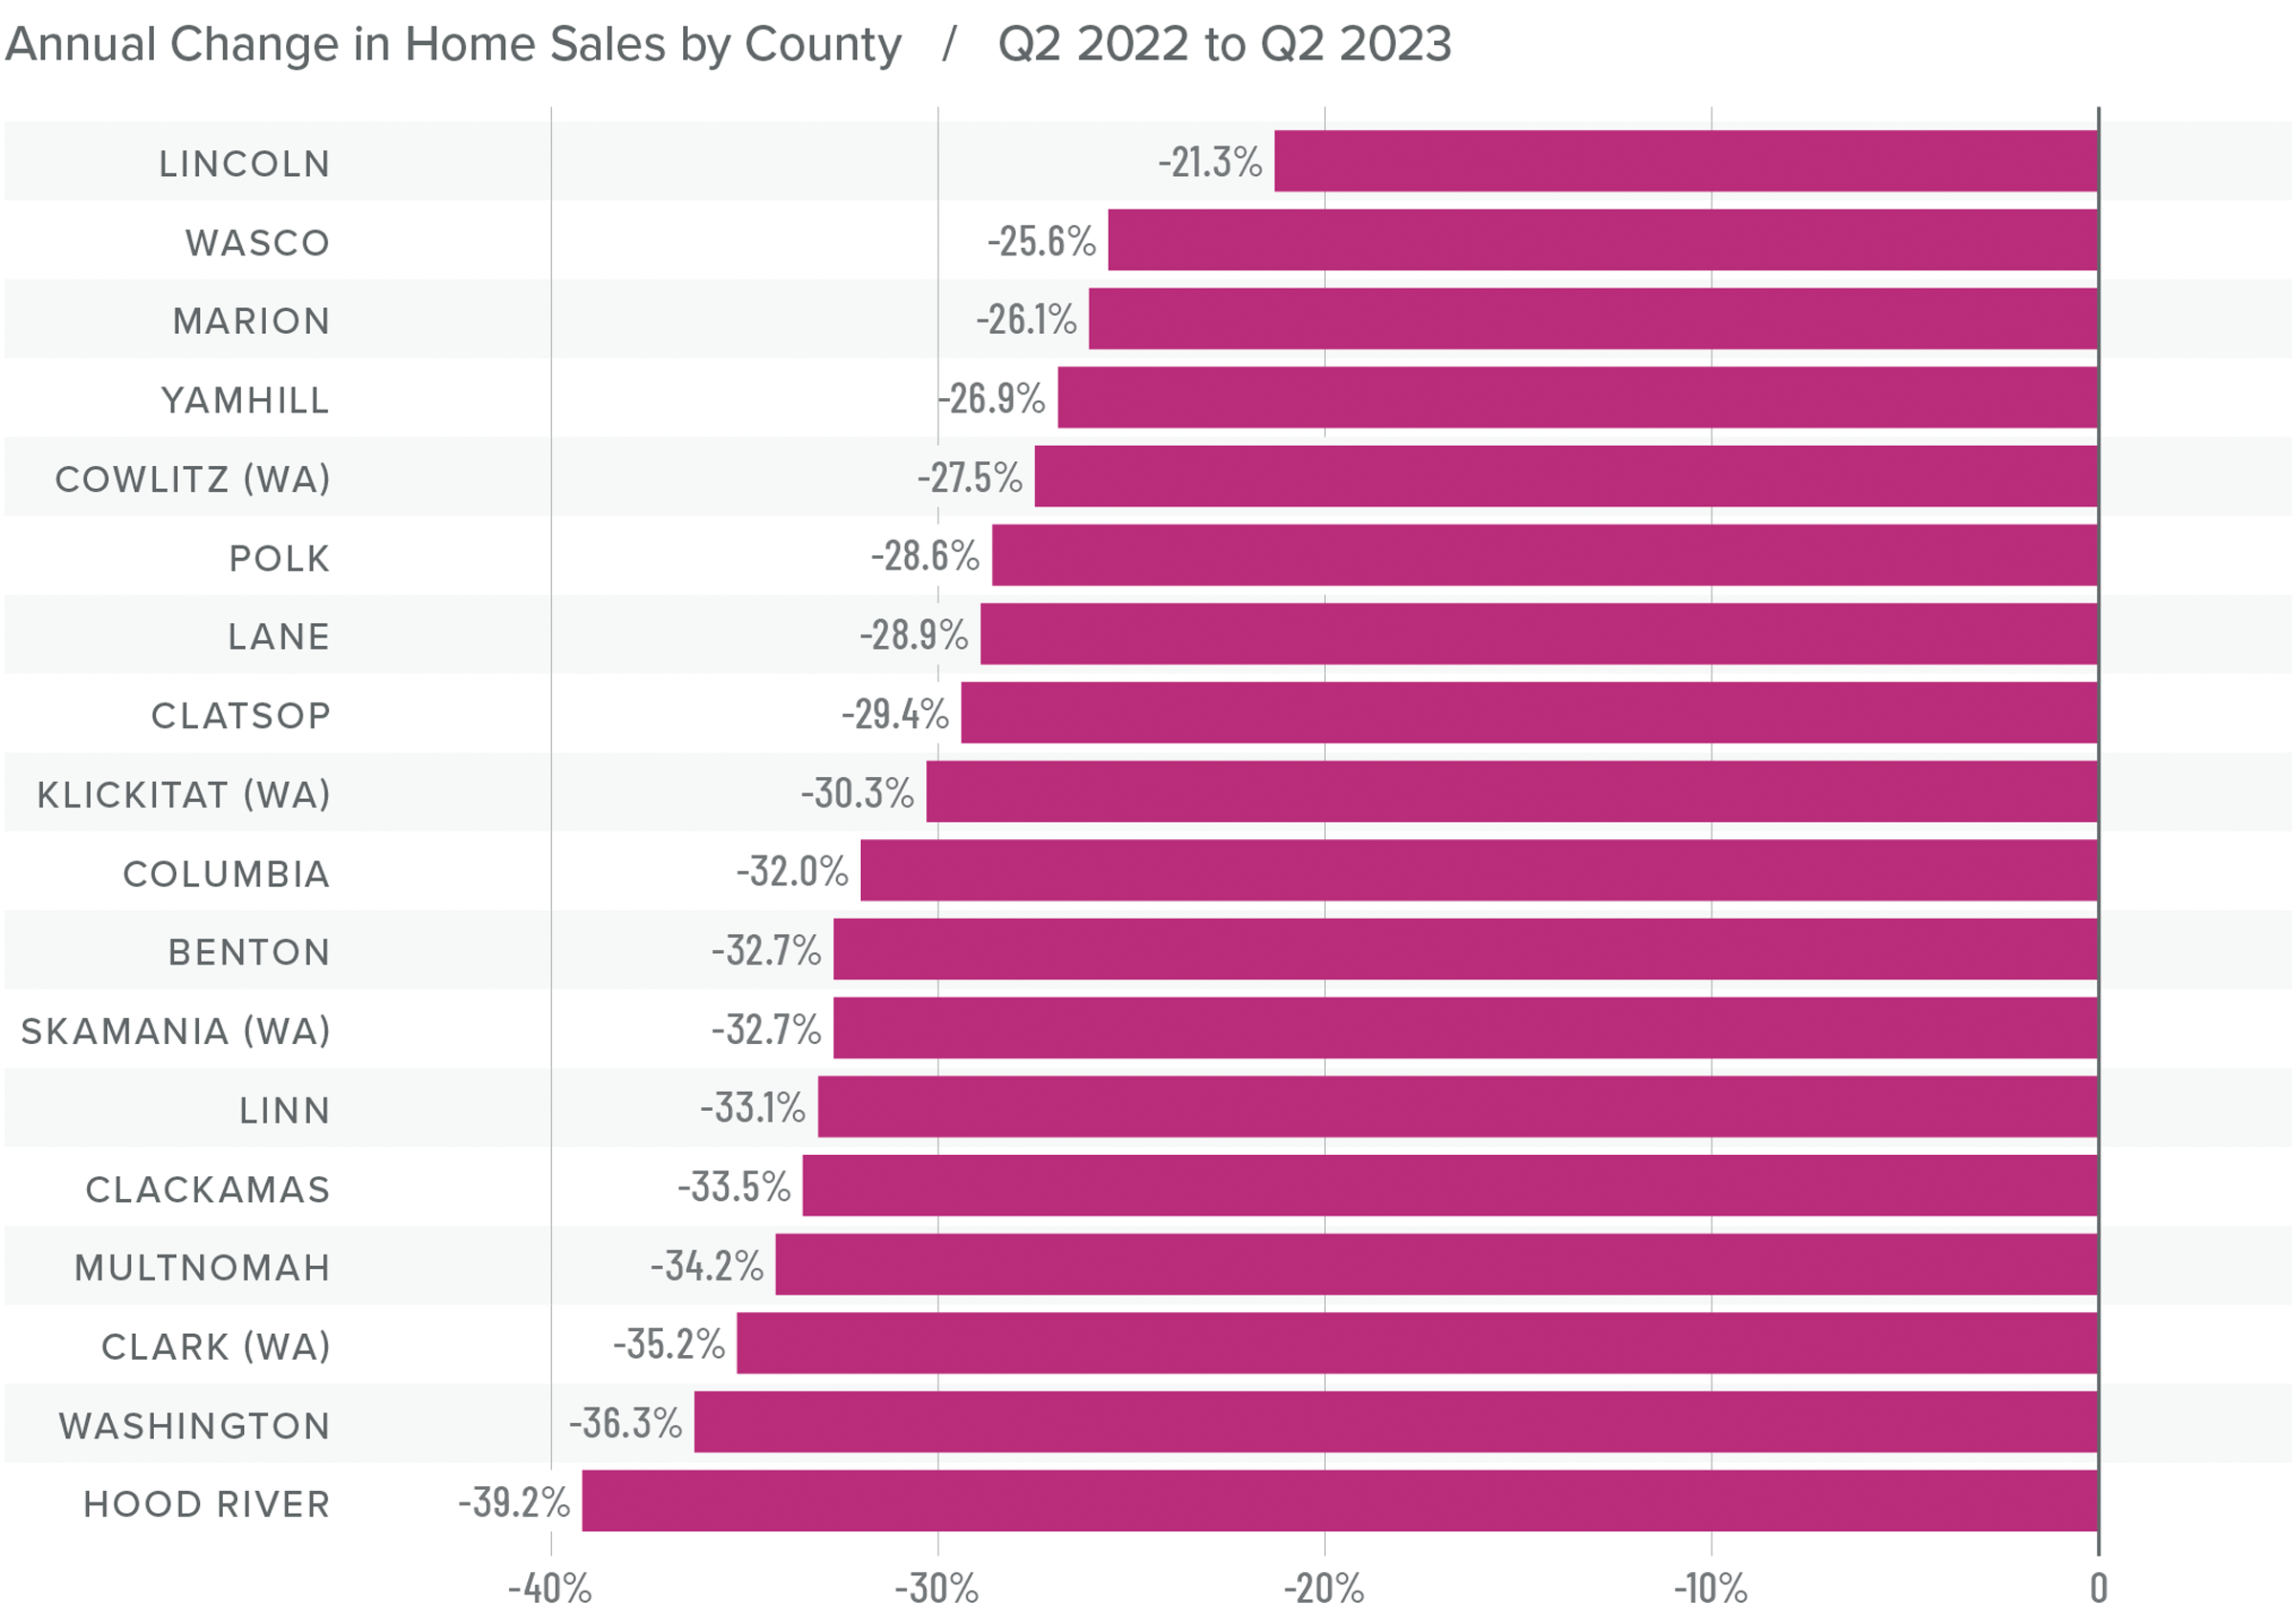
❱ In the second quarter of 2023, 10,286 homes sold. Although this was down 32.6% from the same period in 2022, sales were 37.3% higher than in the first quarter of the year.
❱ Higher sales can be attributed to an increase in the number of homes for sale. What was of particular interest was that sales managed to grow significantly even in the face of higher mortgage rates.
❱ Sales fell in every county compared to the same period in 2022, but all markets had more sales compared to the first quarter of 2023.
❱ It appears as if demand still exceeds supply, even with growing inventory levels in most markets.
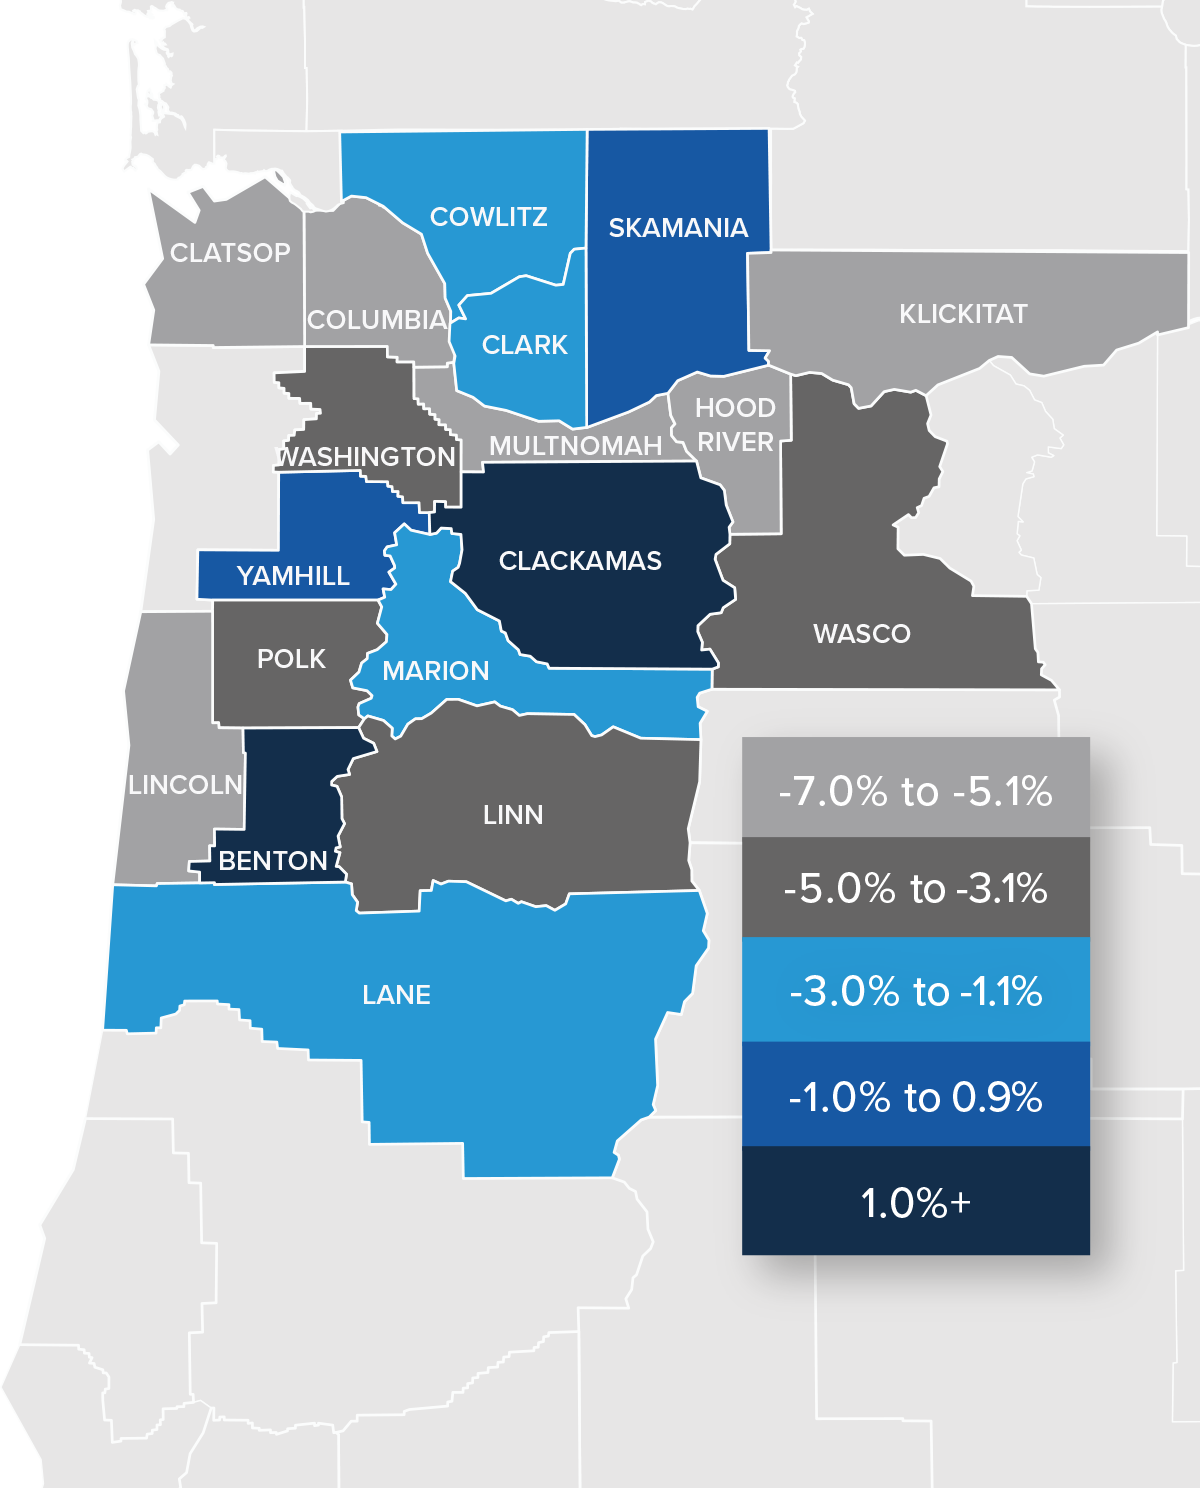
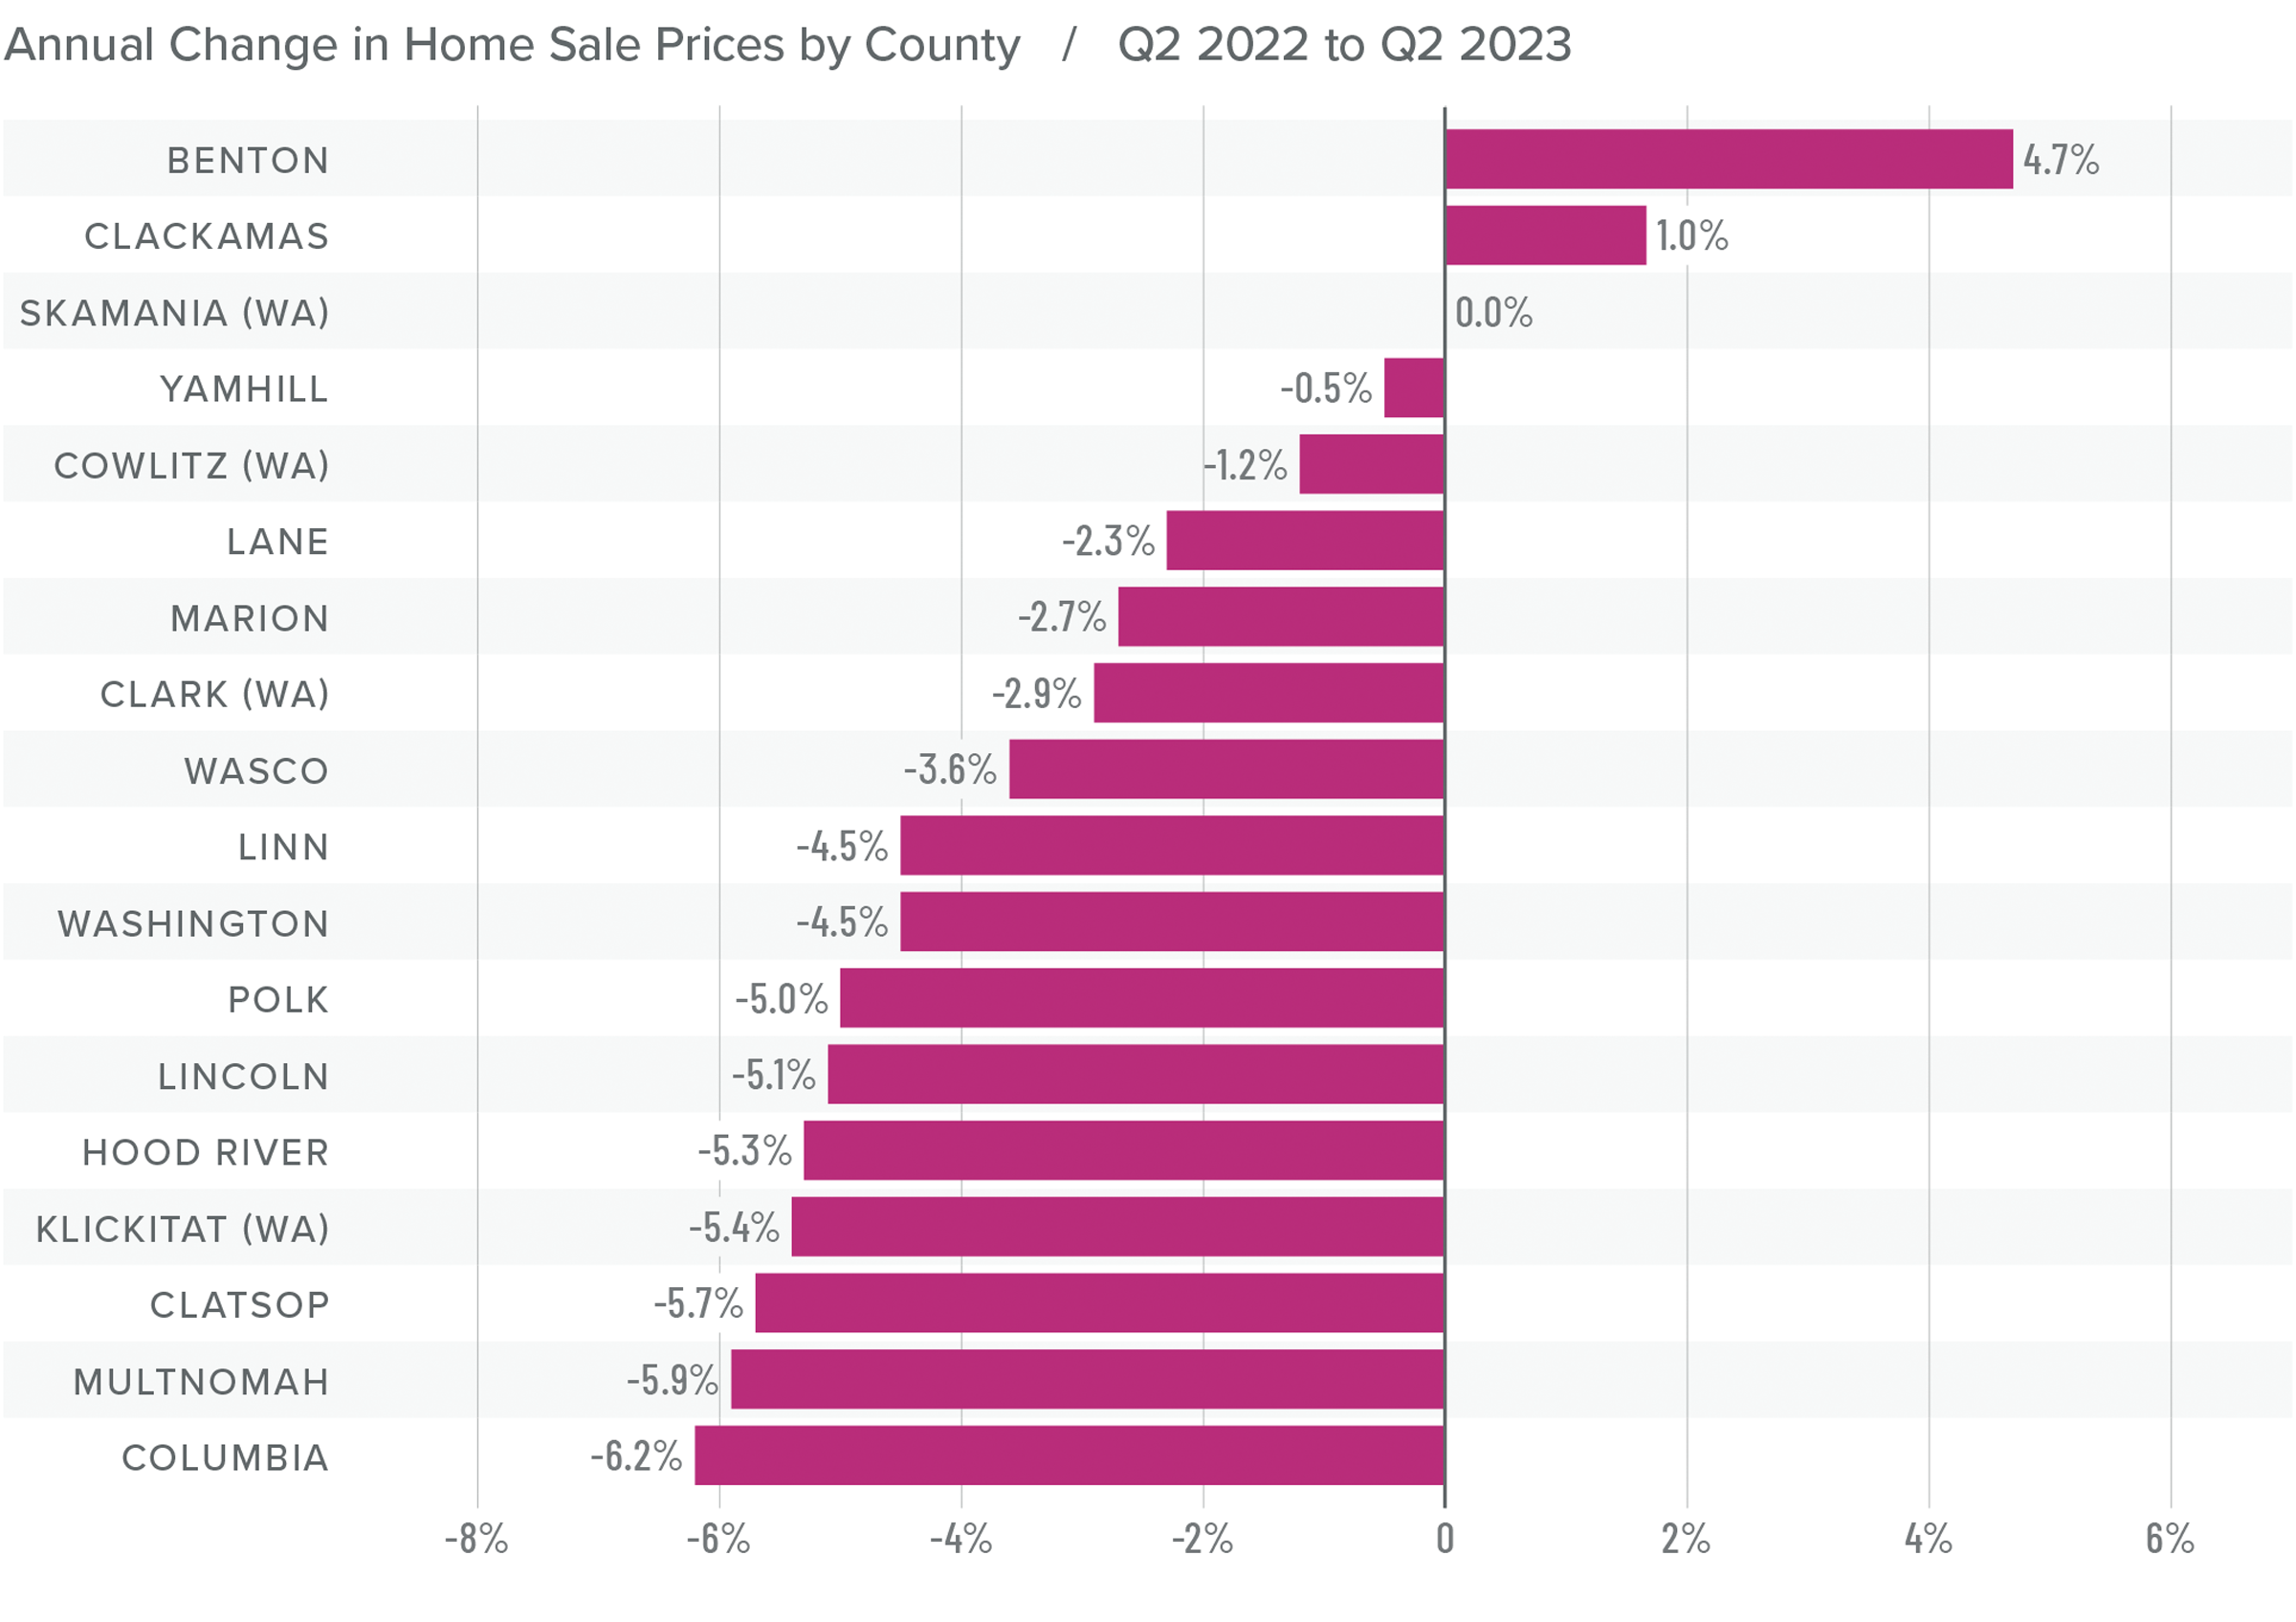
Northwest Oregon and Southwest Washington Home Prices
❱ The average sale price in the region fell 3.7% year over year, but there was a profound spring bump. Prices in the second quarter were 8.4% higher than in the first quarter of this year.
❱ On average, median list prices rose 7% compared to the first quarter of this year, suggesting that home sellers are feeling confident about the market.
❱ All but three counties saw average sale prices fall compared to the second quarter of 2022. Every county other than Clatsop, Linn, Marion, and Skamania saw prices rise compared to the first quarter of this year.
❱ I expect home prices to rise as we move through the second half of the year, but mortgage rates will dictate the pace of growth.
Mortgage Rates
Although they were less erratic than the first quarter, mortgage rates unfortunately trended higher and ended the quarter above 7%. This was due to the short debt ceiling impasse, as well as several economic datasets that suggested the U.S. economy was not slowing at the speed required by the Federal Reserve.
While the June employment report showed fewer jobs created than earlier in the year, as well as downward revisions to prior gains, inflation has not sufficiently slowed. Until it does, rates cannot start to trend consistently lower. With the economy not slowing as fast as expected, I have adjusted my forecast: Rates will hold at current levels in third quarter and then start to trend lower through the fall. Although there are sure to be occasional spikes, my model now shows the 30-year fixed rate breaking below 6% next spring.
Northwest Oregon and Southwest Washington Days on Market
❱ The average time it took to sell a home in the region rose 20 days compared to the same period in 2022. It took 14 fewer days for a home to sell compared to the first quarter of 2023.
❱ The average time it took to sell a home in the second quarter of 2023 was 57 days.
❱ All counties in this report except Benton saw days on market rise compared to the same period in 2022. Compared to the first quarter of 2023, market time fell in all counties except Clatsop, Polk, and Skamania.
❱ The market appears to be shrugging off higher financing costs and is taking advantage of the modest growth in inventory.
Conclusions
This speedometer reflects the state of the region’s real estate market using housing inventory, price gains, home sales, interest rates, and larger economic factors.
Rising list prices, home prices, and sales all point to a market that favors home sellers. Although one quarter of growth could be an anomaly, I do not believe this to be the case here.
In the first quarter Gardner Report, I gave the advantage to home buyers, but I also stated that I could easily see the market returning to one that favors sellers as we approached the summer months. This appears to be the case. As such, I have moved the needle to favor home sellers again.
About Matthew Gardner

As Chief Economist for Windermere Real Estate, Matthew Gardner is responsible for analyzing and interpreting economic data and its impact on the real estate market on both a local and national level. Matthew has over 30 years of professional experience both in the U.S. and U.K.
In addition to his day-to-day responsibilities, Matthew sits on the Washington State Governors Council of Economic Advisors; chairs the Board of Trustees at the Washington Center for Real Estate Research at the University of Washington; and is an Advisory Board Member at the Runstad Center for Real Estate Studies at the University of Washington where he also lectures in real estate economics.
Q1 2023 Northwest Oregon and Southwest Washington Real Estate Market Update
The following analysis of select counties of the Northwest Oregon and Southwest Washington real estate market is provided by Windermere Real Estate Chief Economist Matthew Gardner. We hope that this information may assist you with making better-informed real estate decisions. For further information about the housing market in your area, please don’t hesitate to contact your Windermere Real Estate agent.
Regional Economic Overview
Employment in the Oregon counties covered by this report continues to expand, though the pace of growth has started to slow. As it stands, employment levels are still down by 23,600 from the 2020 pre-COVID peak, with Multnomah County accounting for almost 22,000 of the jobs that have yet to return. That said, the unemployment rate in the region was a respectable 4.2%, matching the level we saw at the same time last year. Unfortunately, the jobless rate is low because of a declining workforce, not from employment growth. In Southwest Washington, the pace of job gains is also slowing. However, the area has recovered all the jobs lost during the pandemic and added almost 17,000 more. Unemployment was 5.9%—a level we have not seen since early 2021—as the labor force has been growing at quite a rapid rate.
Northwest Oregon and Southwest Washington Home Sales
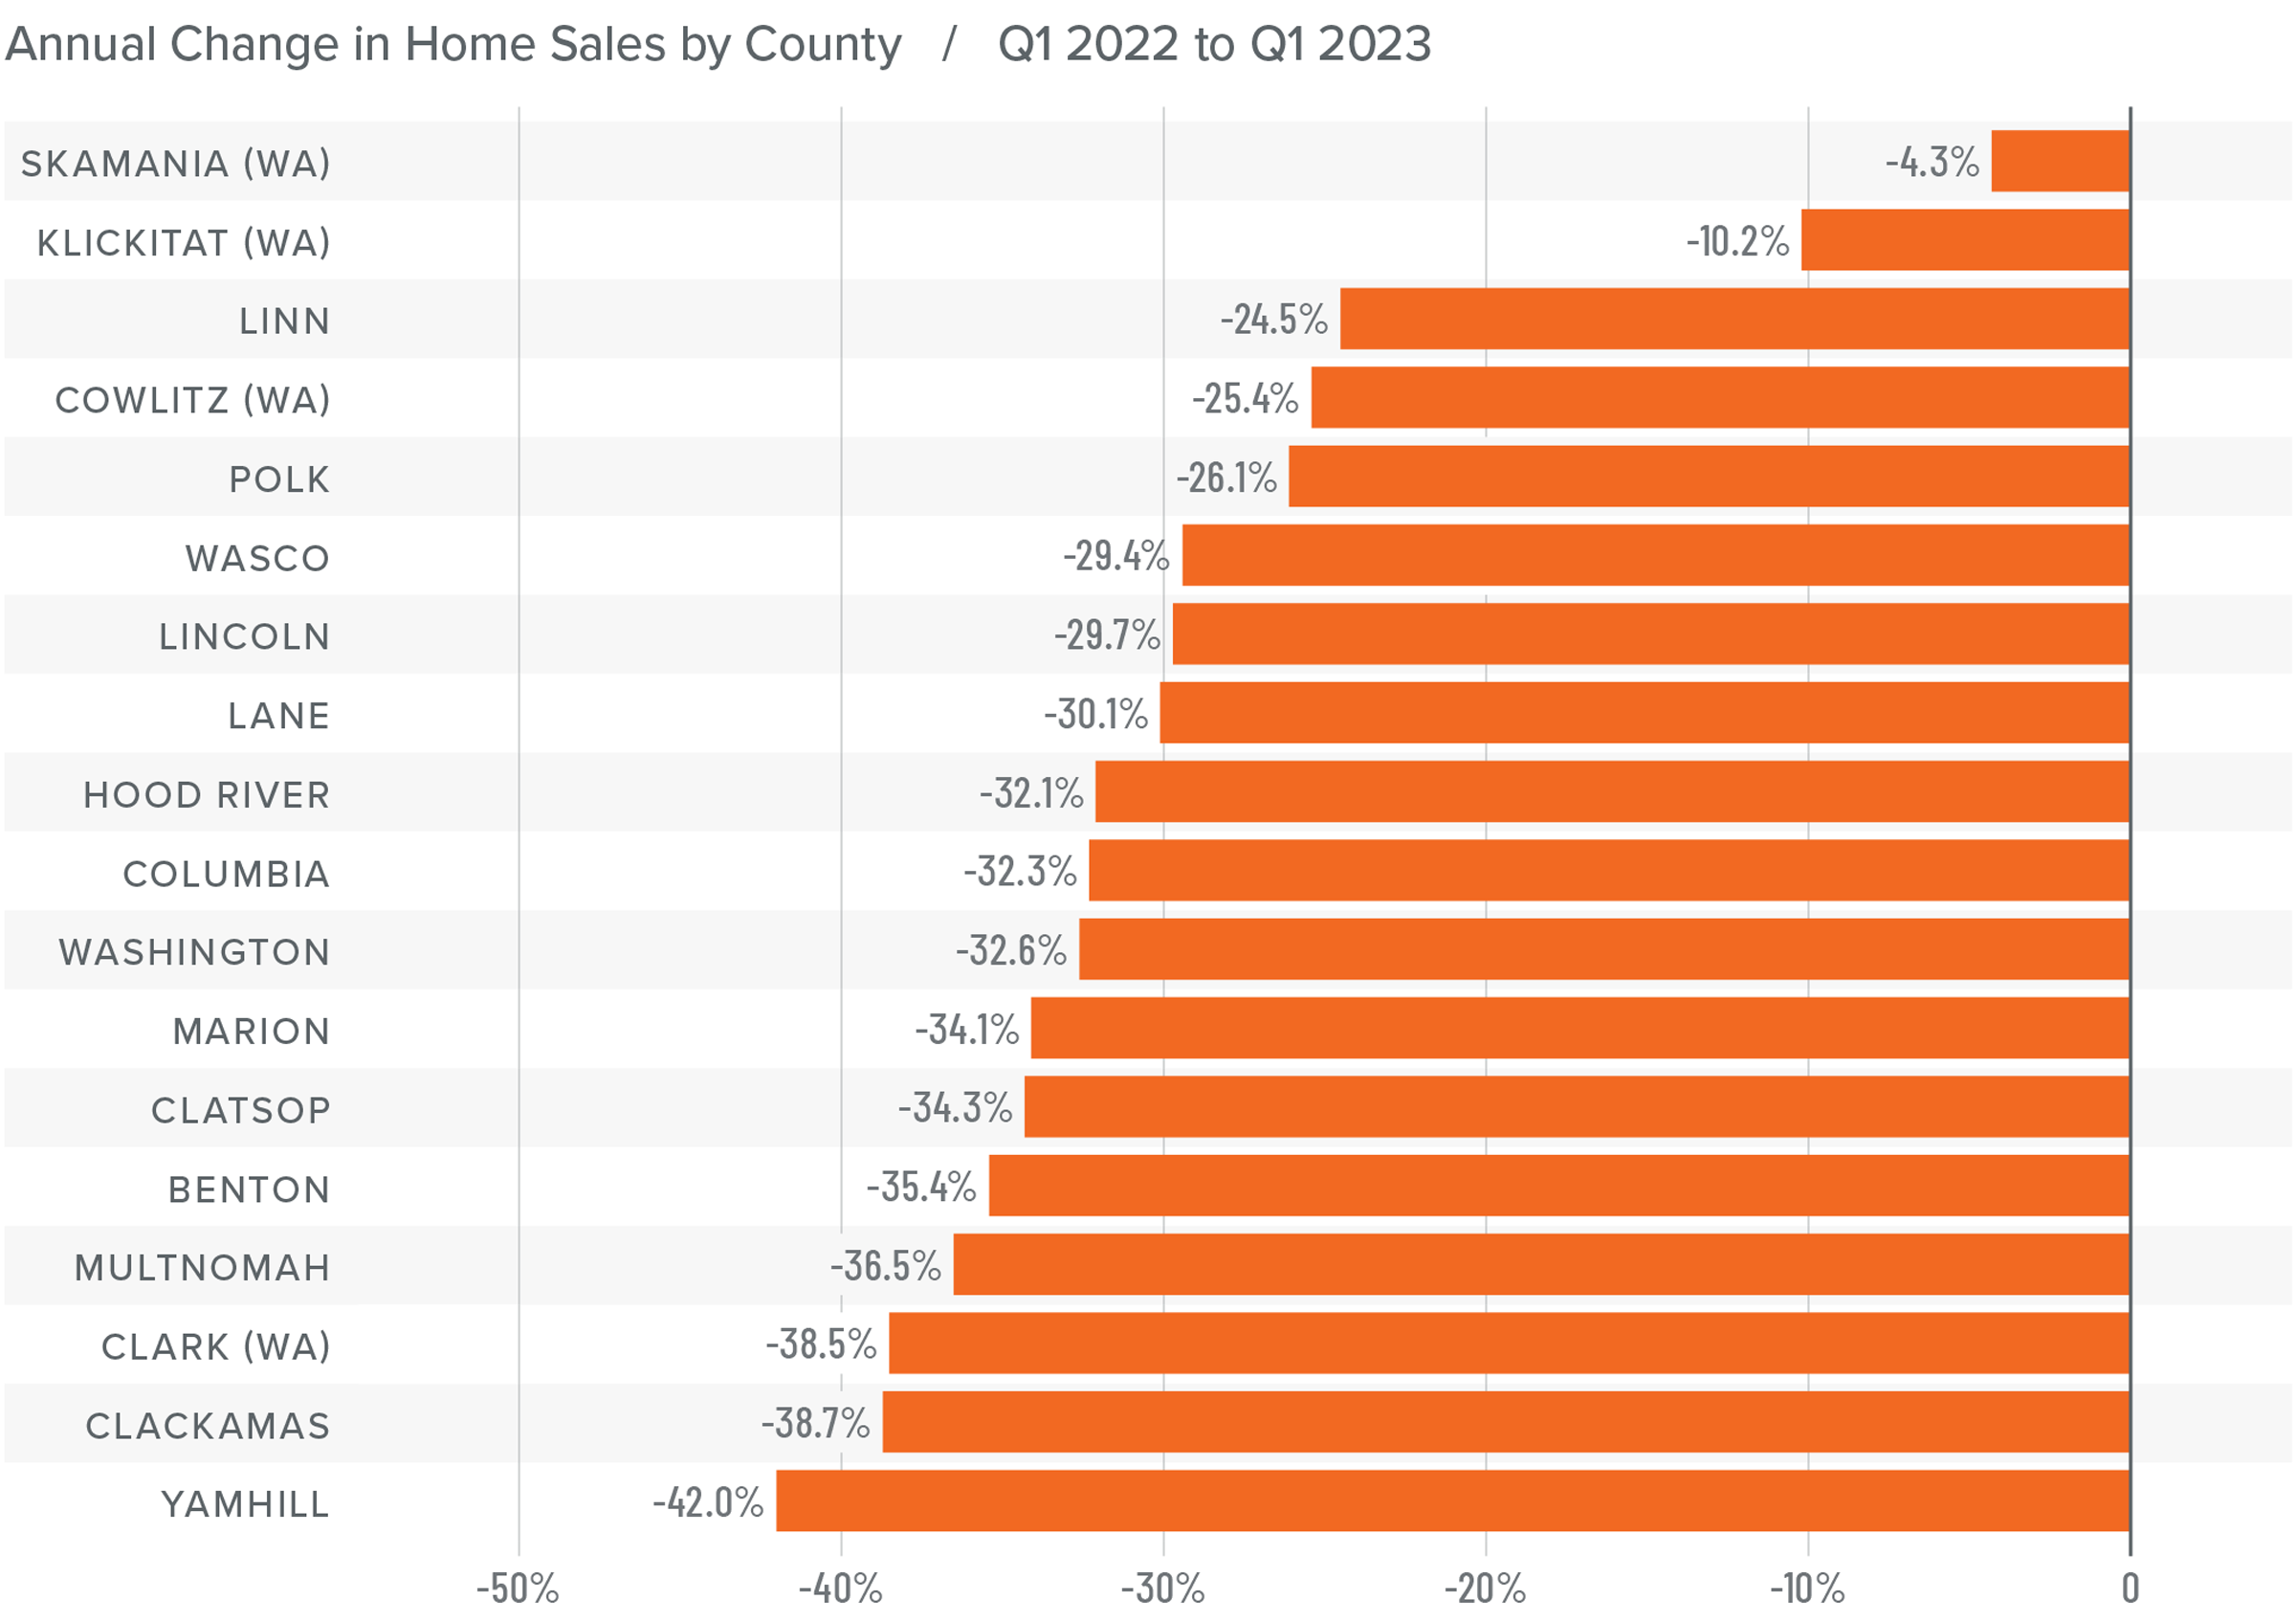
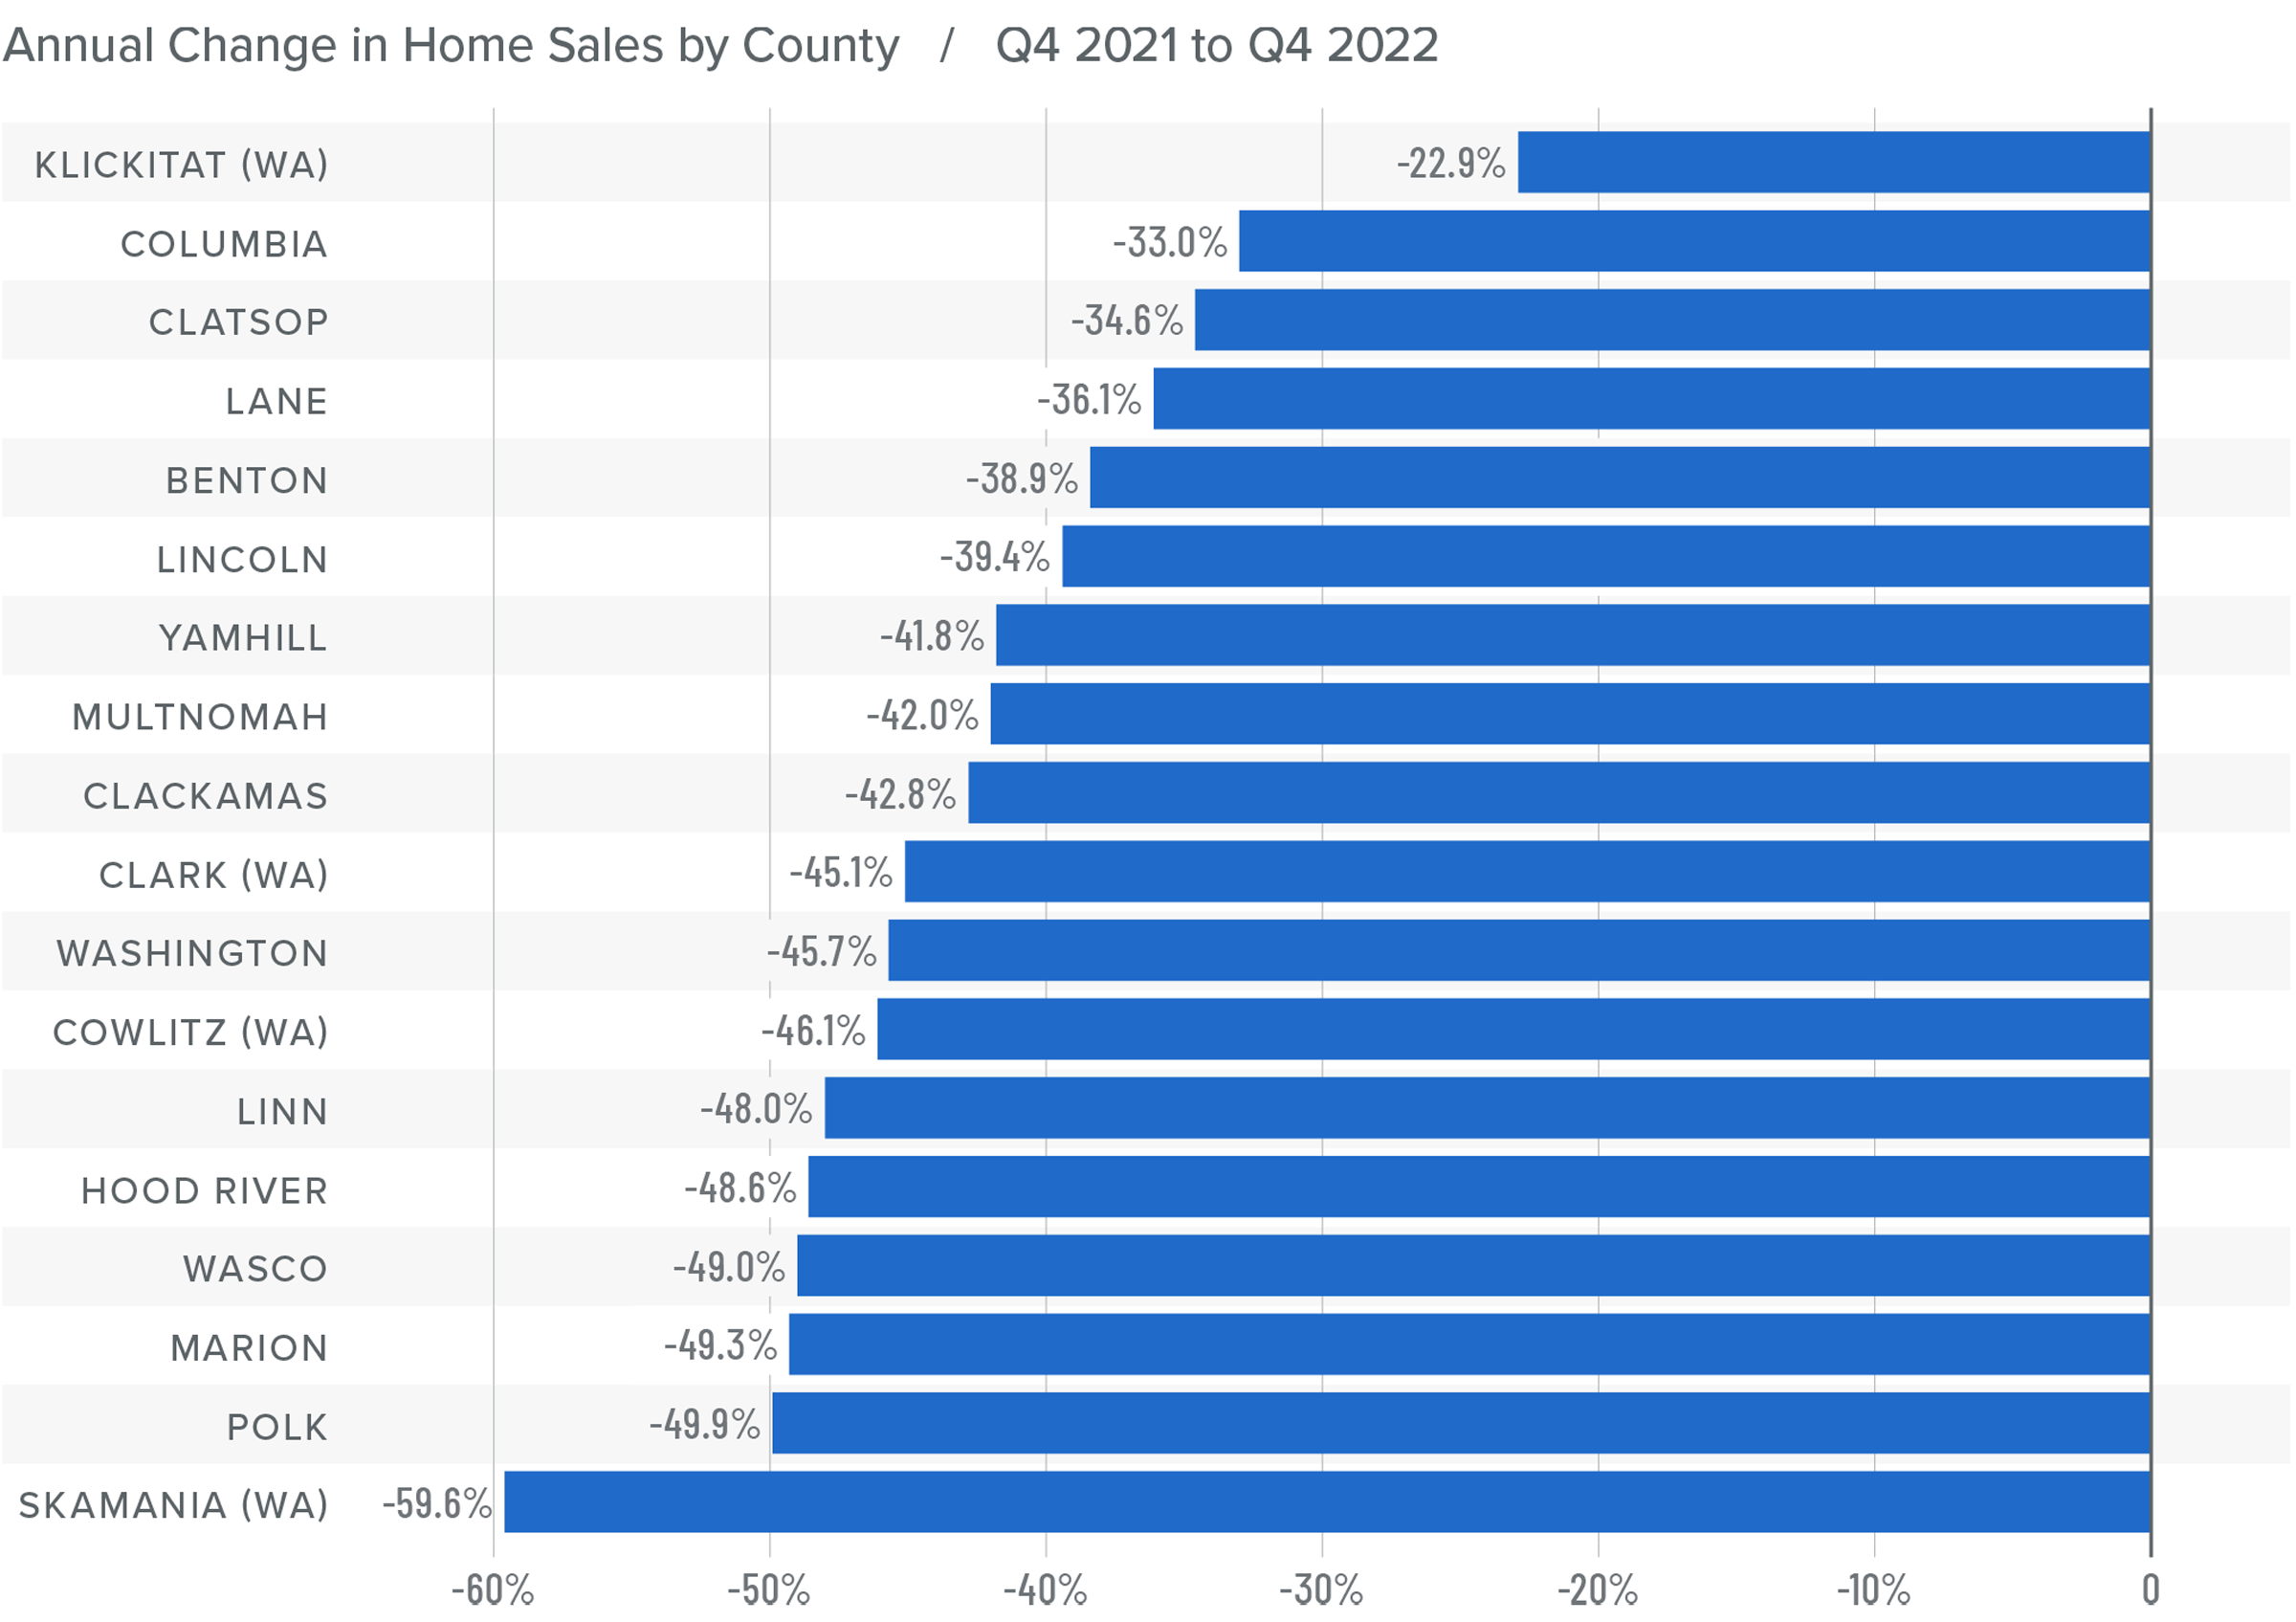
❱ In the first quarter of 2023, 6,751 homes sold, which was a drop of 34.7% from the same period in 2022 and down 18.8% from the fourth quarter of 2022.
❱ I believe the biggest issue is supply. The spring market appears to not only have come late (starting in March) but has also been far less robust than normal.
❱ Sales fell across the board compared to both the first quarter of 2022 and the final quarter of 2022.
❱ Though the lack of inventory cannot be attributed to just one factor, it could be because homeowners do not want to lose the historically low interest rate on their current mortgage. If this is the case, the market may be supply-starved for quite some time.
Northwest Oregon and Southwest Washington Home Prices
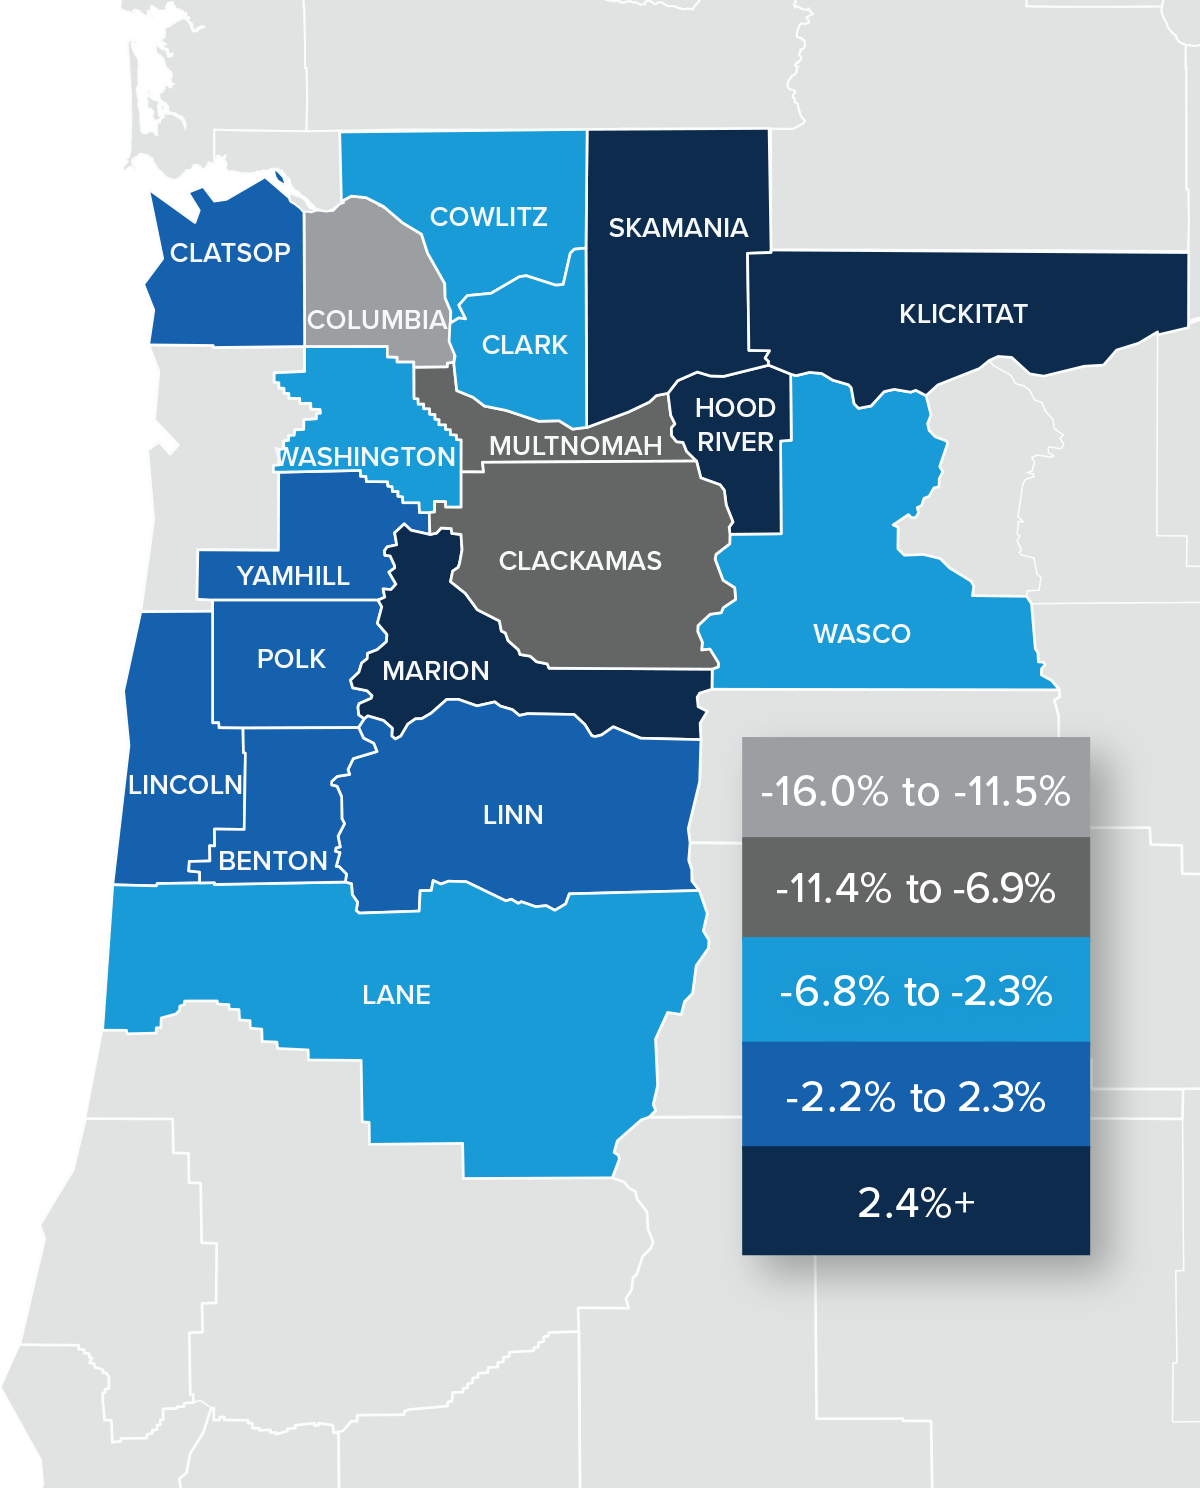
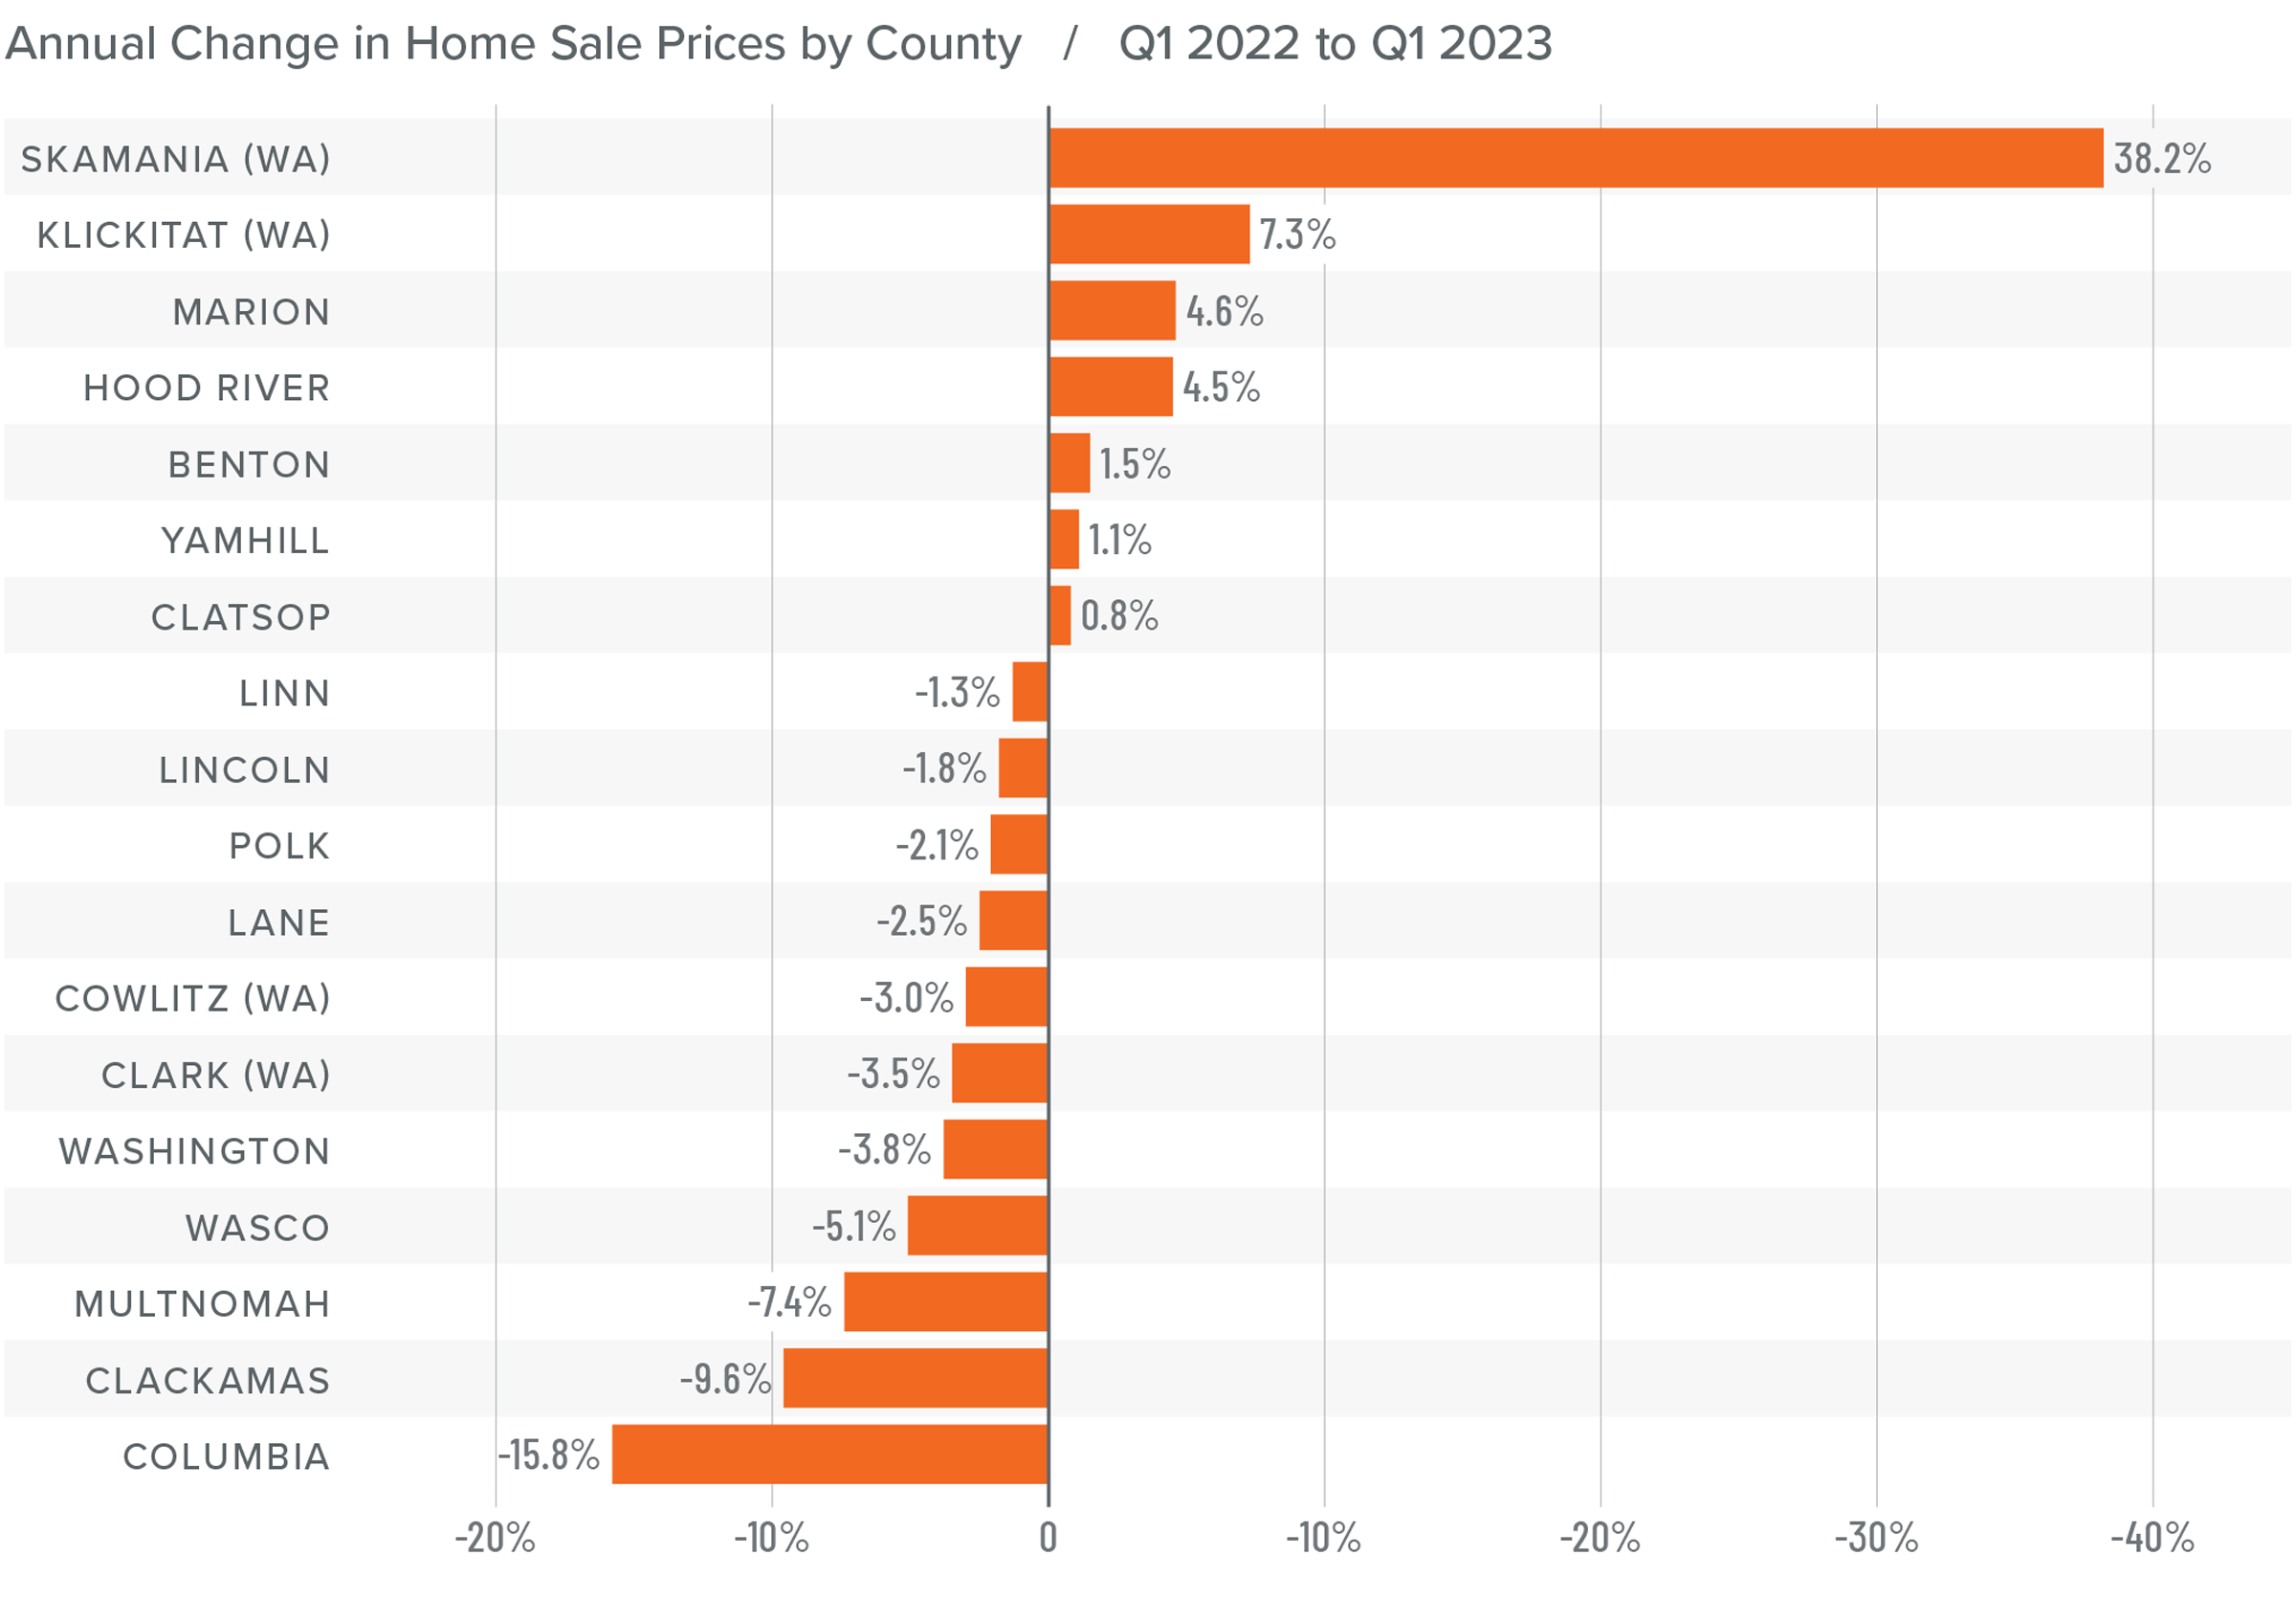
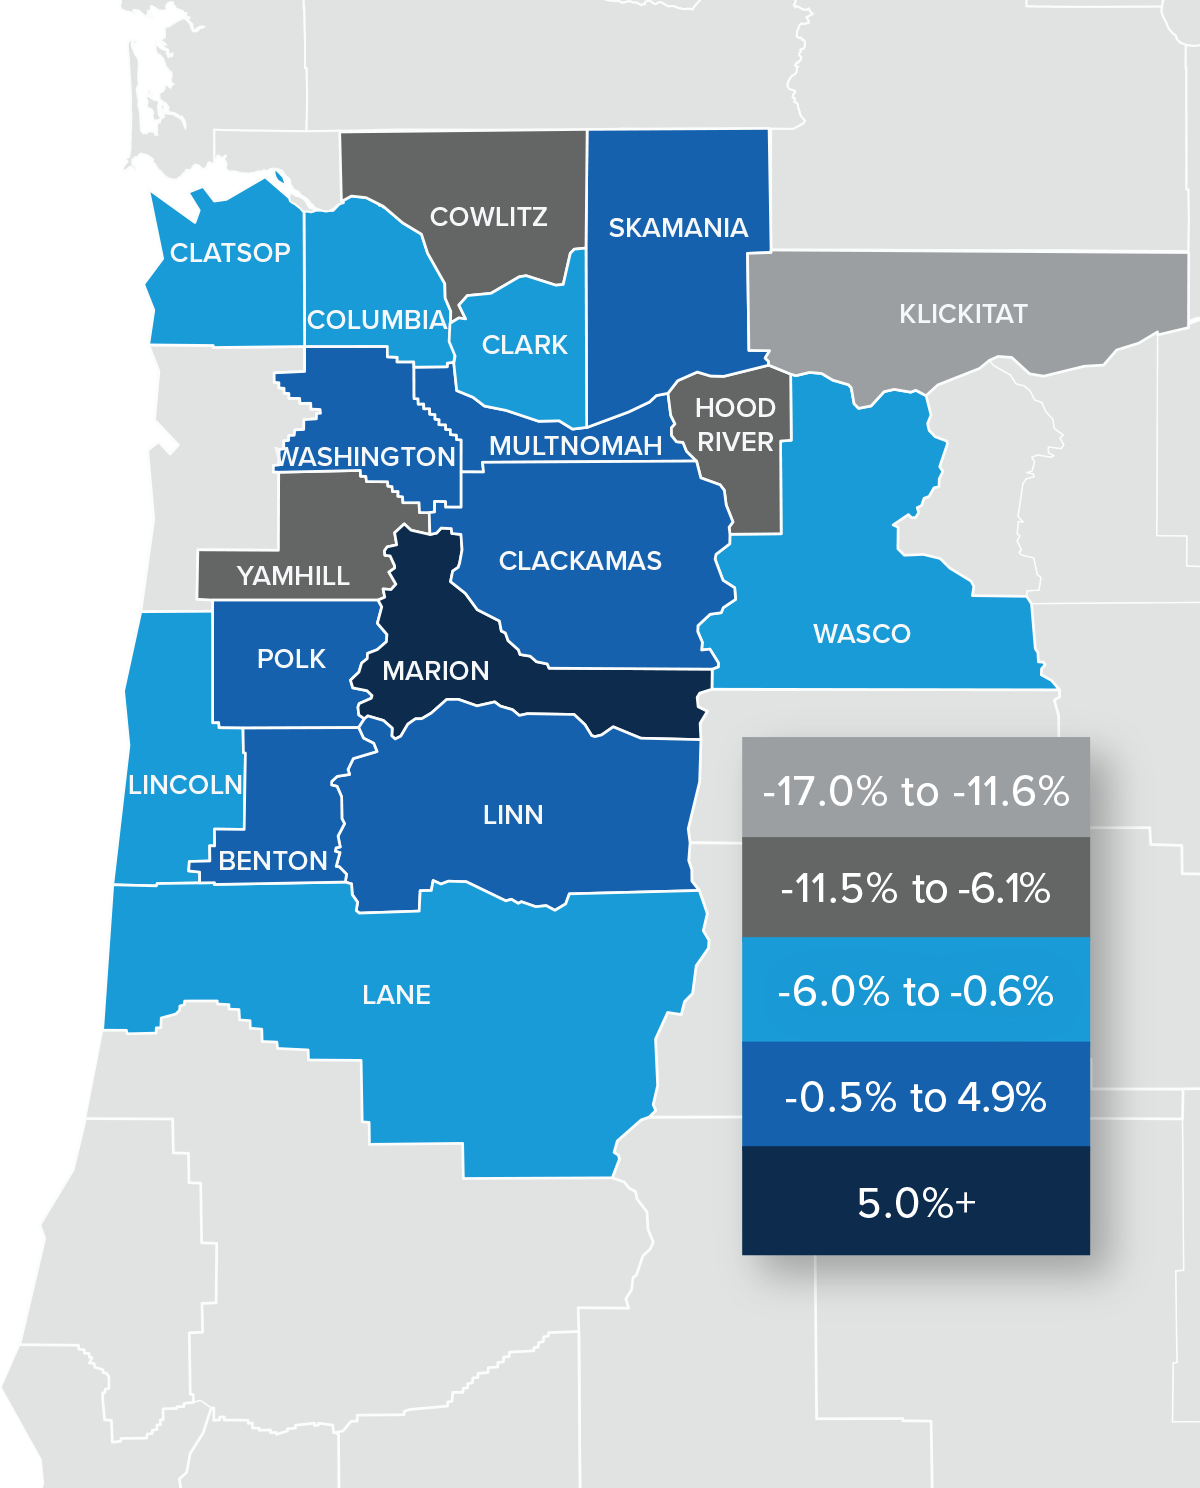
❱ The average home sale price in the region fell 5.2% year over year and was down 3.1% compared to the fourth quarter of 2022.
❱ Compared to the final quarter of 2022, home prices fell in nine counties but rose in the other nine. Hood River and Skamania counties had double-digit price growth over the prior quarter, but these are very small markets and are prone to significant swings.
❱ All but seven counties saw average home prices fall compared to a year ago. In the markets where prices rose, the pace of growth was generally slower than has been the case for a number of years.
❱ Half of the counties in this report saw listing prices rise, while the other half saw them fall. This is a little counterintuitive given the lack of inventory, but it may be that prices in some markets simply rose too much in recent years and that affordability is still a hindrance.
Mortgage Rates
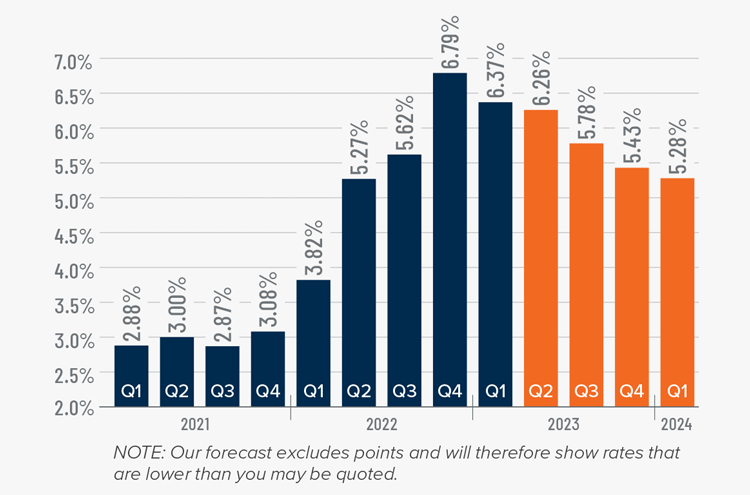
Rates in the first quarter of 2023 were far less volatile than last year, even with the brief but significant impact of early March’s banking crisis. It appears that buyers are jumping in when rates dip, which was the case in mid-January and again in early February.
Even with the March Consumer Price Index report showing inflation slowing, I still expect the Federal Reserve to raise short-term rates one more time following their May meeting before pausing rate increases. This should be the catalyst that allows mortgage rates to start trending lower at a more consistent pace than we have seen so far this year. My current forecast is that rates will continue to move lower with occasional spikes, and that they will hold below 6% in the second half of this year.
Northwest Oregon and Southwest Washington Days on Market
❱ The average time it took to sell a home in the region rose 22 days compared to the same period in 2022. It took 14 more days for a home to go under contract compared to the final quarter of 2022.
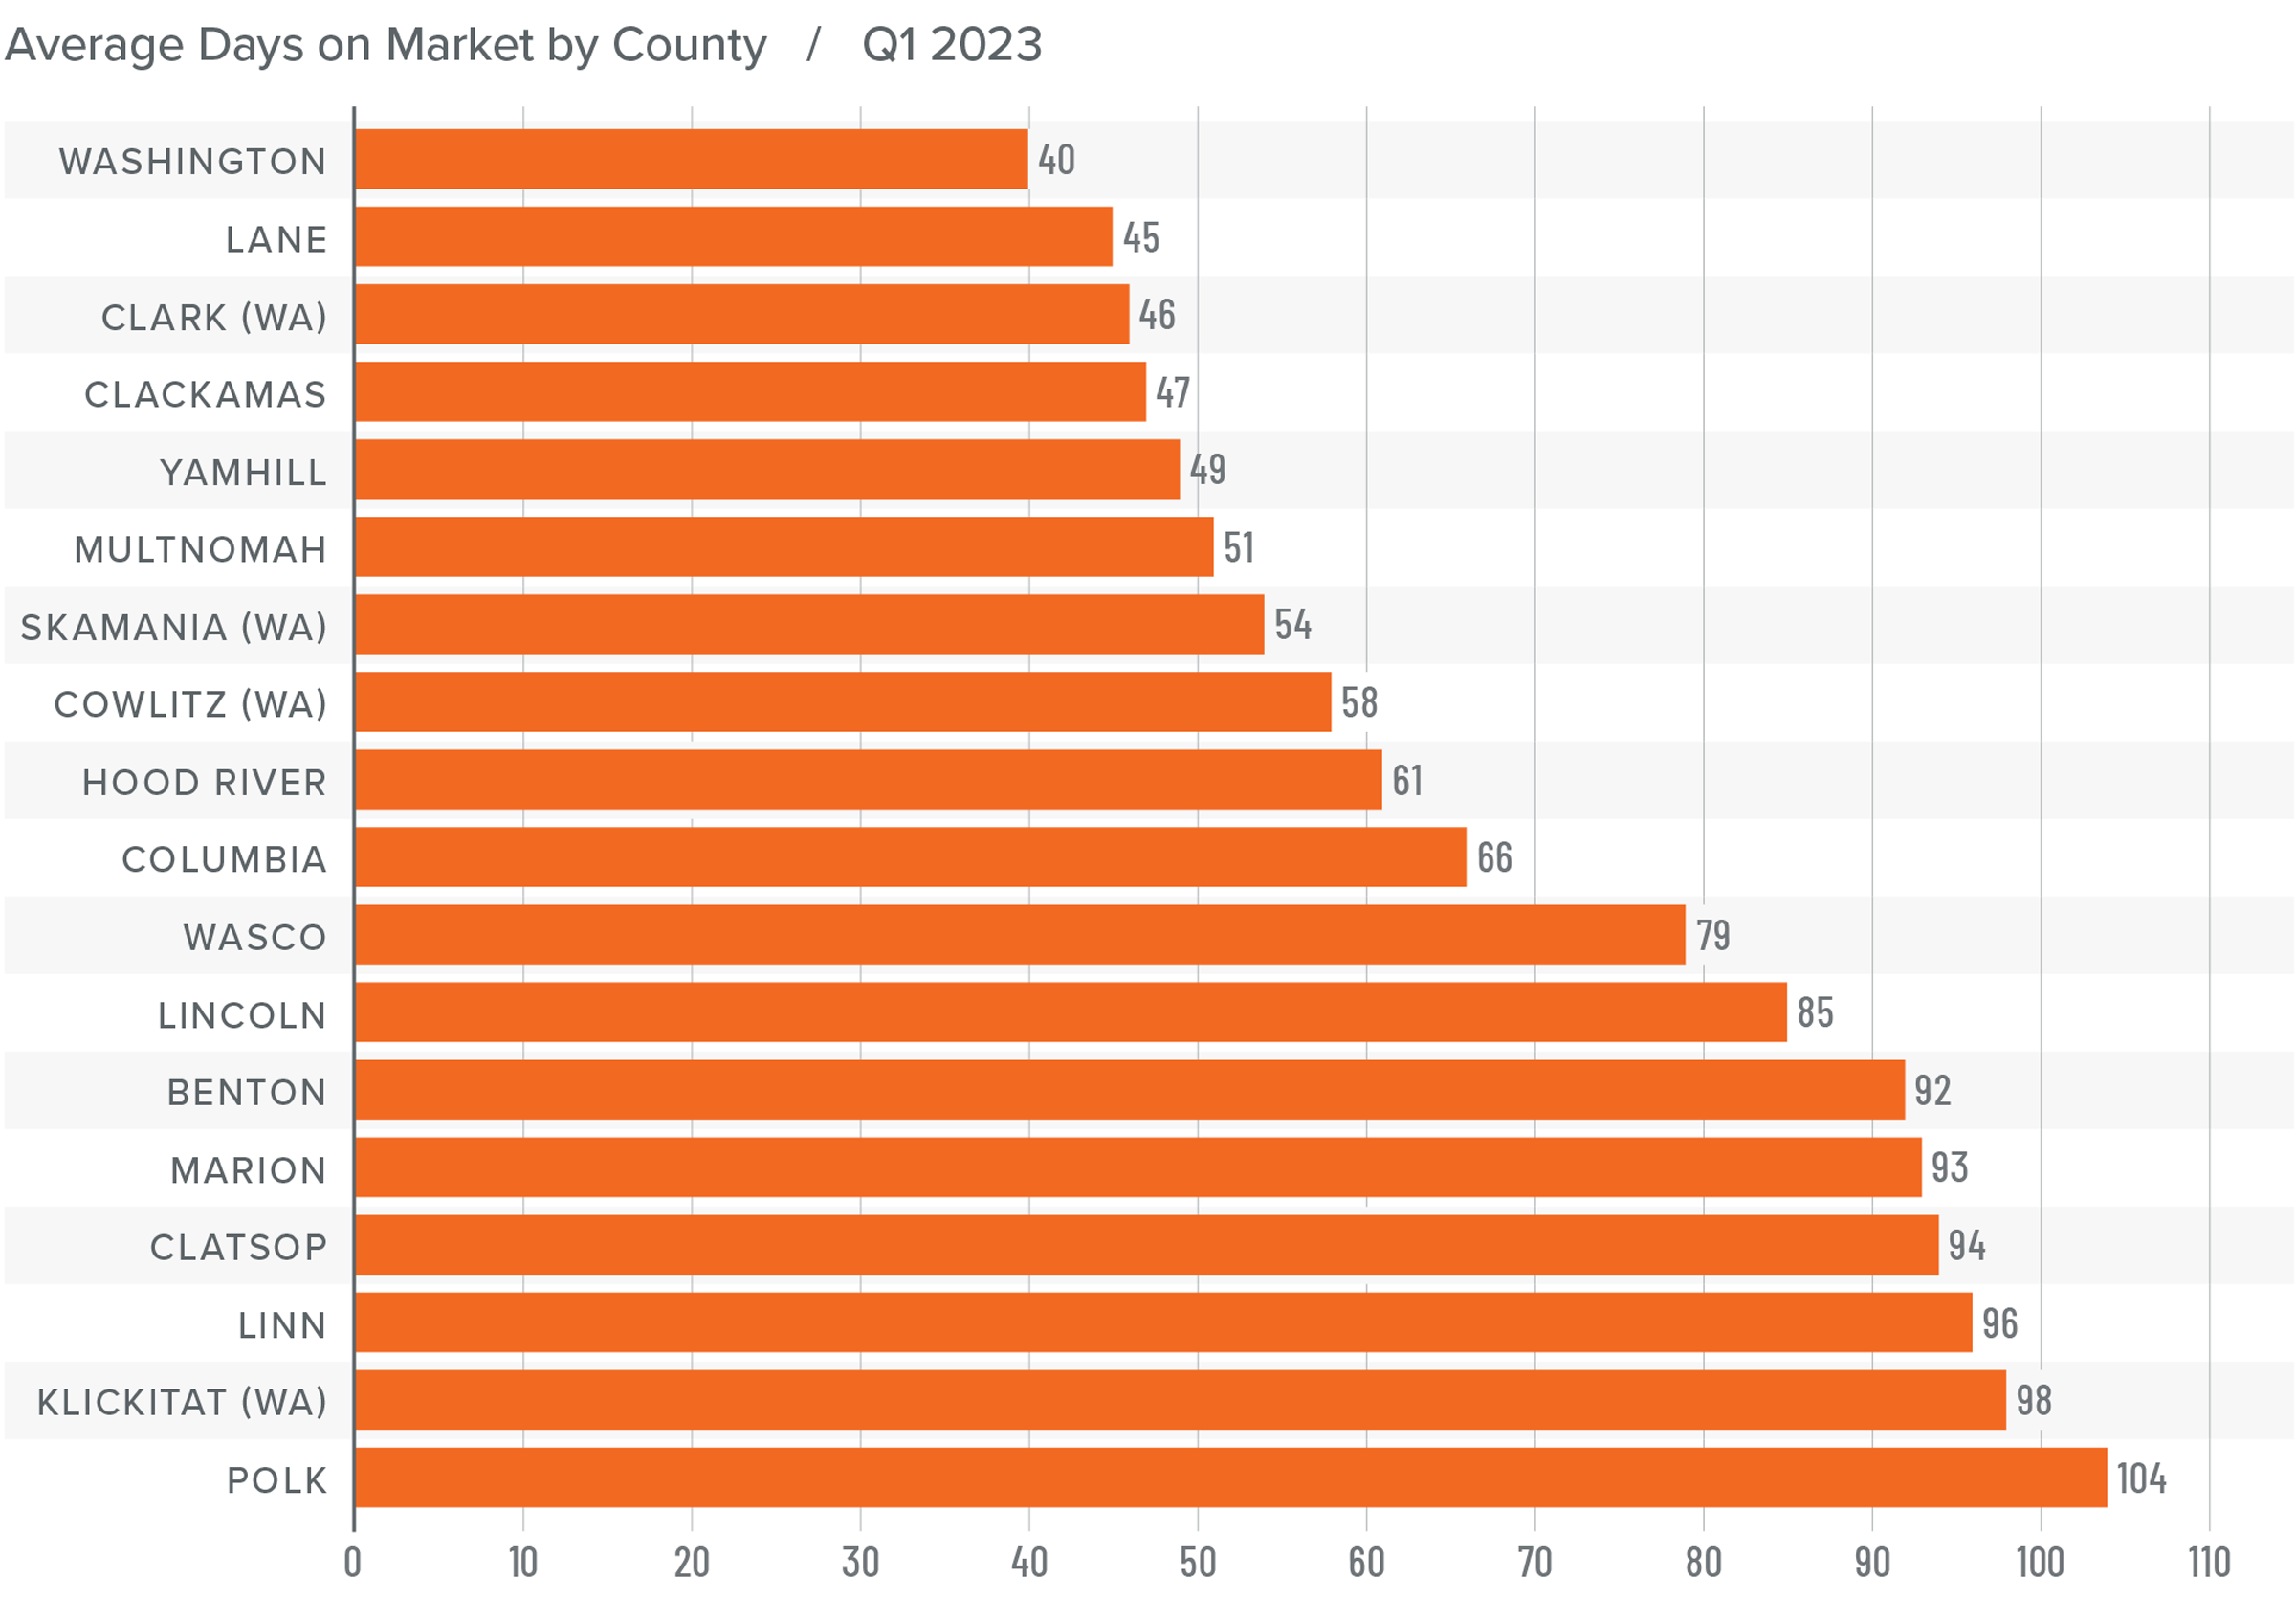
❱ The average time it took to sell a home in the first quarter of 2023 was 70 days.
❱ With the exception of Benton, all of the counties in this report saw the length of time it took for a home to go under contract rise compared to the first quarter of 2022. Compared to the fourth quarter of 2022, market time fell in Benton, Clatsop, and Lincoln counties.
❱ Unlike the fourth quarter of 2022, when longer market time suggested that additional supply was giving buyers more choices, it’s likely that uncertainty about the housing market held some buyers back in the first quarter of 2023.
Conclusions
This speedometer reflects the state of the region’s real estate market using housing inventory, price gains, home sales, interest rates, and larger economic factors.
Mortgage rates in the first quarter were lower than at the end of 2022, which generally favors buyers. Additionally, falling listing and home sale prices are also creating favorable conditions for buyers. The data suggests that buyers have a slight advantage in many, but not all, markets in the region.
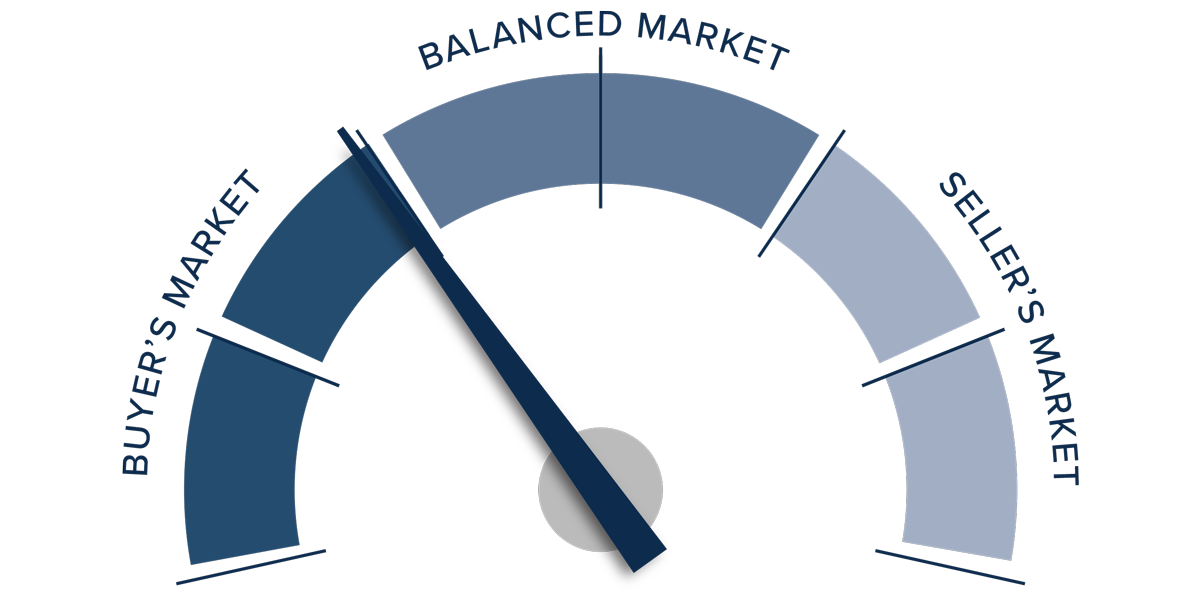
As a result, for the first time in over a decade, I am giving them a slight advantage over home sellers. That said, I can easily see it returning more toward sellers as we approach the summer. Only time will tell.
About Matthew Gardner
As Chief Economist for Windermere Real Estate, Matthew Gardner is responsible for analyzing and interpreting economic data and its impact on the real estate market on both a local and national level. Matthew has over 30 years of professional experience both in the U.S. and U.K.
In addition to his day-to-day responsibilities, Matthew sits on the Washington State Governors Council of Economic Advisors; chairs the Board of Trustees at the Washington Center for Real Estate Research at the University of Washington; and is an Advisory Board Member at the Runstad Center for Real Estate Studies at the University of Washington where he also lectures in real estate economics.
Q4 2022 Northwest Oregon and Southwest Washington Real Estate Market Update

The following analysis of select counties of the Northwest Oregon and Southwest Washington real estate market is provided by Windermere Real Estate Chief Economist Matthew Gardner. We hope that this information may assist you with making better-informed real estate decisions. For further information about the housing market in your area, please don’t hesitate to contact your Windermere Real Estate agent.
Regional Economic Overview
Jobs continue to be added in Northwest Oregon. Though we continue to creep toward a full recovery of the jobs lost to the pandemic, employment levels are still down more than 38,000 jobs. The unemployment rate in the region was 5% and has been trending higher as the total number of jobs falls, albeit modestly. The Southwest Washington market also continues to perform well, but the pace of job growth has certainly tapered. Unemployment was on the decline through mid-summer but has started to rise again. The unemployment rate in November was 5.2%, which was the highest level since September 2021.
Northwest Oregon and Southwest Washington Home Sales
❱ In the final quarter of 2022, 8,434 homes sold, representing a drop of 43.4% from the same period in 2021.
❱ Year over year, listing activity was significantly higher but remained well below the long-term average. This suggests that high financing costs and affordability constraints are still impacting the market.
❱ Home sales fell across the board relative to the same time the previous year and the third quarter of 2022.
❱ Buyers have more homes to choose from than they have seen since 2019, yet many are still sitting on the fence. This may be because they are waiting for prices to fall further, mortgage rates to come down, or, likely, both. It will be interesting to see if buyer mentality changes in the spring.
Northwest Oregon and Southwest Washington Home Prices
❱ The average home sale price in the region matched that of the same period the year prior, but it was down 5.6% compared to the third quarter of 2022.
❱ Relative to the third quarter of 2022, average prices fell across the board. Columbia, Hood River, Lincoln, and Wasco counties saw double-digit declines.
❱ Prices in all but seven counties fell year over year. Where prices did rise, the pace of growth was far lower than the market has seen in a number of years.
❱ Several markets appear to show listing prices either stabilizing or increasing modestly. It is possible that some markets have adjusted to account for higher mortgage rates. It will be interesting to see if this continues as we move into the spring market, or if we will see prices erode further.

Mortgage Rates
Rates rose dramatically in 2022, but I believe that they have now peaked. Mortgage rates are primarily based on the prices and yields of bonds, and while bonds take cues from several places, they are always impacted by inflation and the economy at large. If inflation continues to fall, as I expect it will, rates will continue to drop.
My current forecast is that mortgage rates will trend lower as we move through the year. While this may be good news for home buyers, rates will still be higher than they have become accustomed to. Even as the cost of borrowing falls, home prices in expensive markets will probably fall a bit more to compensate for rates that will likely hold above 6% until early summer.
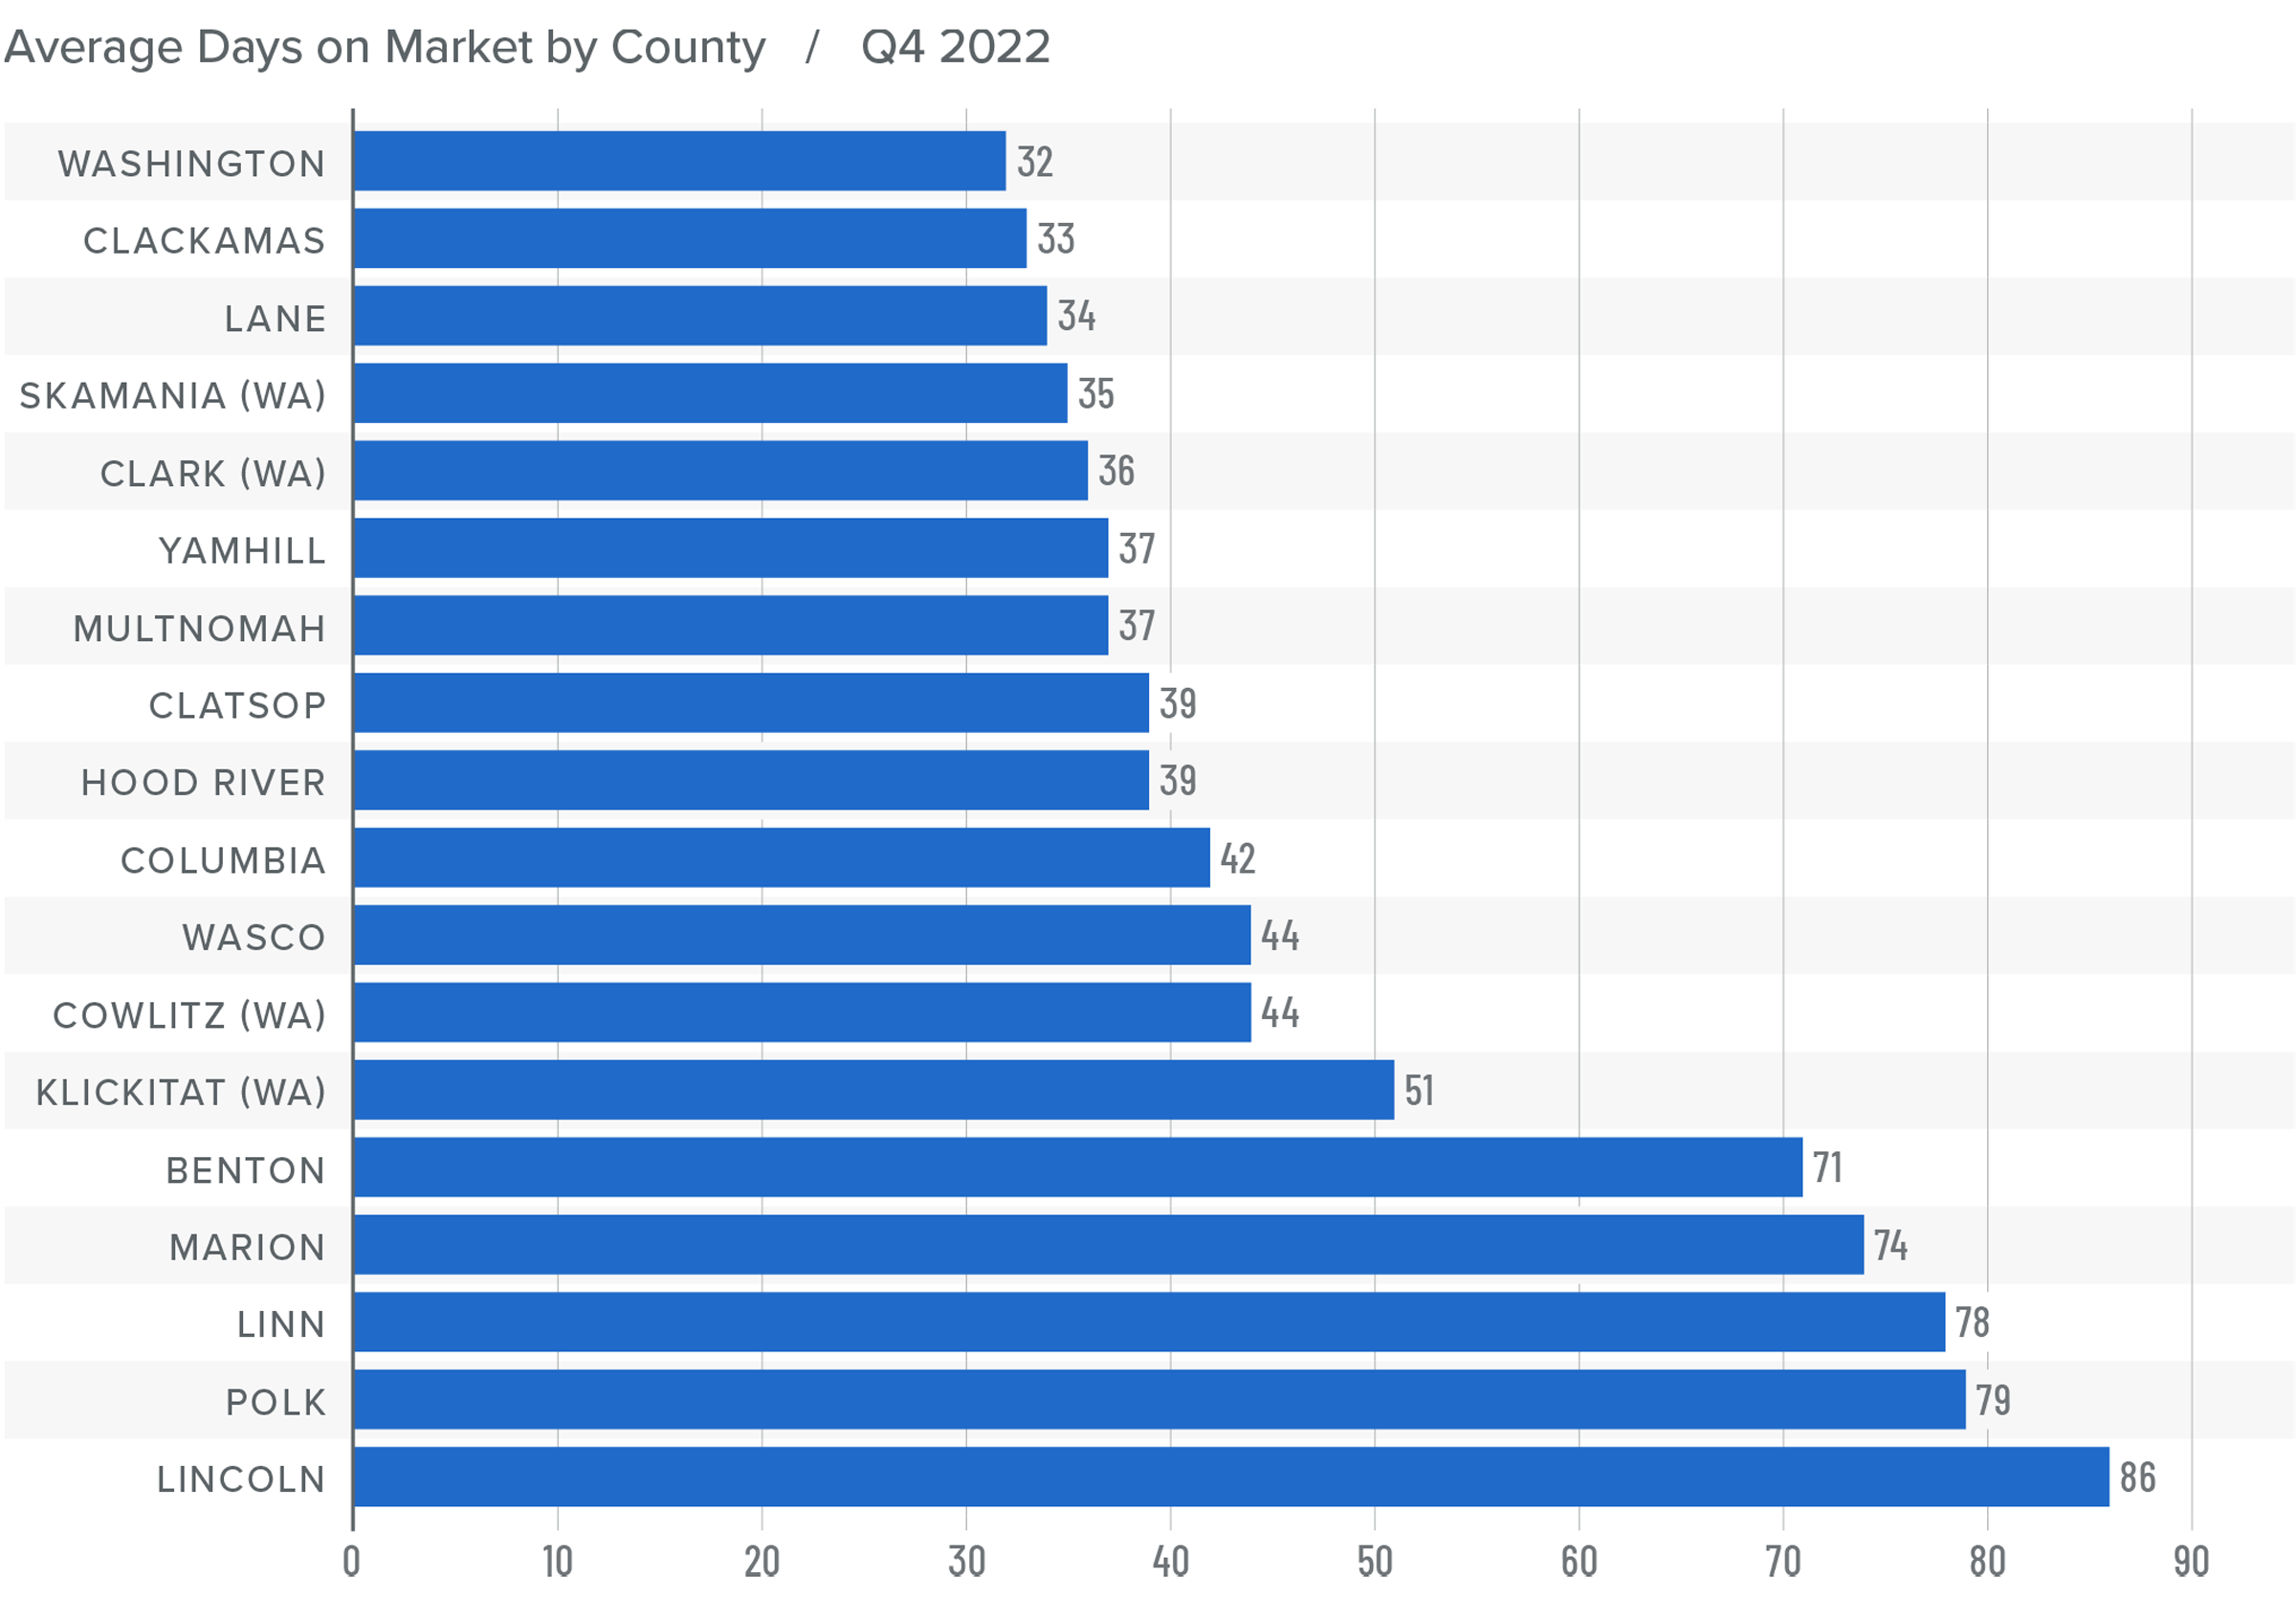
Northwest Oregon and Southwest Washington Days on Market
❱ The average time it took to sell a home in the region rose 12 days compared to the same period the previous year. It took 11 more days for homes to sell than it did in the third quarter of 2022.
❱ The average time it took to sell a home in the final quarter of 2022 was 50 days.
❱ Skamania County was the only area where market time fell compared to the same period the prior year. Relative to the third quarter of 2022, market time fell in Benton and Skamania counties.
❱ Longer market time is a function of additional supply. While this gives buyers more choice, it also causes uncertainty in the housing market. As a result, buyers are significantly more cautious than they have been in quite some time.
Conclusions
This speedometer reflects the state of the region’s real estate market using housing inventory, price gains, home sales, interest rates, and larger economic factors.
I believe the market will remain somewhat soft as we move through the spring, but with many sellers believing that prices have found a bottom (as indicated by the stabilization in listing prices), buyers may not end up in as strong a position as they might think.

The market is, without a doubt, closer to balance than it has been in over a decade. As such, I have moved the needle as close to the balance line as we have seen in a very long time.
About Matthew Gardner
As Chief Economist for Windermere Real Estate, Matthew Gardner is responsible for analyzing and interpreting economic data and its impact on the real estate market on both a local and national level. Matthew has over 30 years of professional experience both in the U.S. and U.K.
In addition to his day-to-day responsibilities, Matthew sits on the Washington State Governors Council of Economic Advisors; chairs the Board of Trustees at the Washington Center for Real Estate Research at the University of Washington; and is an Advisory Board Member at the Runstad Center for Real Estate Studies at the University of Washington where he also lectures in real estate economics.
Q3 2022 Northwest Oregon and Southwest Washington Real Estate Market Update

The following analysis of select counties of the Northwest Oregon and Southwest Washington real estate market is provided by Windermere Real Estate Chief Economist Matthew Gardner. We hope that this information may assist you with making better-informed real estate decisions. For further information about the housing market in your area, please don’t hesitate to contact your Windermere Real Estate agent.
Regional Economic Overview
The Oregon counties contained in this report continue to add jobs, but employment levels are still down 56,300 jobs from the pre-pandemic peak. As I mentioned in the second quarter Gardner Report, this is mainly due to the Portland market: Multnomah County employment levels are still down by over 83,000 jobs. Despite this, the unemployment rate within the Oregon counties in this report came in at a very healthy 3.4%, which is down from the pandemic peak of 12.8%.
Southwest Washington saw a full recovery by the summer of 2021, but the job market in that region is considerably smaller. That said, more jobs continue to be added, with employment levels now 12,800 positions higher than the pre-pandemic peak. During the third quarter, the unemployment rate was 4.6%, which is down from 14.2% at the start of the pandemic.
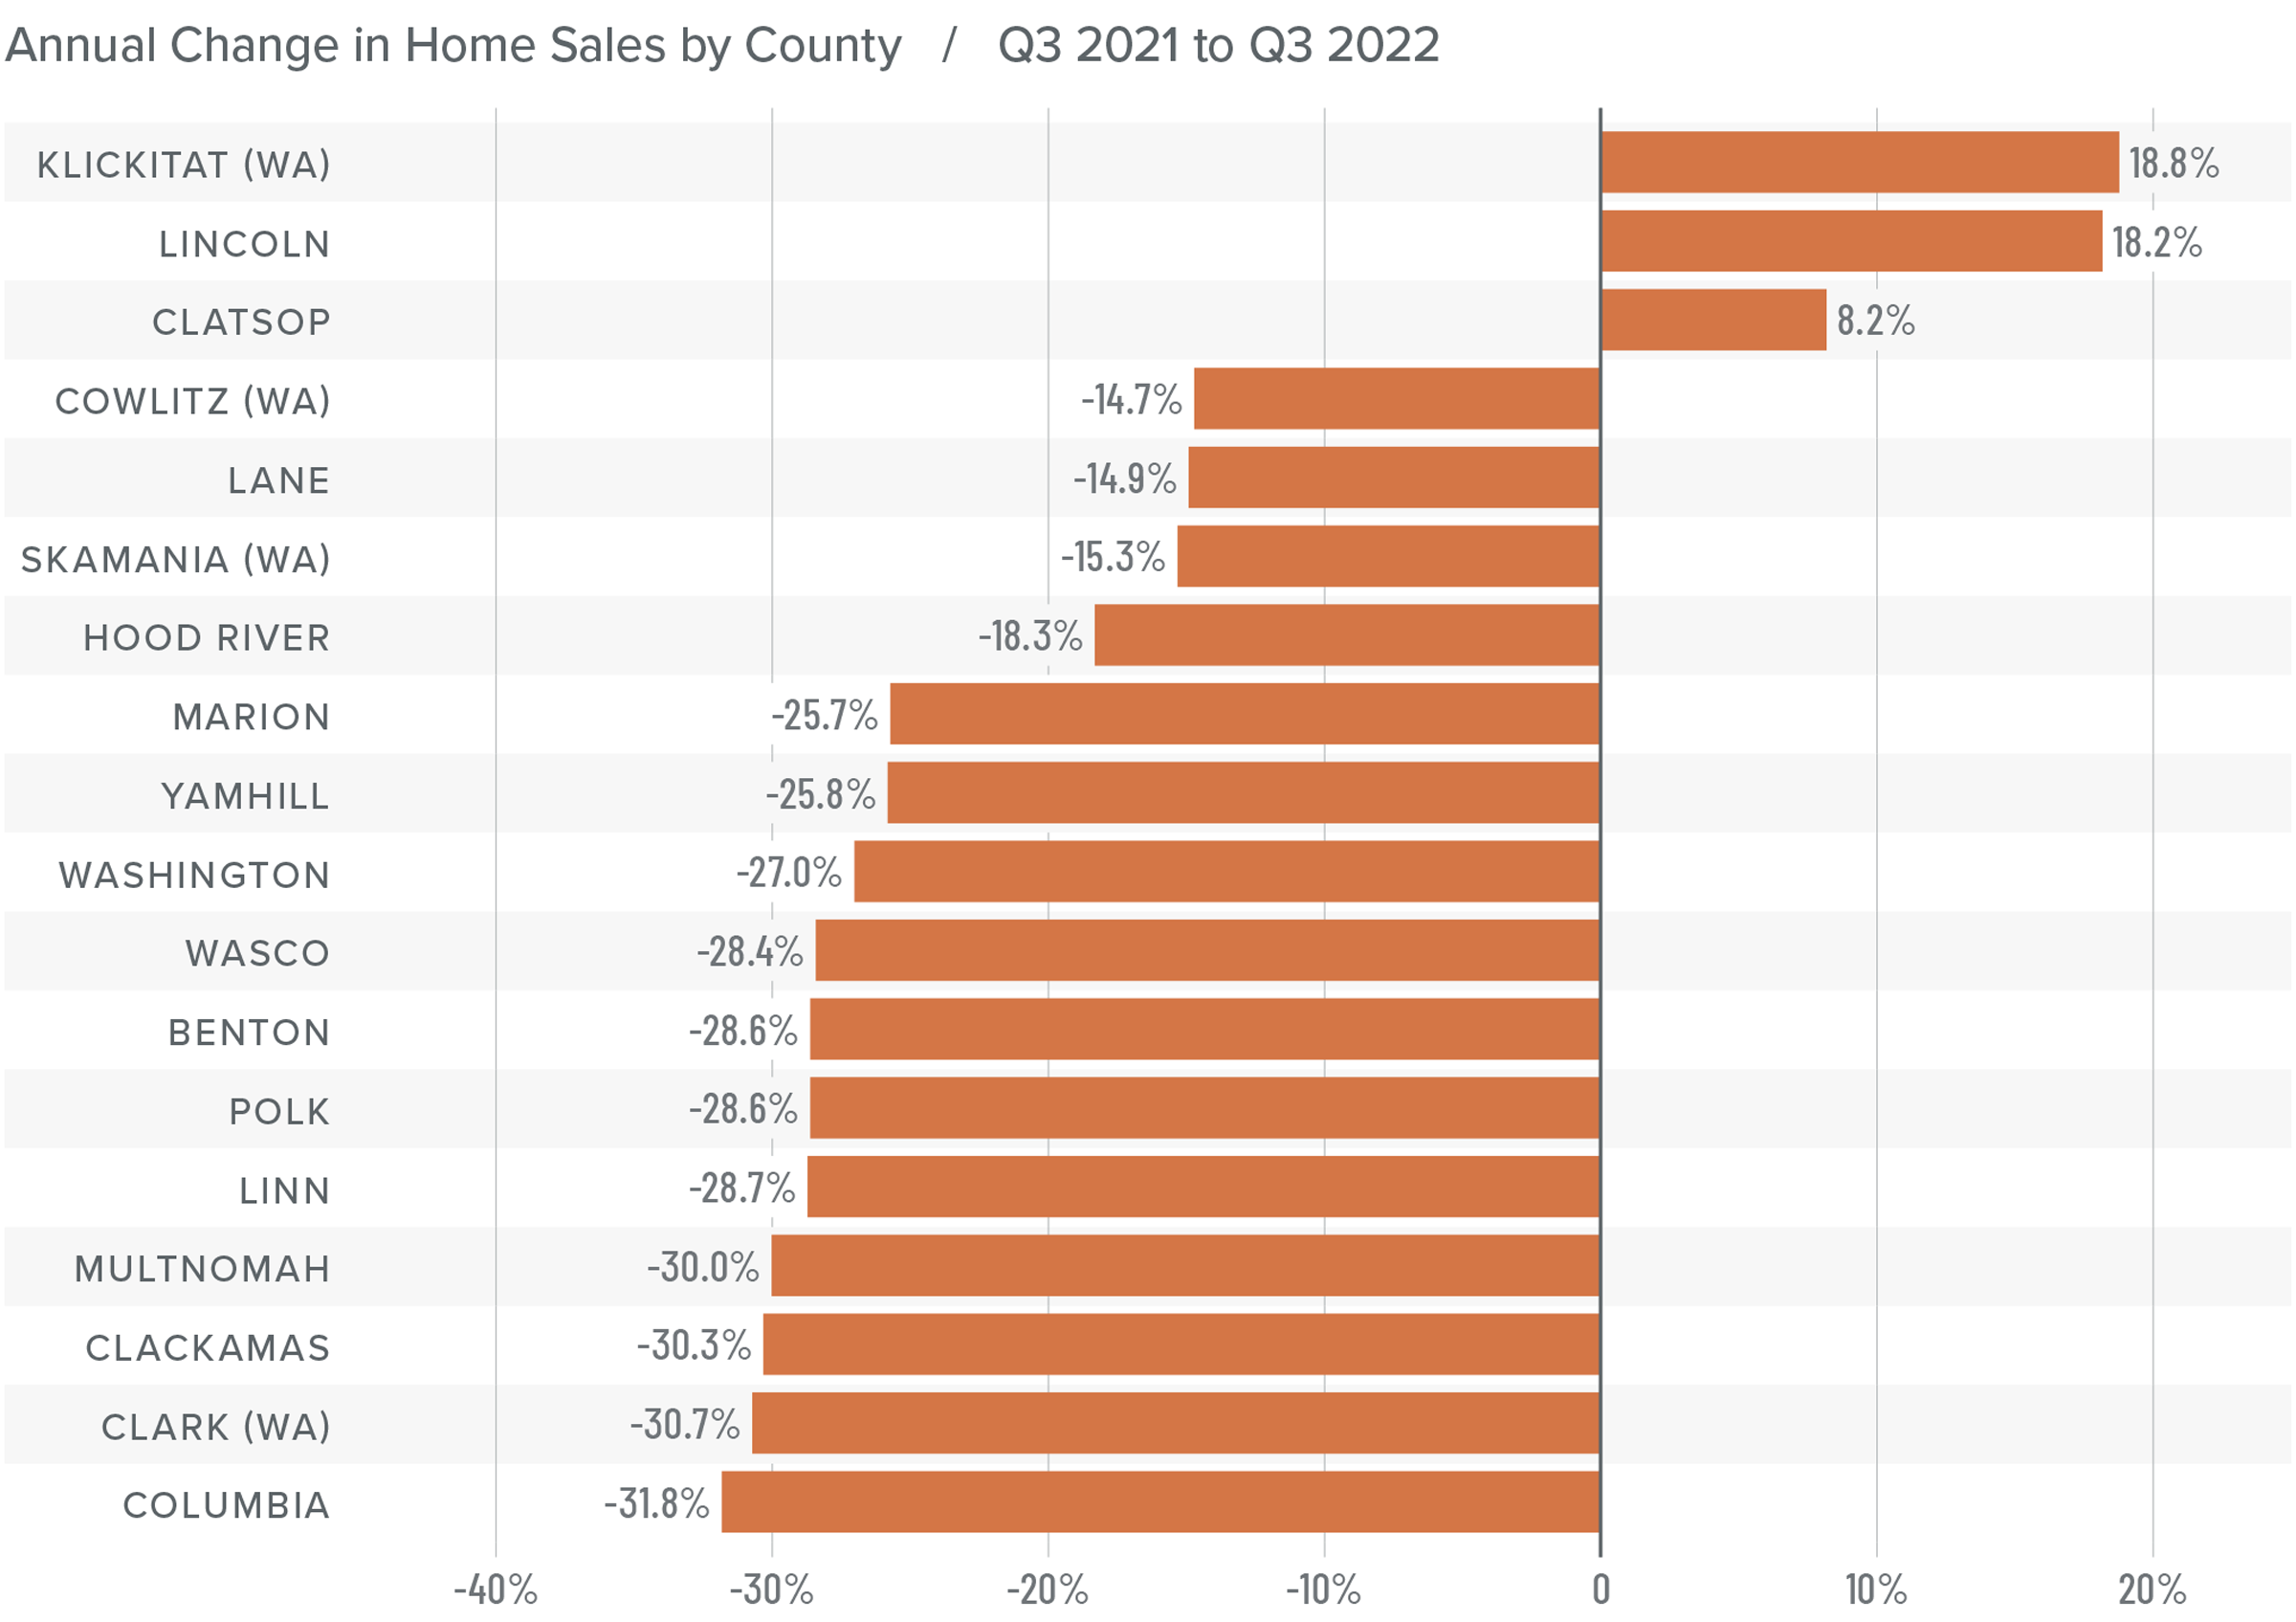
Northwest Oregon and Southwest Washington Home Sales
❱ In the third quarter of 2022, 12,549 homes sold, which is 26.4% lower than a year ago and 13.8% lower than in the second quarter of 2022.
❱ Listing activity has risen across the region, but the current level is still well below the long-term average. Lower sales can be attributed to higher financing costs and lower affordability.
❱ Year over year, sales rose in three counties but fell in the balance of the market. Compared to the second quarter of this year, sales rose in Benton, Clatsop, Cowlitz, and Klickitat counties.
❱ The region is acting like most across the country. More homes are becoming available, but many would-be buyers are waiting for mortgage rates to stabilize or drop, which is impacting sales.
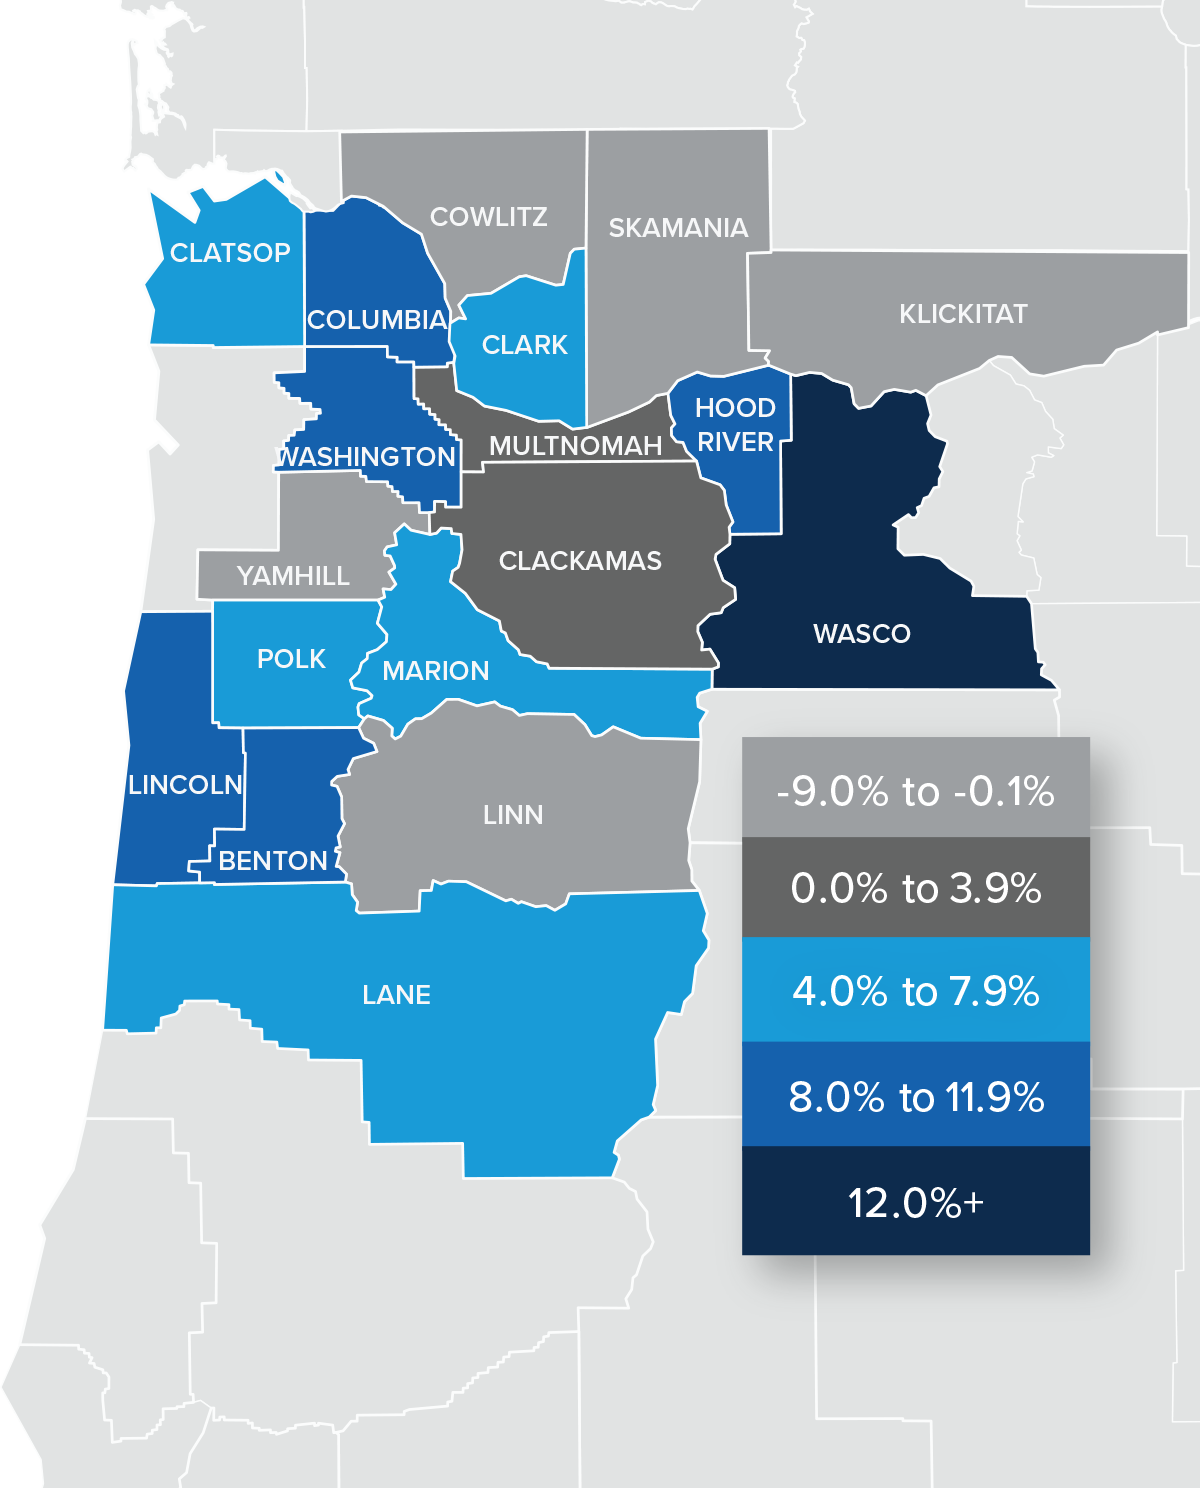
Northwest Oregon and Southwest Washington Home Prices
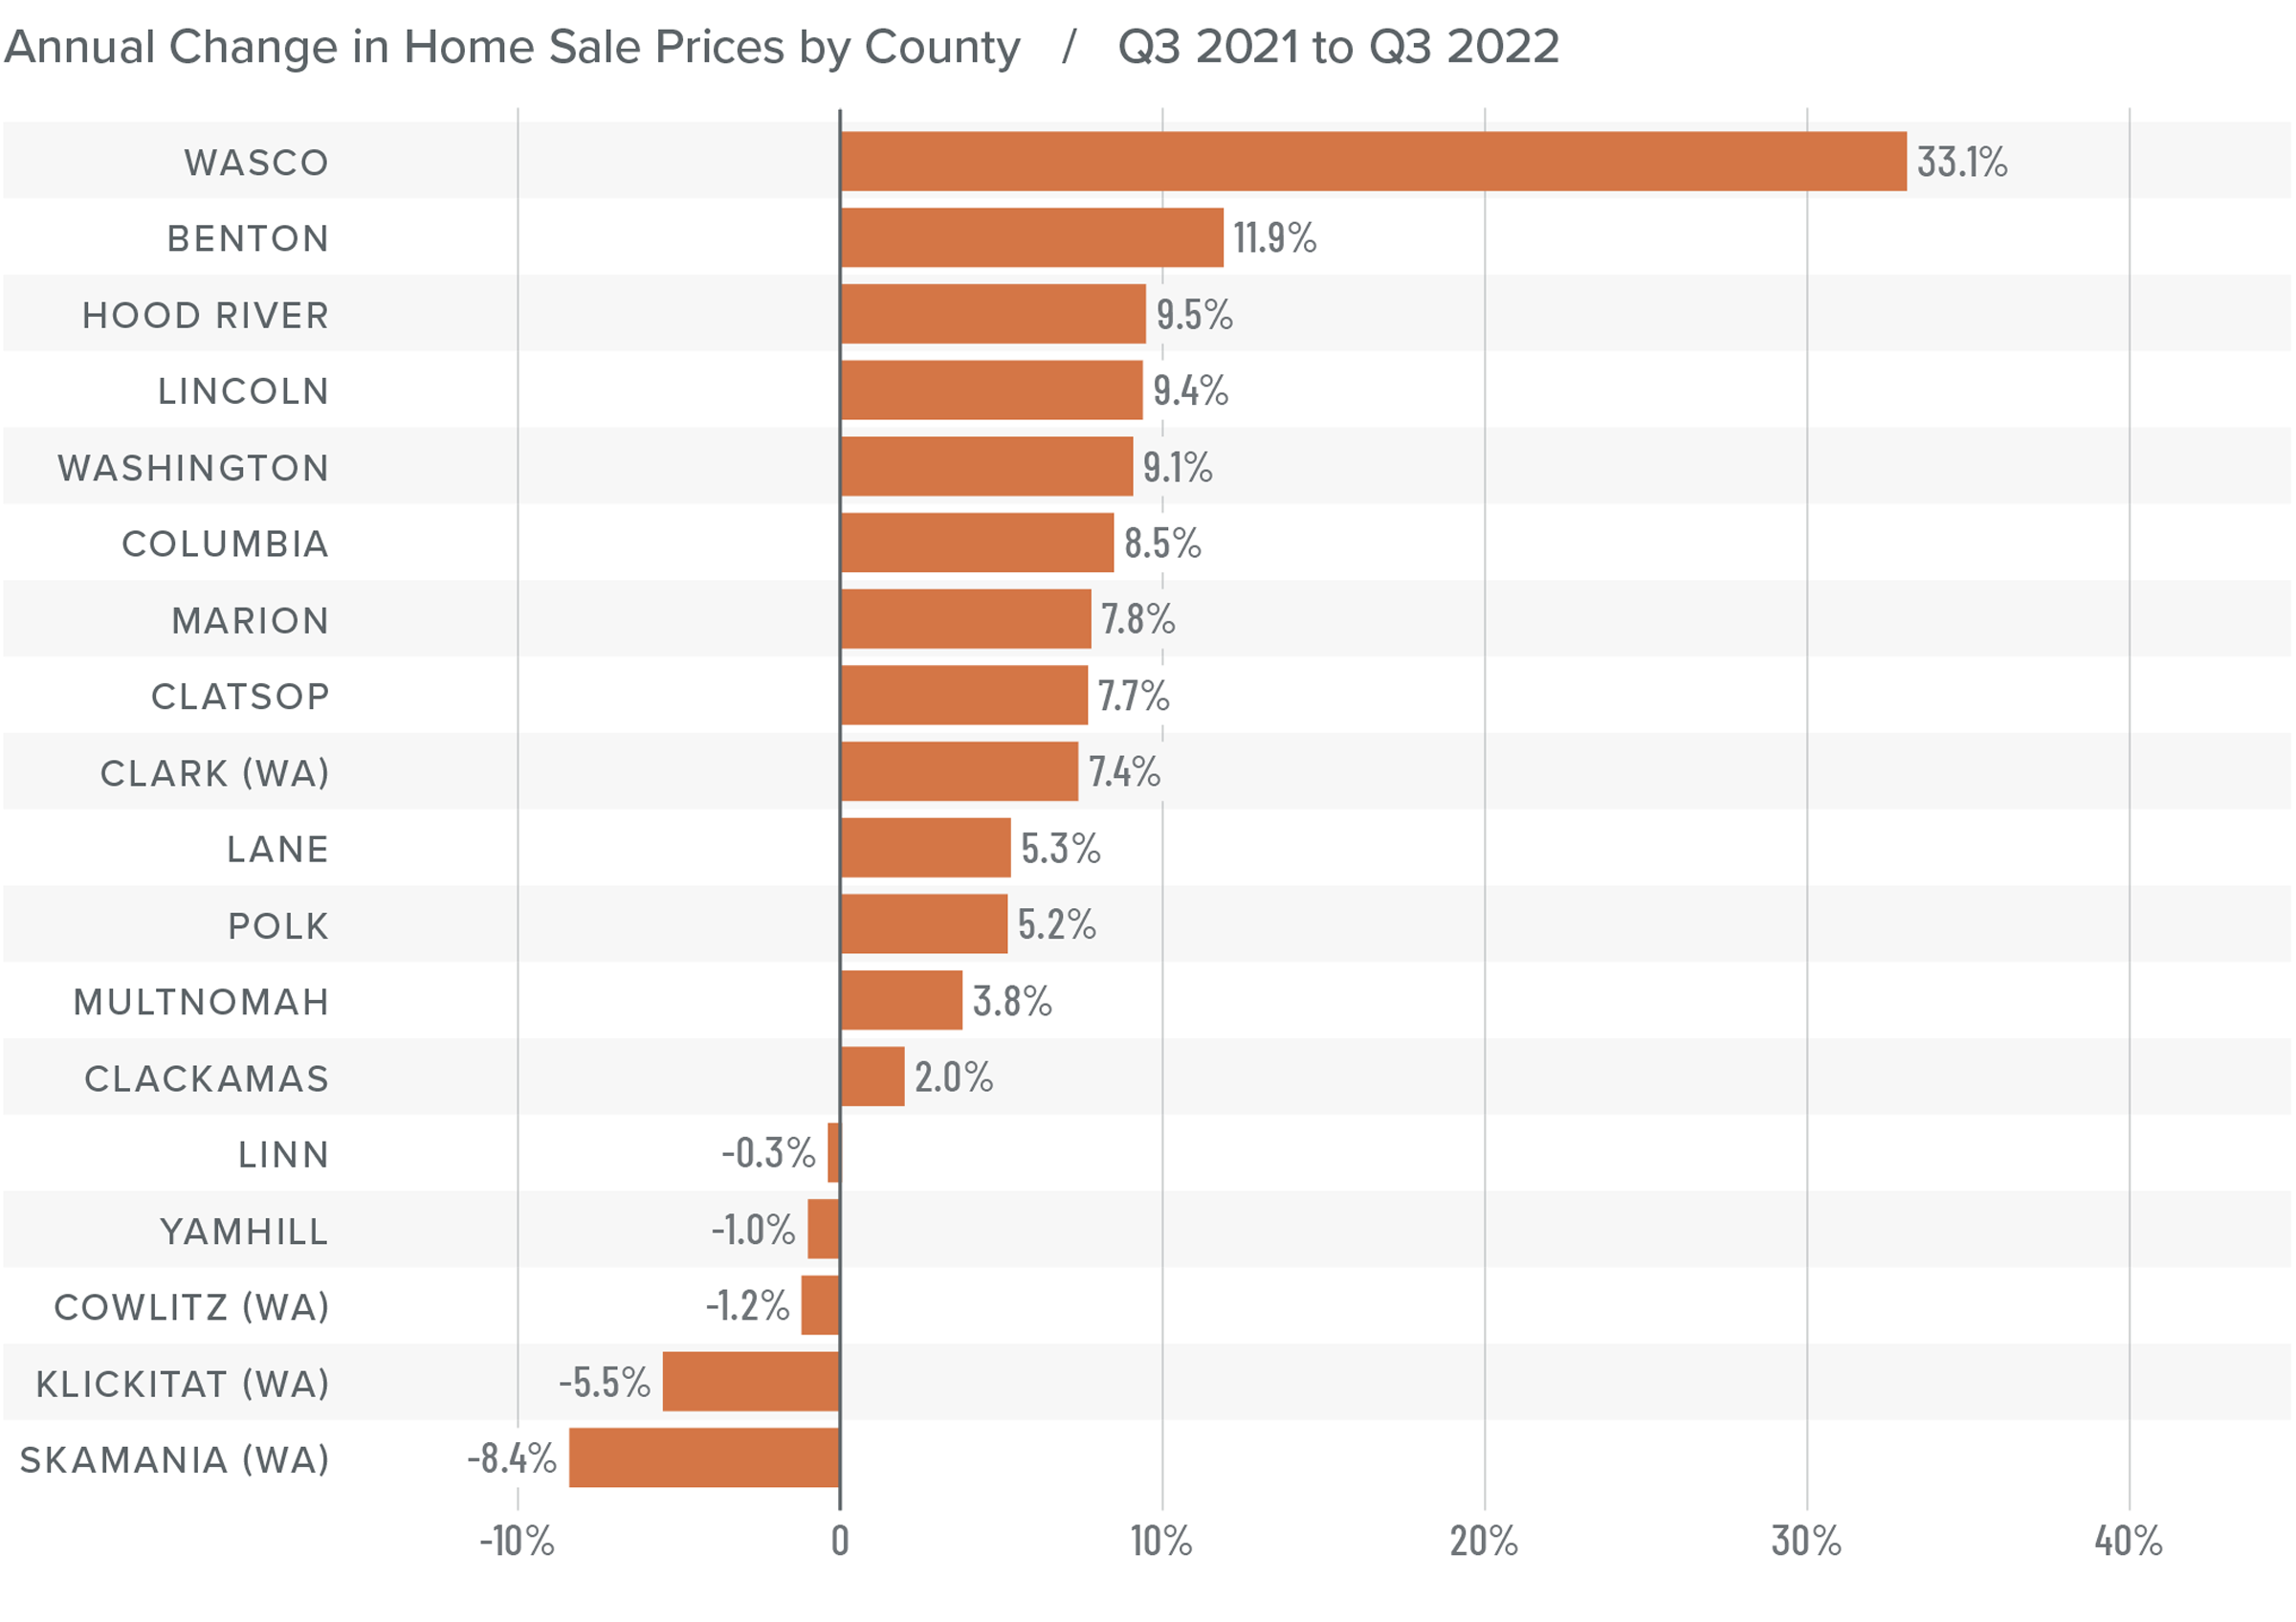
❱ The average home sale price in the region rose 5% year over year to $566,595. Prices were 3.9% lower than in the second quarter of this year.
❱ Relative to the second quarter of 2022, average prices rose in Benton, Clatsop, Lincoln, and Wasco counties. They remained static in Marion County but fell in the balance of the markets.
❱ All but five counties saw average sale prices rise compared to a year ago, but the pace of growth is certainly slowing.
❱ Clearly, rising mortgage rates have started to impact home prices. Median list prices are still rising in almost all markets compared to the second quarter, which suggests that sellers continue to be confident. That said, I expect to see either list prices start to soften or sellers take their homes off the market until they see conditions improving.
Mortgage Rates
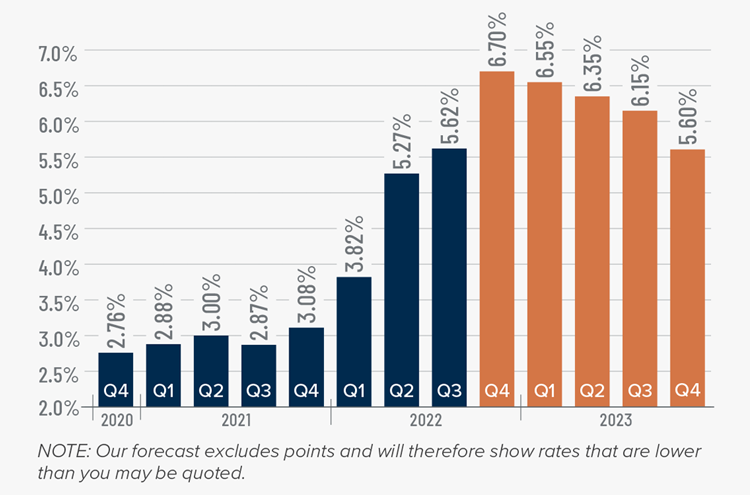
This remains an uncertain period for mortgage rates. When the Federal Reserve slowed bond purchases in 2013, investors were accused of having a “taper tantrum,” and we are seeing a similar reaction today. The Fed appears to be content to watch the housing market go through a period of pain as they throw all their tools at reducing inflation.
As a result, mortgage rates are out of sync with treasury yields, which not only continues to push rates much higher, but also creates violent swings in both directions. My current forecast calls for rates to peak in the fourth quarter of this year before starting to slowly pull back. That said, they will remain in the 6% range until the end of 2023.
Northwest Oregon and Southwest Washington Days on Market
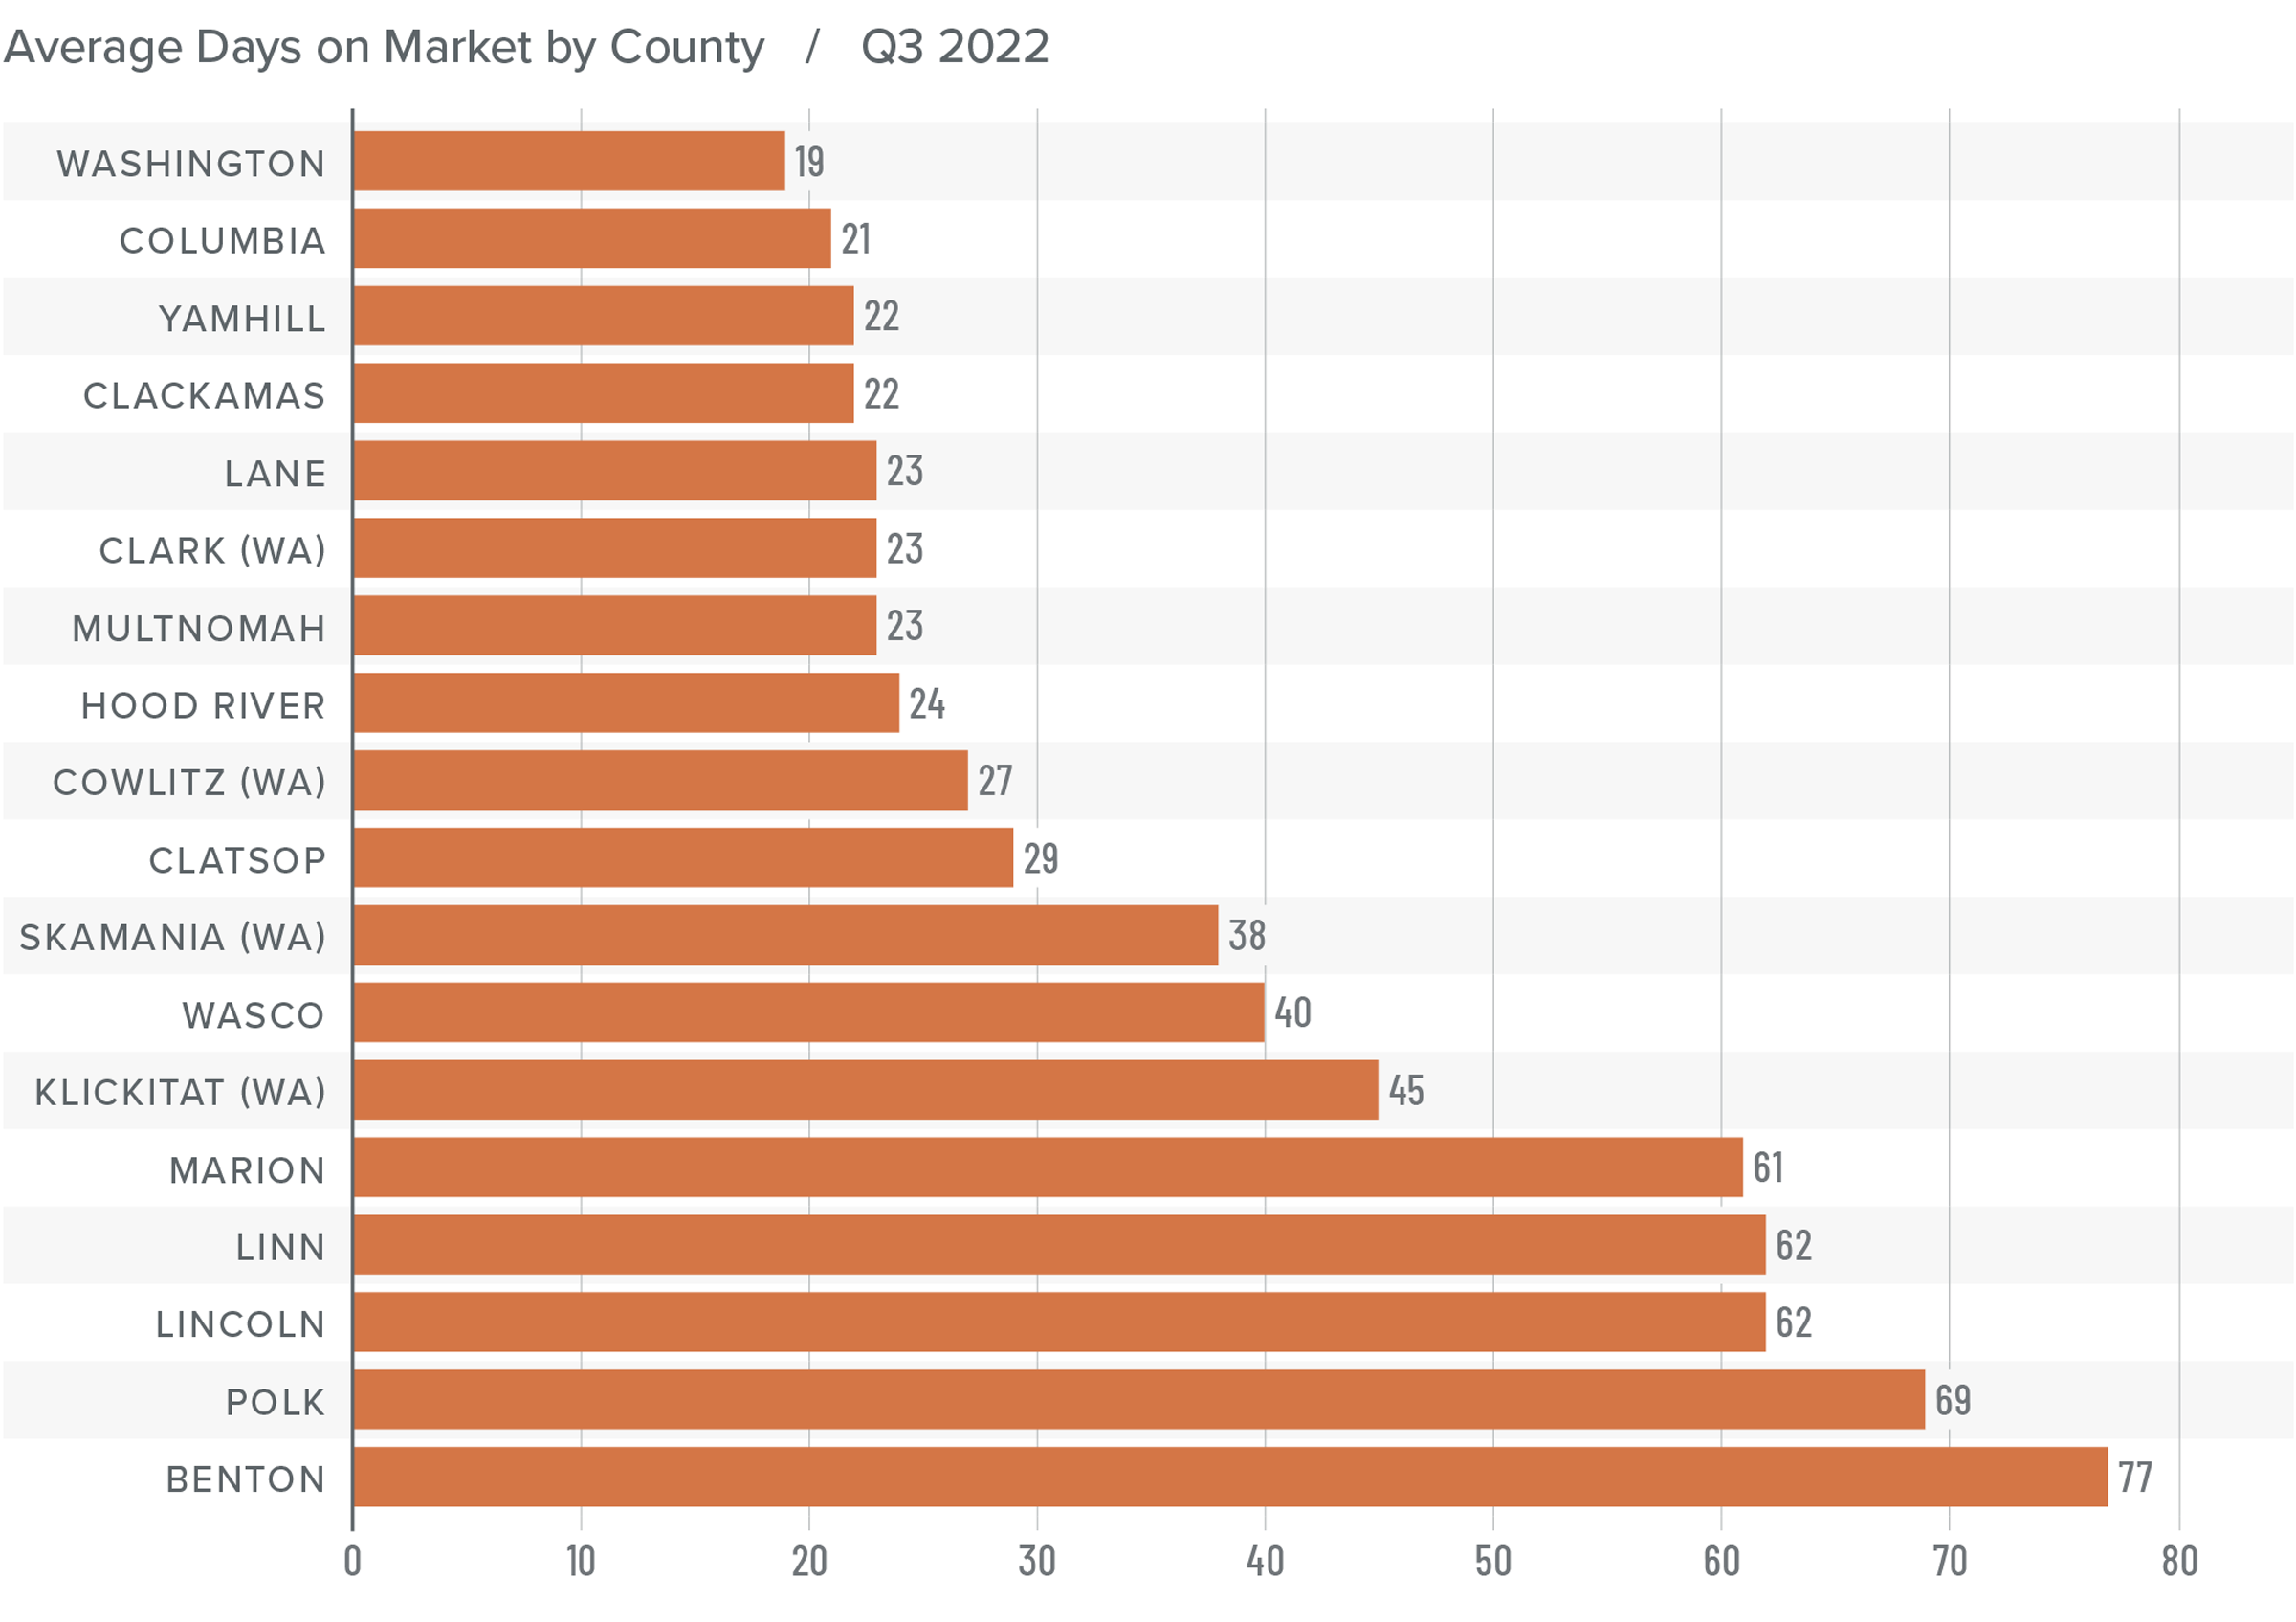
❱ The average number of days it took to sell a home in the region rose eight days compared to the same period a year ago. It took five more days for homes to sell compared to the second quarter of this year.
❱ The average time it took to sell a home in the third quarter of 2022 was 38 days.
❱ Lincoln County was the only market where the length of time it took for a home to sell fell compared to the same period a year ago. Compared to the second quarter of 2022, market time fell in Hood River, Linn, and Skamania counties.
❱ Although days on market have risen, they are still well below the pre-pandemic level. As mentioned earlier, uncertainty surrounding the housing market (mainly due to mortgage rates) is making buyers significantly more cautious. I expect this to change as we move into the new year.
Conclusions
This speedometer reflects the state of the region’s real estate market using housing inventory, price gains, home sales, interest rates, and larger economic factors.
Although the labor market is slowly recovering, the specter of an economic slowdown in 2023 is starting to weigh on the market. The rapid pace of home-price growth in 2020 and 2021 was never going to last forever. The market is currently going through a period of reversion, which will slow it to a more sustainable pace. Although this may be painful to watch for some, it is necessary. Sellers have seen the value of their homes skyrocket over the past two years, so even if we experience a modest downturn in home prices, they are still in a very good situation. I would add that 58% of homeowners with a mortgage in Northwest Oregon/ Southwest Washington have more than 50% equity in their homes.

All that considered, I am moving the needle more toward balance, but until buyers and sellers start to feel more confident in the local and national economy, the market is likely to continue experiencing uncertainty. This will lead to lower sales activity and put downward pressure on prices.
About Matthew Gardner
As Chief Economist for Windermere Real Estate, Matthew Gardner is responsible for analyzing and interpreting economic data and its impact on the real estate market on both a local and national level. Matthew has over 30 years of professional experience both in the U.S. and U.K.
In addition to his day-to-day responsibilities, Matthew sits on the Washington State Governors Council of Economic Advisors; chairs the Board of Trustees at the Washington Center for Real Estate Research at the University of Washington; and is an Advisory Board Member at the Runstad Center for Real Estate Studies at the University of Washington where he also lectures in real estate economics.
Q2 2022 Northwest Oregon and Southwest Washington Real Estate Market Update

The following analysis of select counties of the Northwest Oregon and Southwest Washington real estate market is provided by Windermere Real Estate Chief Economist Matthew Gardner. We hope that this information may assist you with making better-informed real estate decisions. For further information about the housing market in your area, please don’t hesitate to contact your Windermere Real Estate agent.
Regional Economic Overview
The Oregon counties contained in this report continue to recover, but employment levels are still down more than 61,000 from the pre-pandemic peak. This is mainly due to the Portland market as Multnomah County accounts for over half of the missing jobs. Even with employment not having fully recovered, the region’s unemployment rate was a healthy 3.5%, which is down from the pandemic peak of 12.8%. The Southwest Washington market has recouped all the jobs lost and added 6,600 more. During second quarter, the unemployment rate was 4.4%, which is down from 14% at the start of the pandemic.
Northwest Oregon and Southwest Washington Home Sales
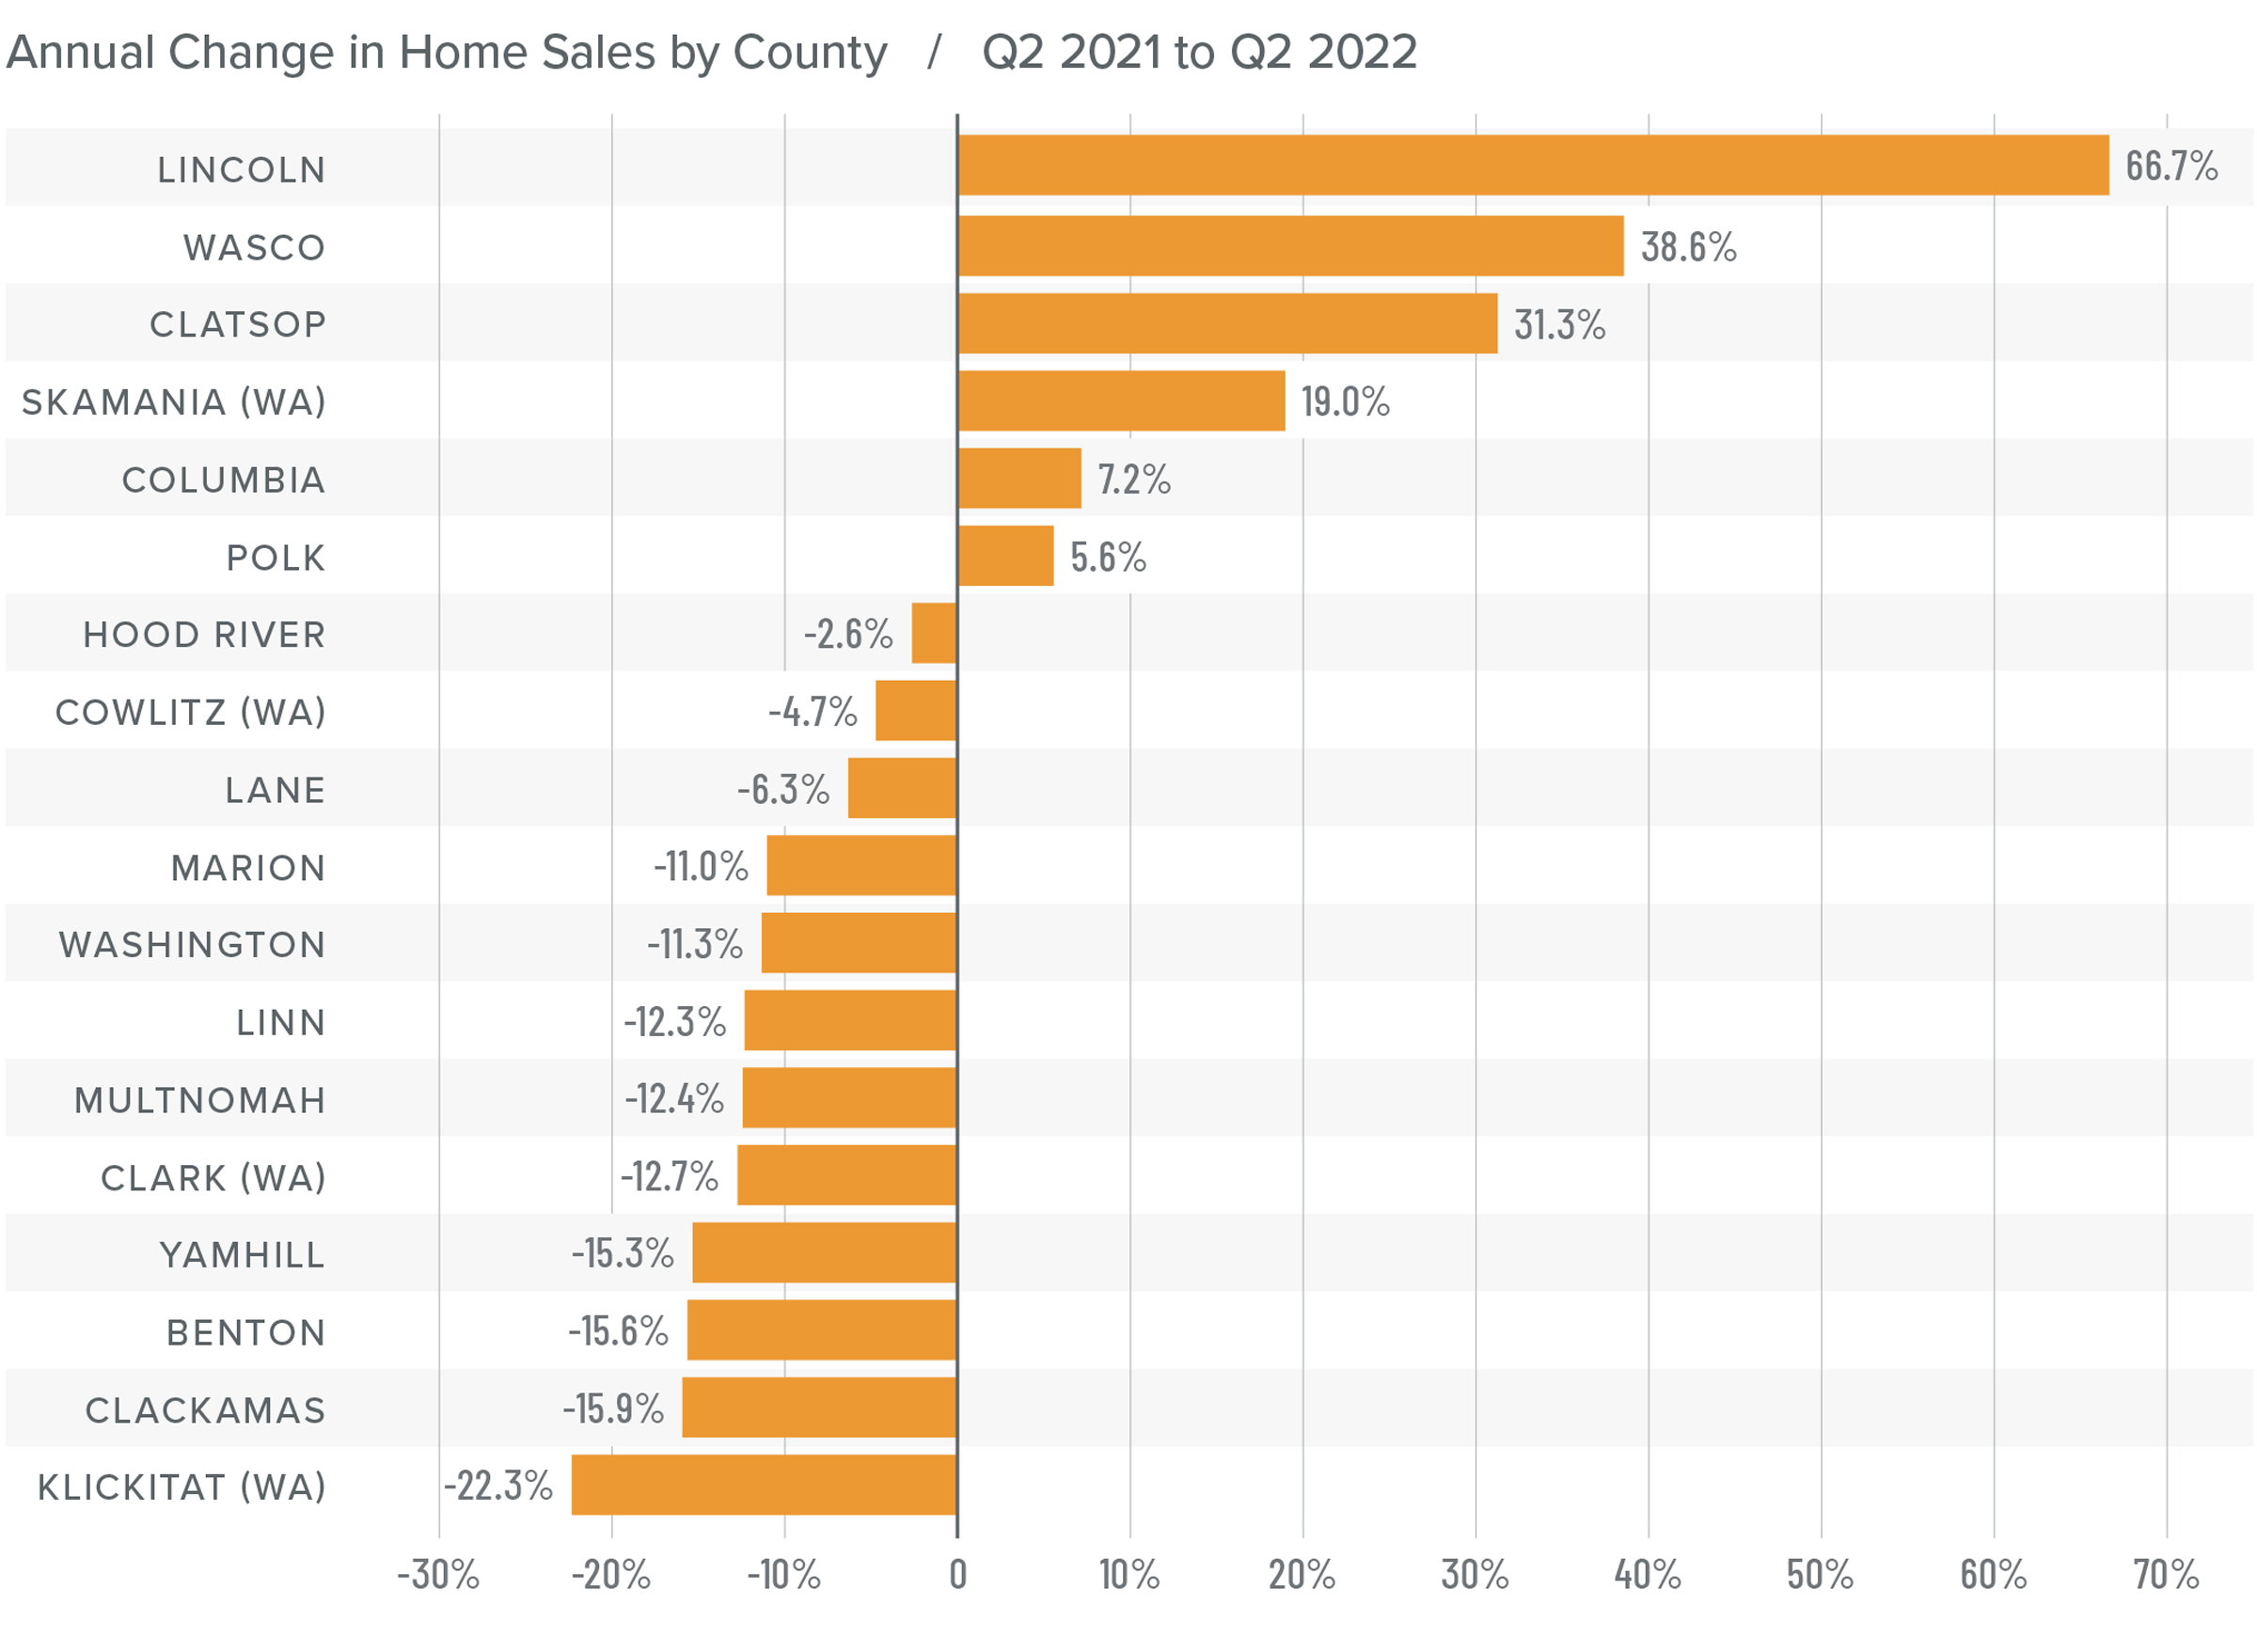
❱ In the second quarter, 14,558 homes sold, which is a drop of 10% compared to a year ago. Sales rose more than 33% compared to the first quarter of the year.
❱ Compared to the first quarter of this year, sales rose across the board, with double-digit increases in every county other than Clatsop.
❱ Although year-over-year sales fell overall, several markets saw transactions increase. Lincoln, Wasco, Clatsop, and Skamania counties had solid gains.
❱ The tangible growth in sales comes at a time when inventory levels have also grown significantly. This suggests that demand remains strong.
Northwest Oregon and Southwest Washington Home Prices
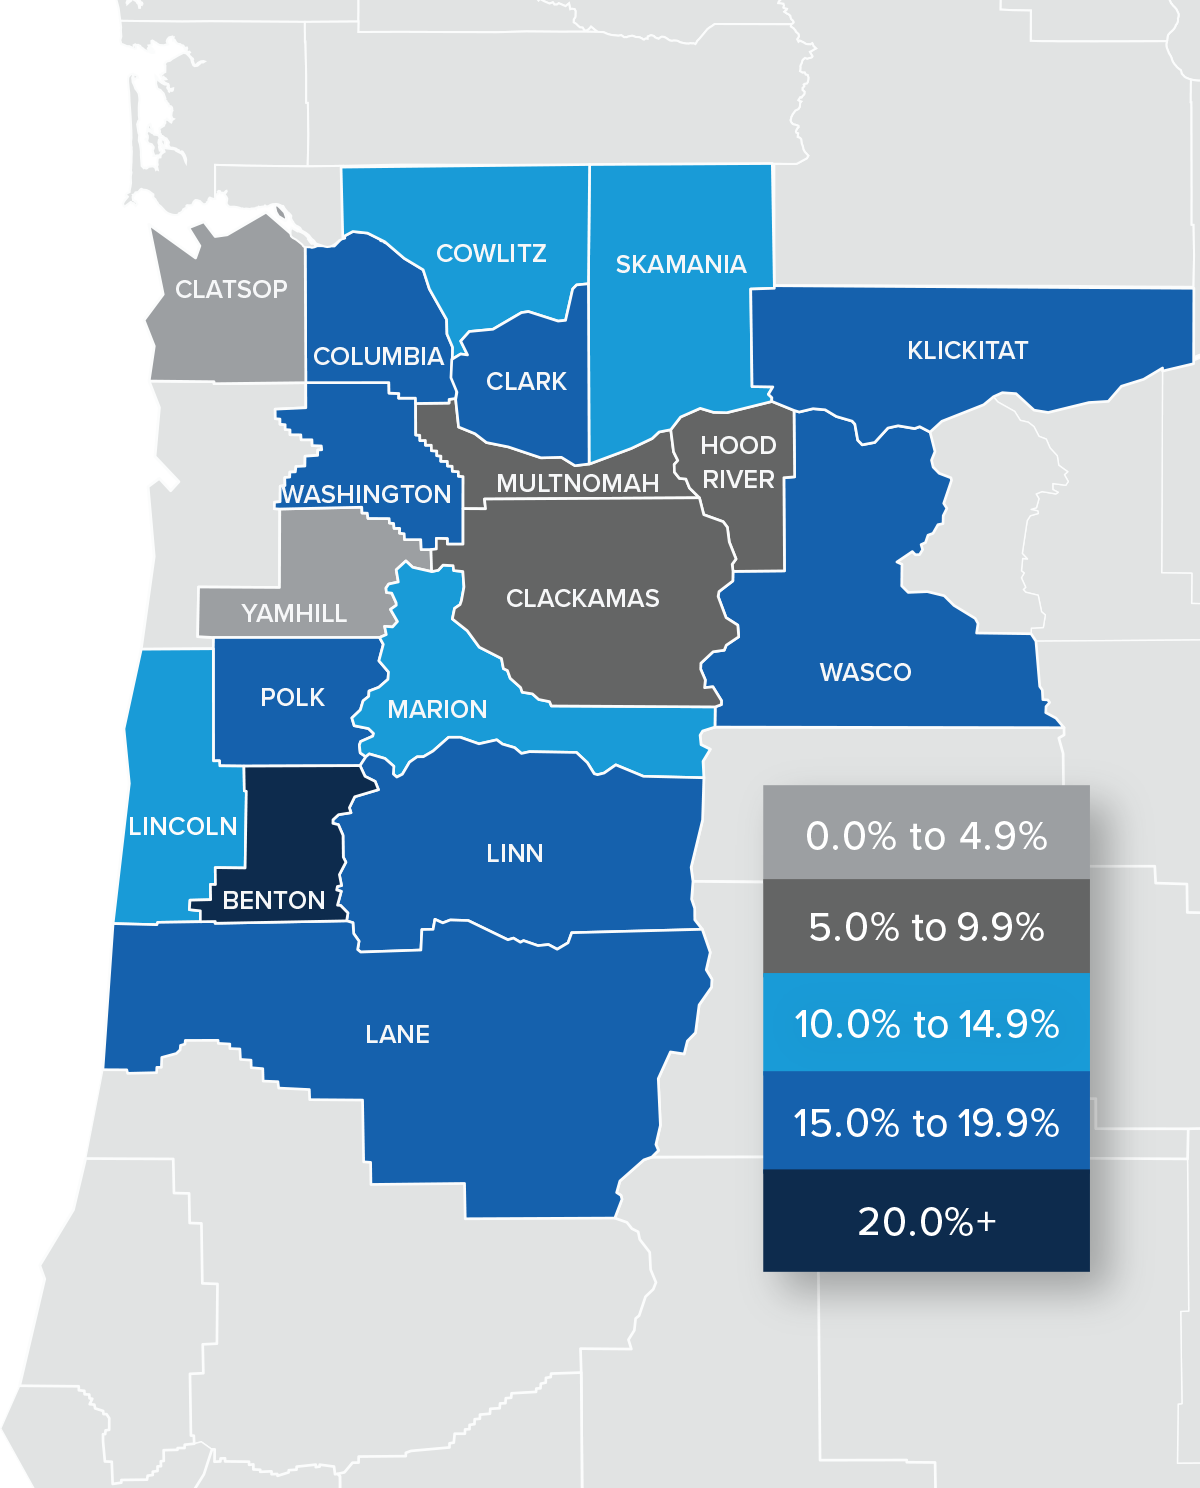
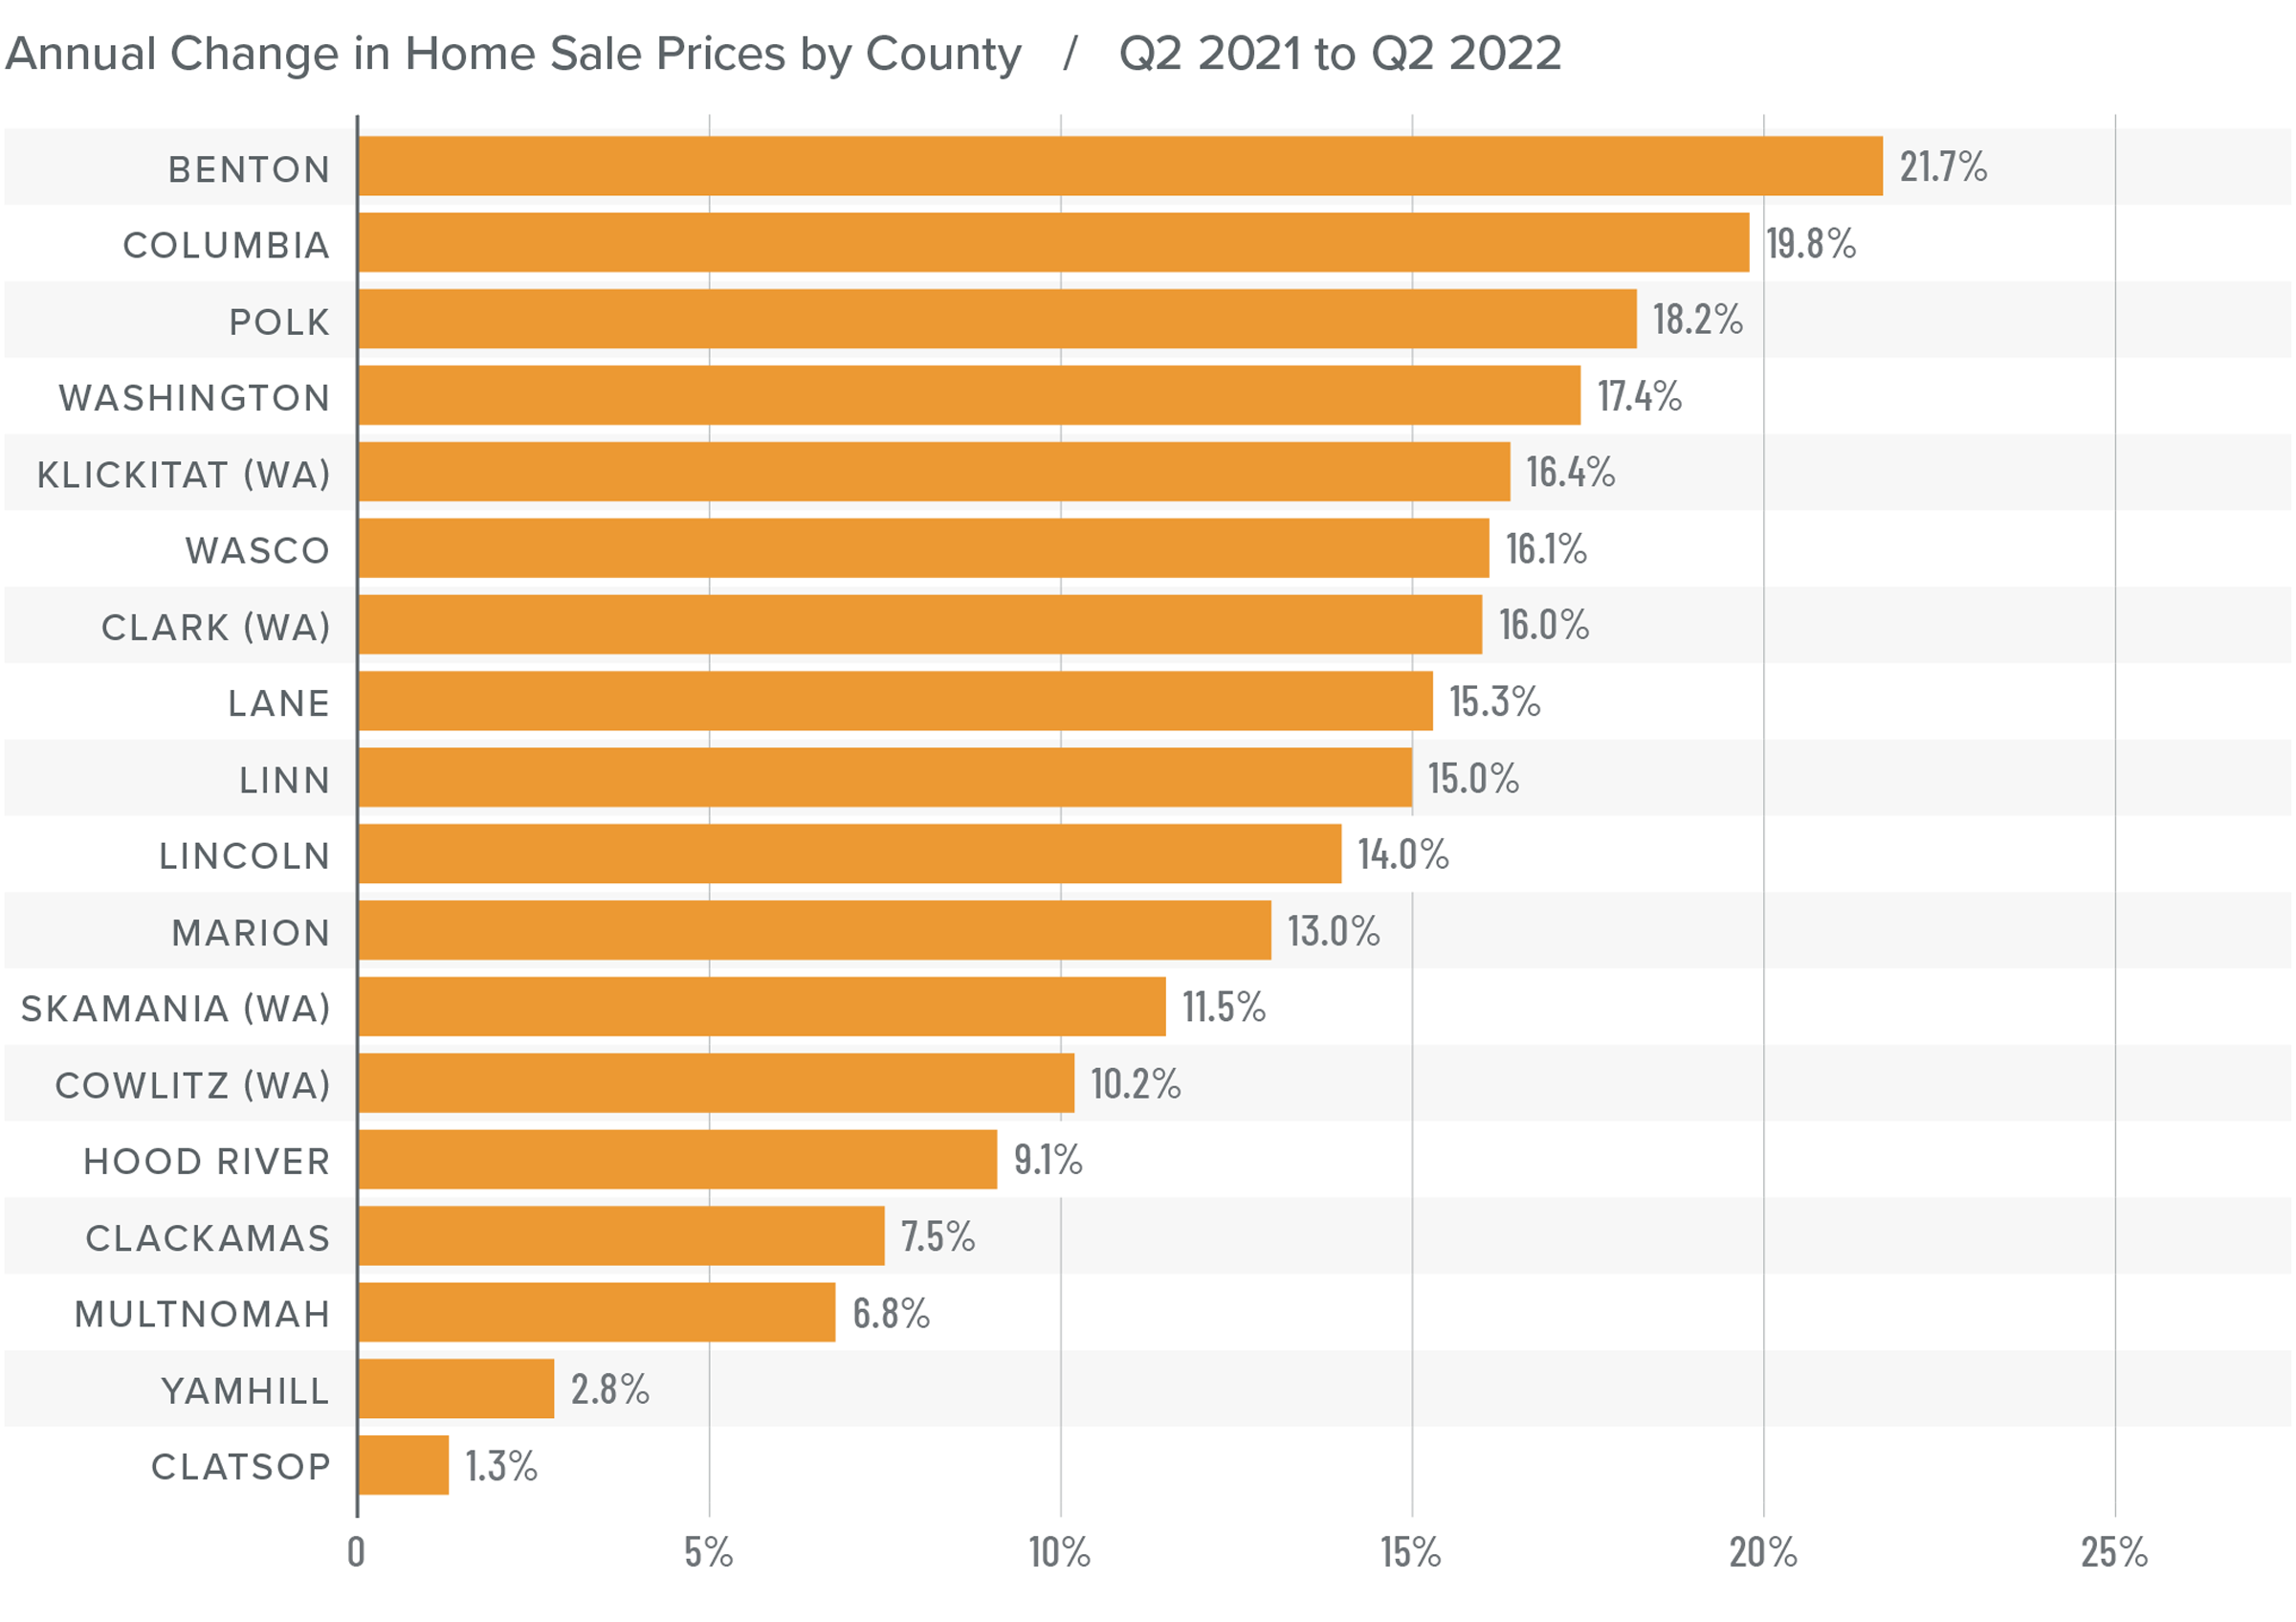
❱ The average home sale price in the region rose 11.2% year over year to $589,526. Prices were 7.8% higher than in the first quarter of 2022.
❱ Relative to the first quarter of 2022, average prices rose in all counties other than Clatsop and Columbia. Home prices were up by more than 20% in Hood River and Klickitat counties.
❱ All but five counties saw average sale prices rise more than 10% compared to a year ago.
❱ Rising mortgage rates have yet to impact home prices. Median list prices are still rising in most markets, which suggests that home sellers remain confident. I will be closely monitoring list prices going forward, as they will be the first indicator that the market may be cooling; I currently see no real signs of this.
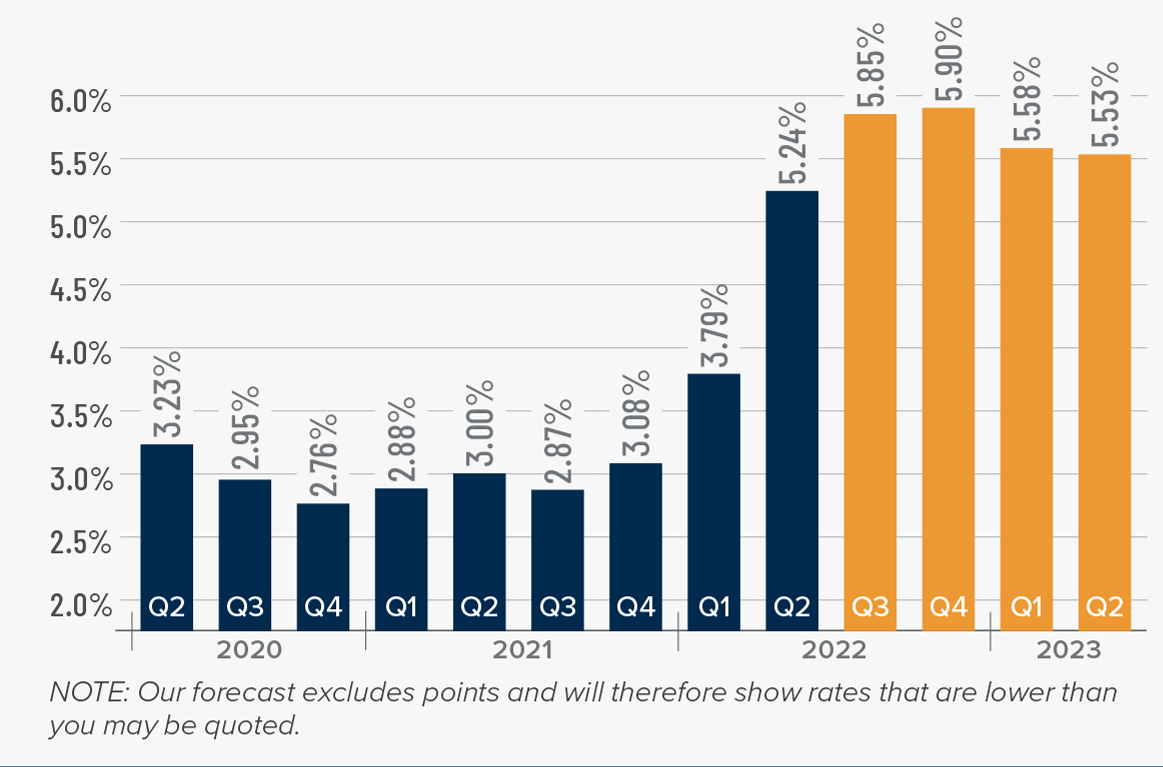
Mortgage Rates
Although mortgage rates did drop in June, the quarterly trend was still moving higher. Inflation—the bane of bonds and, therefore, mortgage rates—has yet to slow, which is putting upward pressure on financing costs.
That said, there are some signs that inflation is starting to soften and if this starts to show in upcoming Consumer Price Index numbers then rates will likely find a ceiling. I am hopeful this will be the case at some point in the third quarter, which is reflected in my forecast.
Northwest Oregon and Southwest Washington Days on Market
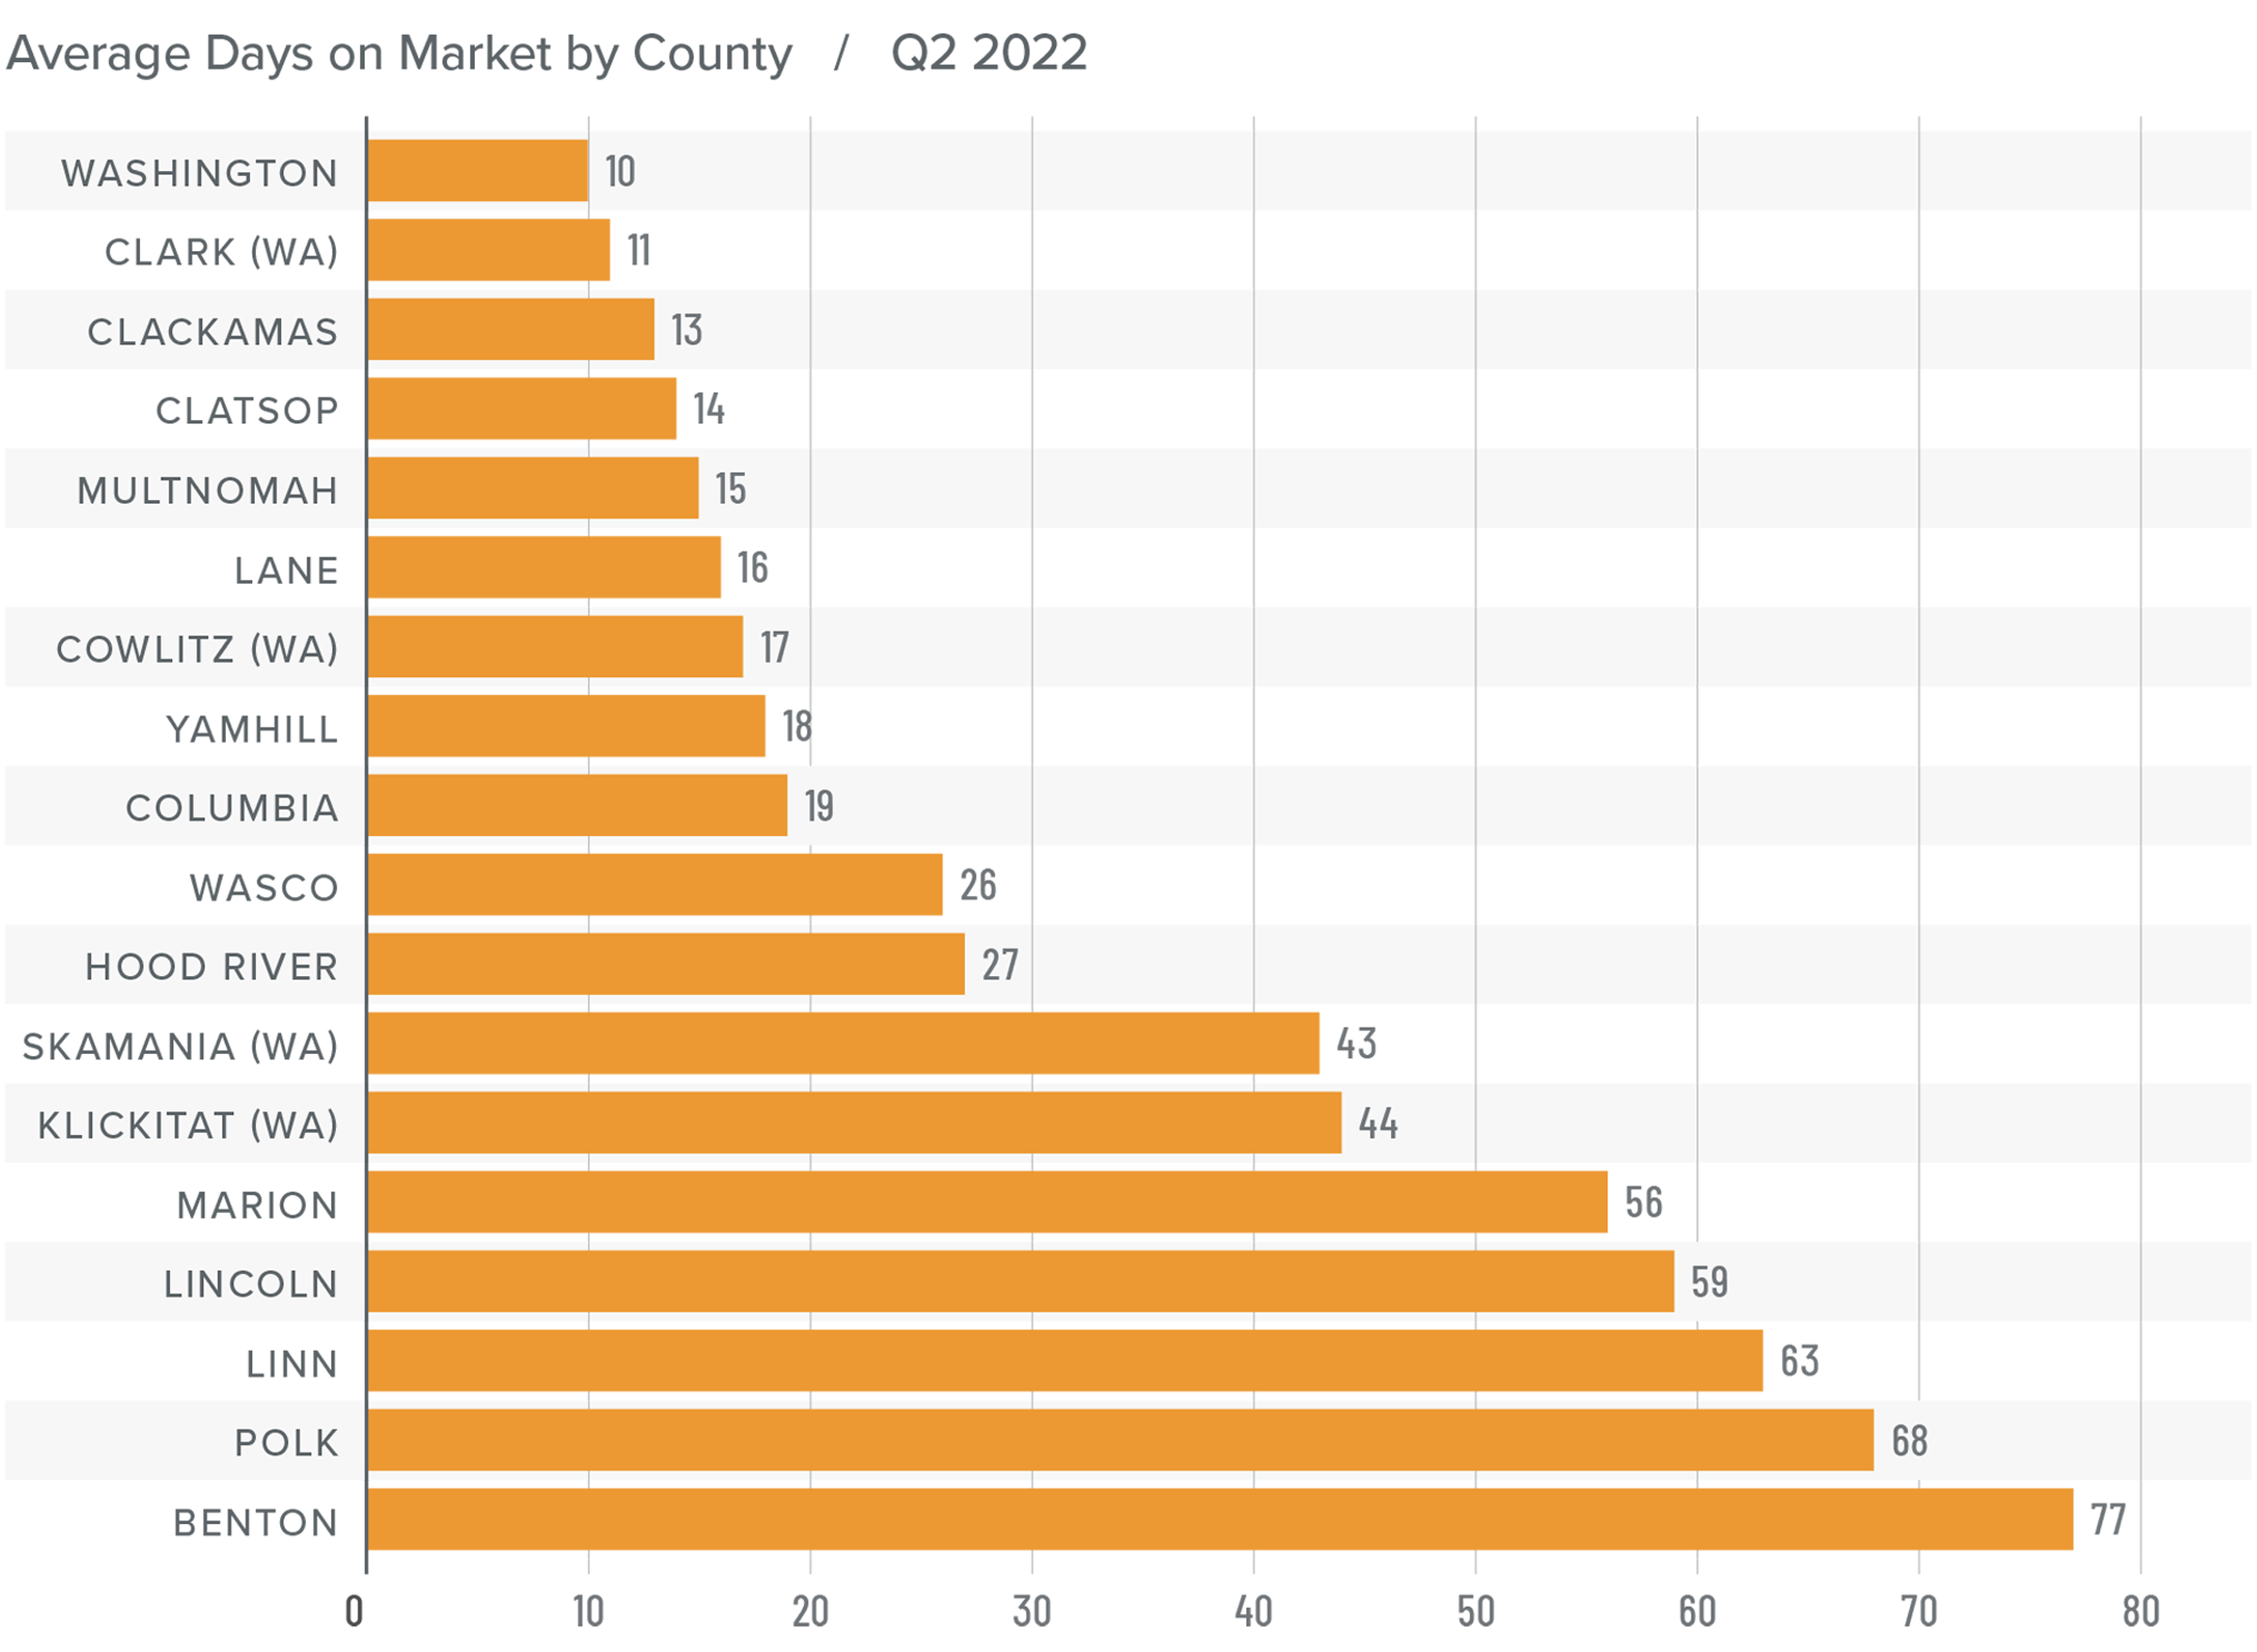
❱ The average time it took to sell a home in the region fell 2 days compared to the same period a year ago. It took 11 fewer days for homes to sell compared to the first quarter of 2022.
❱ The average time it took to sell a home in the second quarter of 2022 was 33 days.
❱ Skamania, Polk, Marion, Lane, and Cowlitz counties saw market time rise, while market time dropped or remained static in the rest of the region compared to a year ago. Compared to the first quarter, market time fell in all markets other than Hood River, where it rose by a modest two days.
❱ Interestingly, the average days on market in the second quarter of 2019 (pre-pandemic) was 62 days, which tells me that the current market remains bullish.
Conclusions
This speedometer reflects the state of the region’s real estate market using housing inventory, price gains, home sales, interest rates, and larger economic factors.
Though the job market is recovering more slowly than I would like, the housing market is still performing strongly. As we move through the year, some may believe that the market is underperforming, but this is not the case. Along with much of the rest of the country, the Northwest Oregon and Southwest Washington housing markets have been overperforming since the onset of the pandemic. As I expect the market to start trending back to its pre-pandemic pace of sales and price growth, the slowdown might feel exaggerated, but there is no cause for concern.

Despite dramatically rising financing costs, buyers still appear to be motivated. List prices have yet to “roll over,” suggesting that sellers are still confident. This, combined with the other data presented here, tells me that they are still in the driver’s seat.
About Matthew Gardner
As Chief Economist for Windermere Real Estate, Matthew Gardner is responsible for analyzing and interpreting economic data and its impact on the real estate market on both a local and national level. Matthew has over 30 years of professional experience both in the U.S. and U.K.
In addition to his day-to-day responsibilities, Matthew sits on the Washington State Governors Council of Economic Advisors; chairs the Board of Trustees at the Washington Center for Real Estate Research at the University of Washington; and is an Advisory Board Member at the Runstad Center for Real Estate Studies at the University of Washington where he also lectures in real estate economics.
")


