
 Facebook
 X
X
 Pinterest
 Copy Link
Local Look Western Washington Housing Update 12/10/25

Hi. I’m Jeff Tucker, principal economist at Windermere Real Estate, and this is a Local Look at the November 2025 data from the Northwest MLS.
This November, the Washington housing market continued with its normal seasonal cooldown. And compared to last year, this month looked particularly cool, because 2024 featured an especially strong fourth quarter, which has NOT been repeated this year.
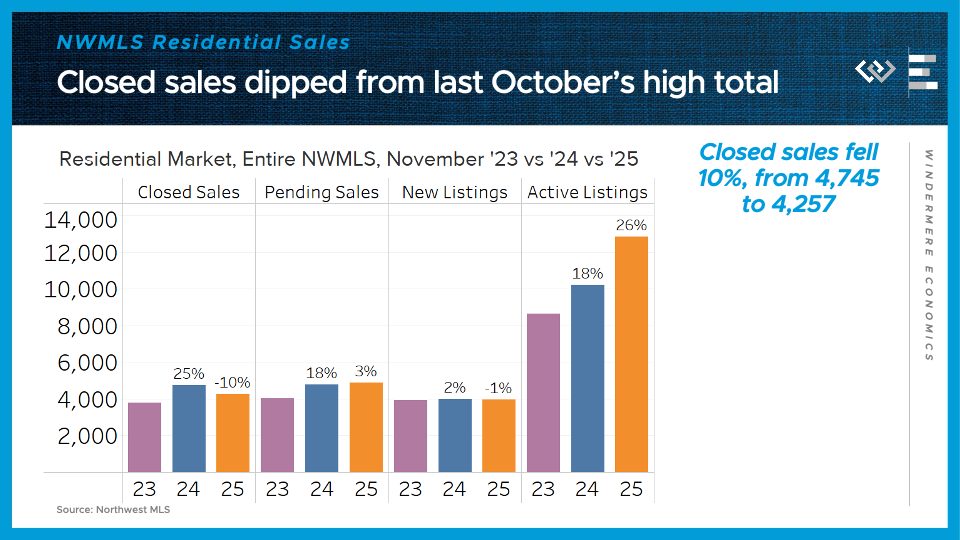
Across the Northwest MLS, closed home sales came in 10% below last November’s total. And pending sales, which give some signal about next month’s sales, actually inched up by 3% from the same time last year.
On the supply side, the flow of new listings was almost identical, or down just 1%, from last November’s pace. Finally, the month ended with 26% more active listings than last November, swinging negotiating power in buyers’ favor .
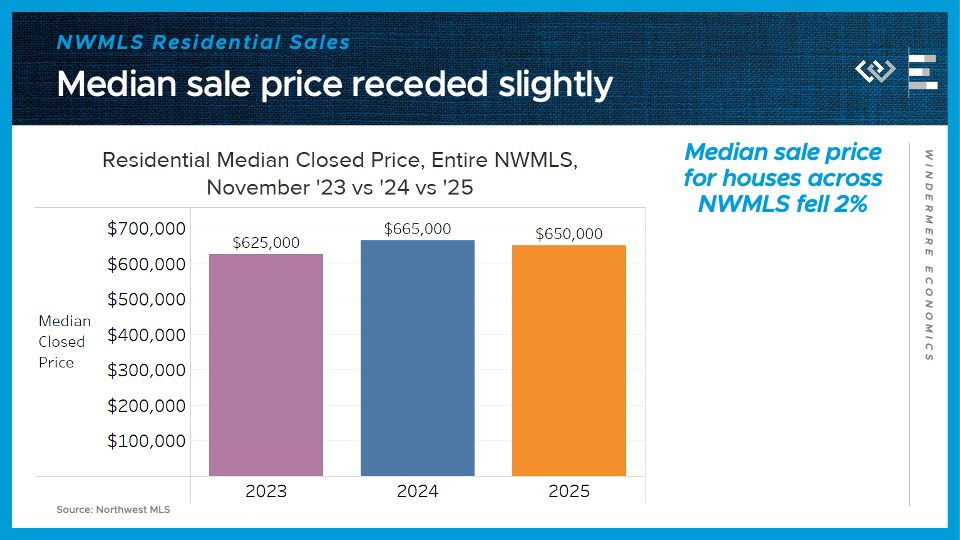
Those higher inventory levels are starting to put some downward pressure on prices, which dipped by $15,000, to a median of $650,000 for a residential home sale in November.
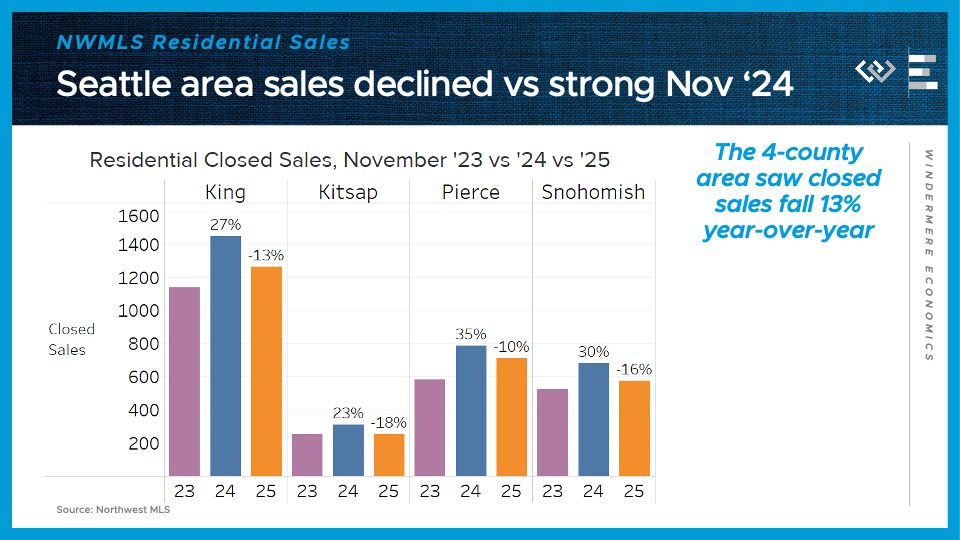
Now I’ll turn to a closer look at the four counties encompassing the greater Seattle area.
Closed sales dropped by 13% from last November, and none of the four counties was spared from double-digit declines, led by an 18% drop in Kitsap County.
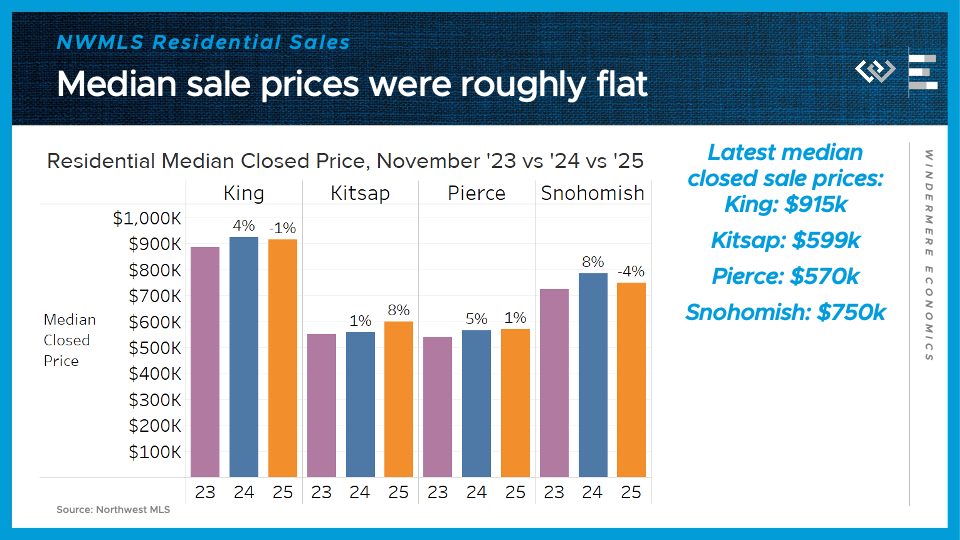
Median sale prices showed roughly no gains around the region: 1% lower in King; 8% higher in Kitsap; 1% higher in Pierce, and 4% lower in Snohomish County. It seems clear now that inventory growth this year has dragged price appreciation down to about 0 for the time being.
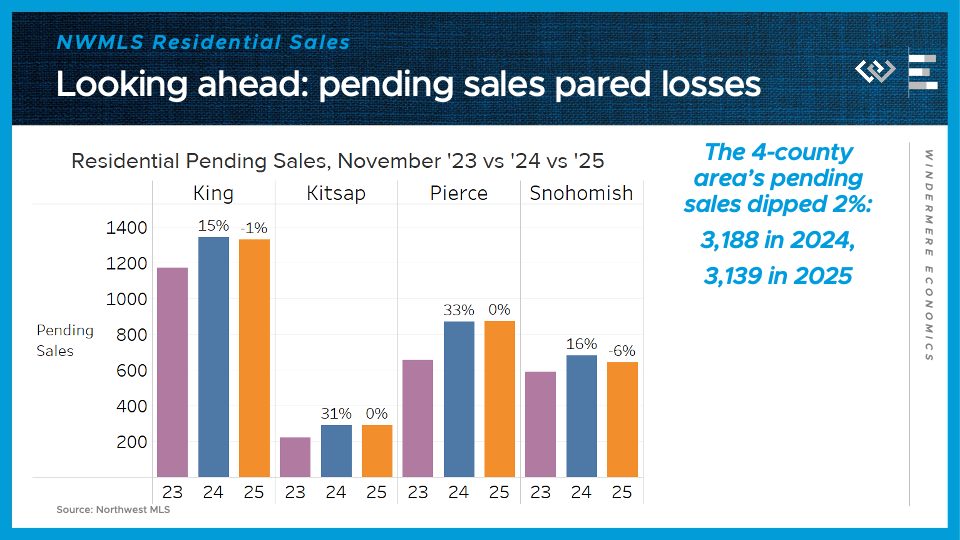
Looking ahead, pending sales dipped only 2% across the region in November, thanks mainly to Snohomish’s 6% decline, while the other 3 counties were nearly flat.
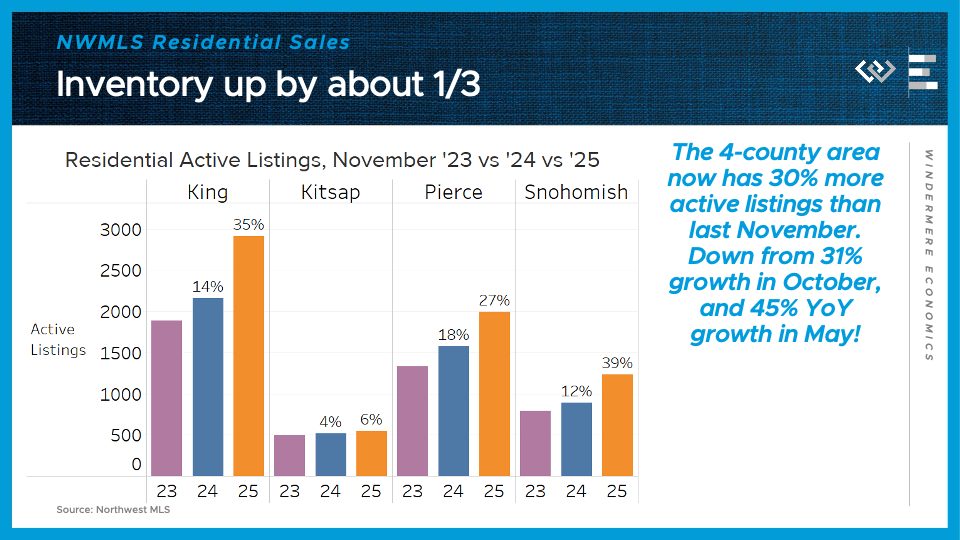
On the supply side, the 4-county greater Seattle area had 30% more active listings than at the end of November 2024. I’ve highlighted before that this pace of growth is decelerating, but that deceleration itself may have stalled out: October had a nearly identical 31% growth rate of inventory.
This continues to bode well for buyers, who are now set up to approach the new year with more inventory and bargaining power than they’ve seen in years. For anyone who can squeeze house hunting in between their holiday gift shopping this month, they’ll be well-positioned to find a bargain, even now that Black Friday deals are gone from the stores!
Six Predictions for 2026

The following is a summary of Windermere Principal Economist Jeff Tucker’s six predictions for the U.S. housing market and economy in 2026. He goes into more detail about his predictions in the video below.
1. Existing Home Sales Will Pick Up (Barely)
Home sales have hovered near generational lows for three years. While a sharp rebound is unlikely, conditions point to a modest uptick in 2026. Inventory levels are higher than they’ve been since 2019, and mortgage rates are lower than they’ve been since 2022. Together, those factors should lift existing home sales—but not by much.
2. Home Prices Will Be Roughly Flat
Home prices are likely to remain flat in 2026, largely due to higher inventory putting downward pressure on values. The Case-Shiller Home Price Index showed small declines last summer, though that trend faded by fall. Sellers have been highly responsive to market shifts, often de-listing when offers fall short or holding off on listing altogether. That restraint has kept prices from falling further despite growing supply
3. Inventory Will Climb to Pre-Pandemic Levels
The number of homes for sale will likely return to pre-pandemic levels in 2026, possibly as early as spring. Inventory rose sharply in 2025, and a “shadow supply” of homes—those whose owners are waiting for better conditions—remains in the wings. Many “discretionary sellers” will continue testing the market, holding out for the right price. That behavior should extend average time on market and boost total listings, giving buyers more options and negotiating power.
4. The Homeownership Rate Will Decline
At current prices and interest rates, homeownership remains out of reach for many middle-class Americans who would have bought in different conditions. Slower rent growth has also reduced urgency among would-be buyers, encouraging them to stay put. More renters are opting for single-family homes to enjoy the space and lifestyle of ownership without a mortgage, a shift that will help push the overall homeownership rate slightly lower.
5. Mortgage Rates Will Decline Slightly
Mortgage rates should remain below 6.25% for most of 2026 and could briefly dip under 6%. The Fed’s rate cuts and slower growth have brought 10-year Treasury yields near 4%, while the spread between Treasuries and mortgage rates has narrowed toward its normal range of 2% or less. That trend is expected to continue as refinance risk on mortgage-backed securities gradually fades, but much of the improvement is already reflected in current rates, so significant declines are unlikely.
6. We Will Avoid a Recession in 2026
The U.S. economy weathered several shocks in 2025 but avoided a downturn. Payroll gains have slowed, though more due to shrinking labor supply than weak demand, and unemployment claims have remained stable. After early trade policy turbulence, corporate earnings rebounded strongly, and tariff concerns have faded as court challenges and new trade deals rolled back some of the costliest restrictions.
The Latest Numbers to Know 11/19/25: Jobs, Housing, & Rates

This is the latest in a series of videos with Windermere Principal Economist Jeff Tucker, where he delivers the key economic numbers to follow to keep you well-informed about what’s going on in the real estate market.
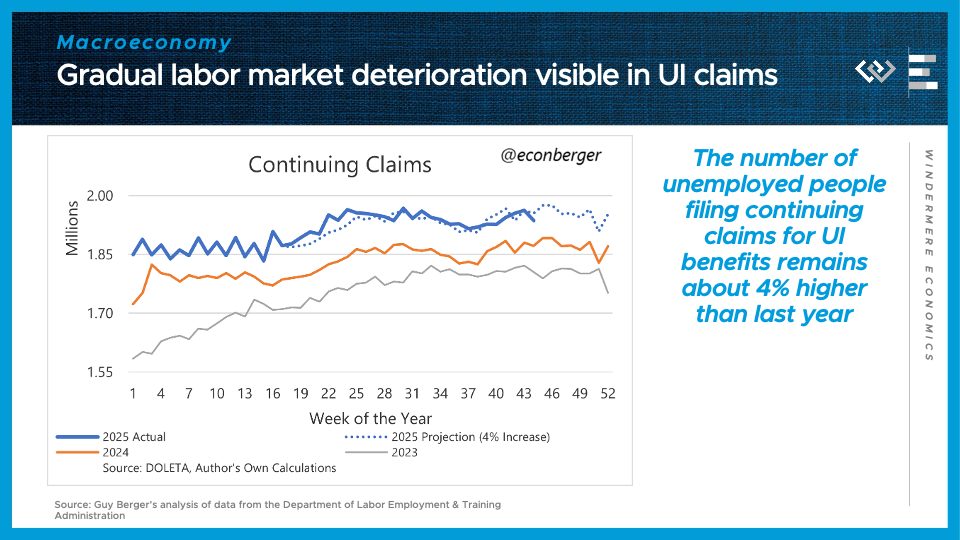
The first number to know this week: 4%. That is how much higher unemployment claims are than this time last year. We don’t actually know the unemployment rate due to the government shutdown, which suspended collection of the household survey it’s based on, so instead economists have turned to state-level data sources. Labor economist Guy Berger shared this chart comparing continuing unemployment claims in 2025, in blue, to the last two years, showing a consistent, gradual 4% year-over-year increase. That’s not great news, but it still doesn’t indicate a sudden breakdown in economic growth. We’ll get a better picture of the economy as the Bureau of Labor Statistics resumes publishing data in the remainder of 2025.
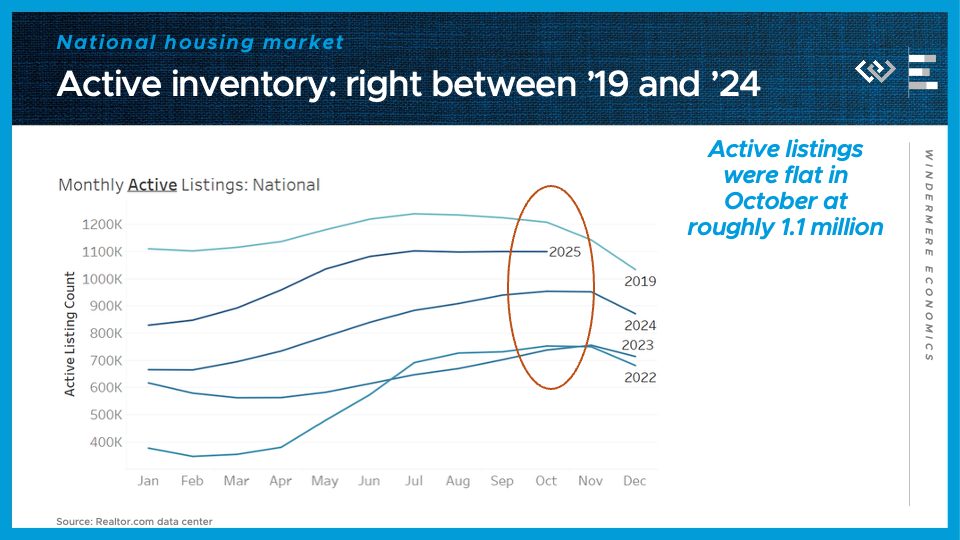
Turning to the housing market: Realtor.com reported almost exactly 1.1 million active listings for sale at the end of October, for the third month in a row. One interesting trend this chart makes clear is that, since 2020, sellers have been more willing to keep listings up later into the fall than they tended to in 2019. That means we are closer now to 2019 inventory levels than at any other time since the pandemic began.

But for the fifth month in a row, the pace of growth of inventory has fallen yet again, now down to just 15% year-over-year. The big growth of active listings this spring and summer helped throw some cold water on price appreciation, pushing it down near to 0, but that inventory growth has slowed down enough that nationally, prices look most likely to flatline next year rather than plunge into negative territory.
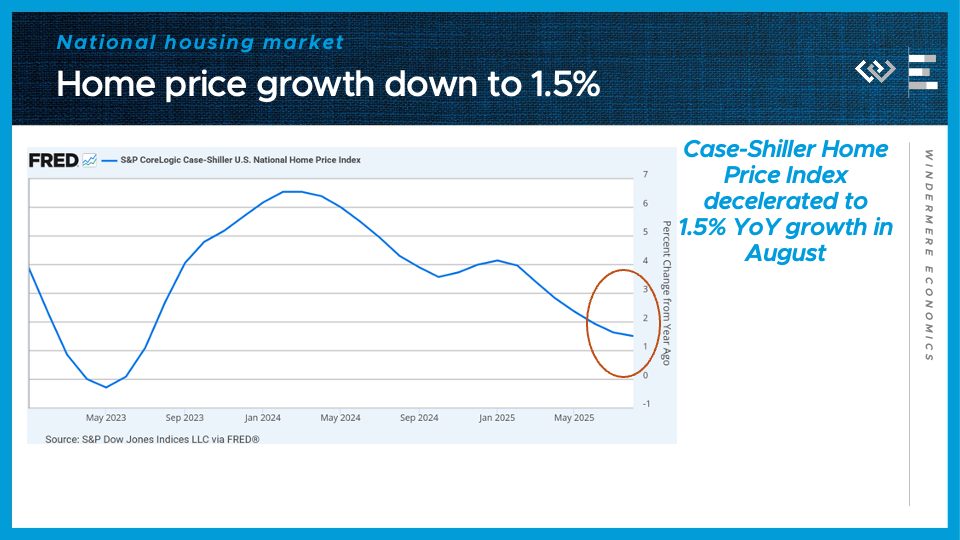
That brings me to the next number to know: 1.5%. That’s the most recent year-over-year change in the Case-Shiller Home Price Index, and the slowest pace of home price appreciation since early 2023.
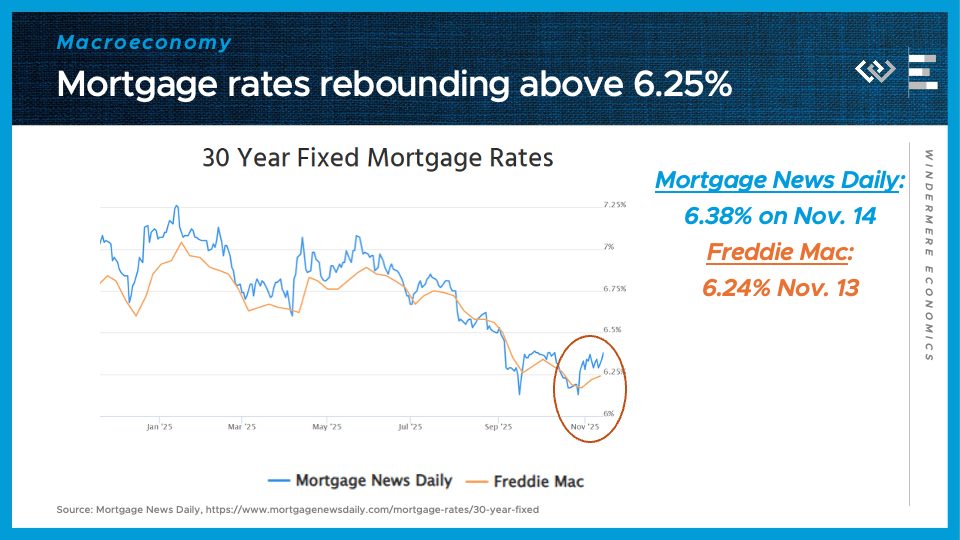
The other puzzle piece for home purchase affordability took a little step in the wrong direction last month: Mortgage rates rebounded from below 6.25% to more like 6 and 3/8, according to Mortgage News Daily. That’s still lower than they were last winter, and it just goes to show that mortgage rates rarely stick to the script and follow a predictable long-term trend.
That is all for this month; I look forward to more economic data in December, and thanks as always for watching!
Local Look Western Washington Housing Update 11/6/2025

Hi. I’m Jeff Tucker, principal economist at Windermere Real Estate, and this is a Local Look at the October 2025 data from the Northwest MLS.
This October, the Washington housing market began its usual seasonal shift into the cooler 4th quarter. Compared to last year, it looked particularly cool, because last October saw a sudden burst of buying activity in the wake of the Fed finally beginning to cut interest rates.
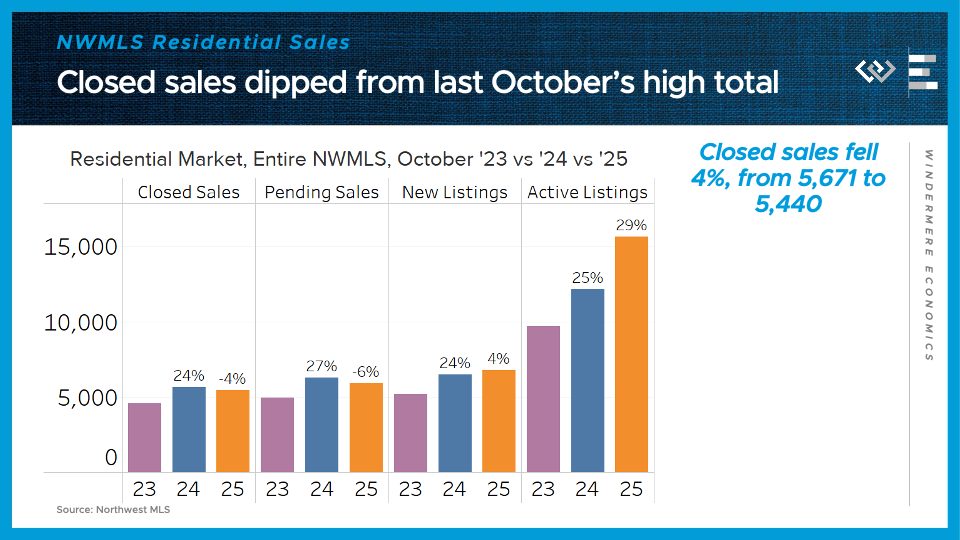
Across the Northwest MLS, closed home sales came in 4% below last October’s total. MLS. Pending sales, which give some signal about next month’s sales, were down 6% from the same time last year.
On the supply side, the flow of new listings remains roughly even with last year’s, or just 4% higher. Finally, the month ended with 29% more active listings than last October, continuing a slowdown in inventory growth but still leaving buyers with more options than they had last year or the year before.
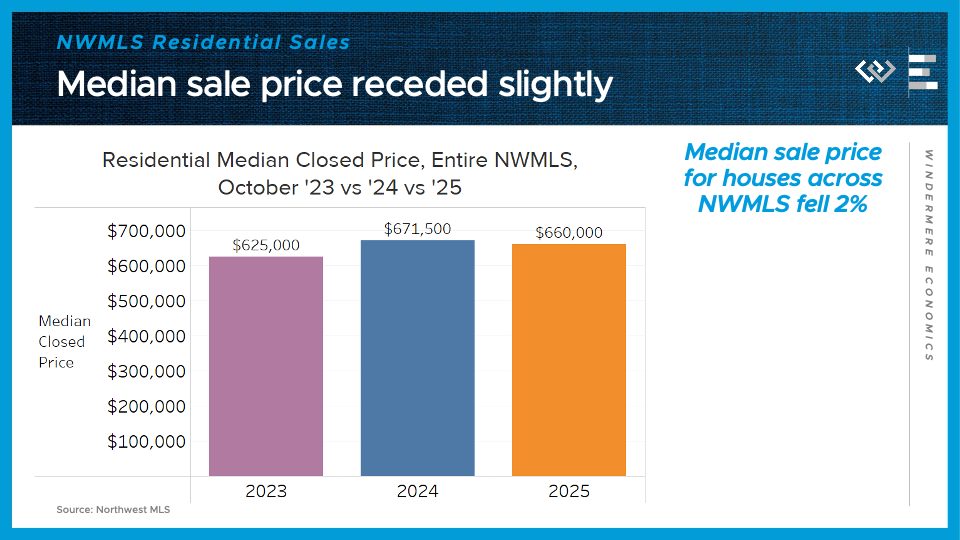
Those higher inventory levels are starting to put some downward pressure on prices, which dipped 2%, to a median of $660,000 for a residential home sale in October.
Now I’ll turn to a closer look at the four counties encompassing the greater Seattle area.
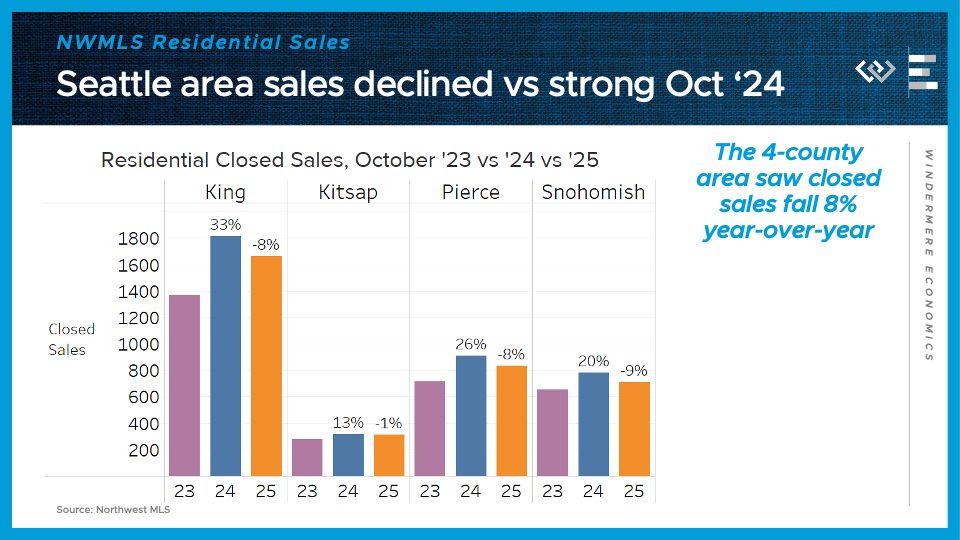
Closed sales stepped down by 8% from last October, although that month last year had unusually high sales, especially in King County, where 2024’s sales were a whopping 33% higher than in 2023.
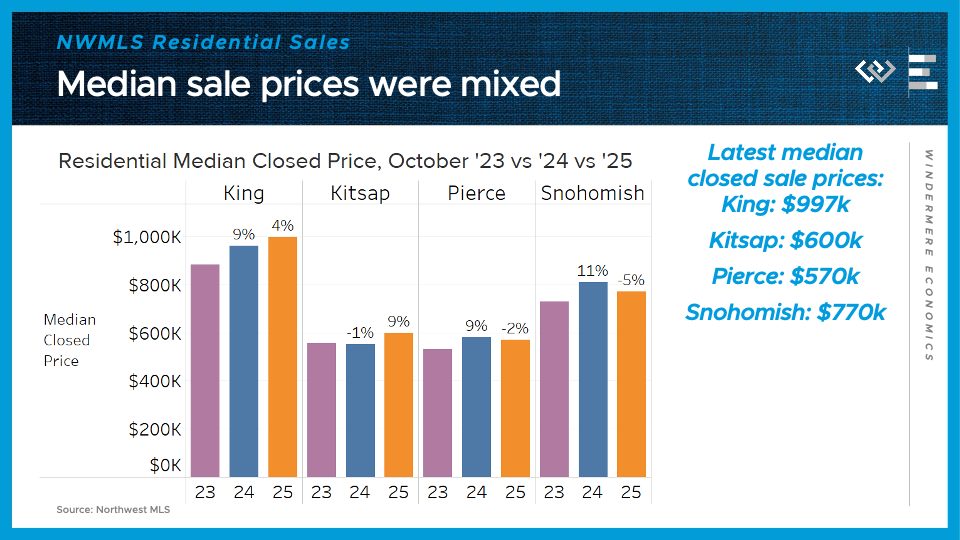
Median sale prices were split: 4% higher in King; 9% higher in Kitsap; but 2% lower in Pierce, and 5% lower in Snohomish County. That may represent a continued trend of demand retrenching toward the employment center of the region, around Seattle and Bellevue, as new return-to-office policies come into effect.
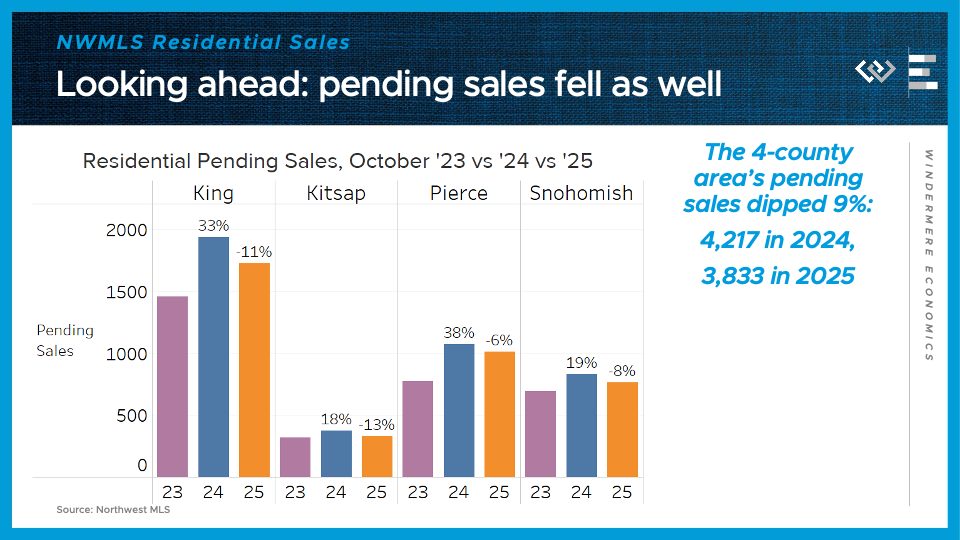
Looking ahead, pending sales fell 9% across the region, although again King County’s sales drop looks a bit like mean reversion after a standout 2024 number.
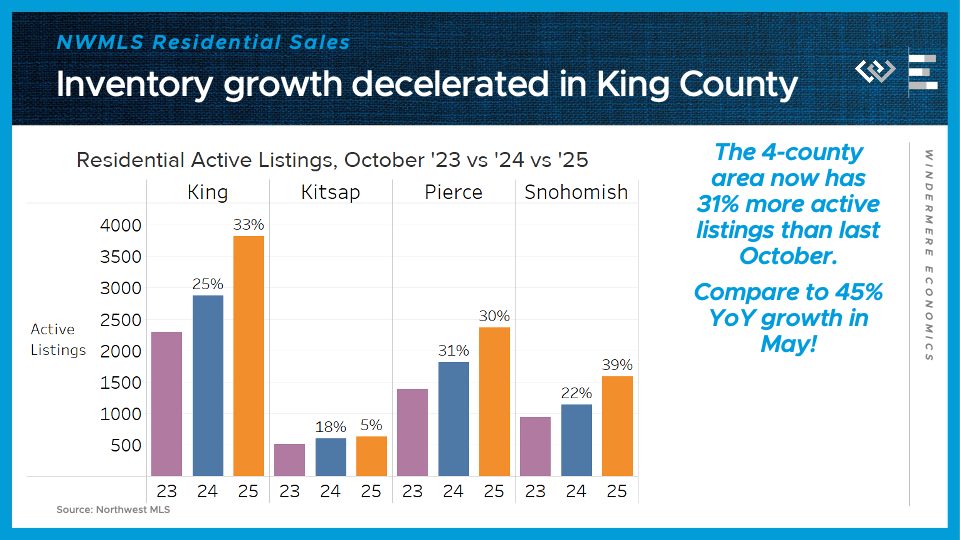
On the supply side, the 4-county greater Seattle area had 31% more active listings than at the end of October 2024. That continues the moderation of inventory growth we’ve seen since May, when this metric peaked at 45% year-over-year growth.
Looking ahead, we are entering one of the best times of the year for savvy buyers and their agents to find a bargain, and with much more inventory than even this time in the last two years. Whether they jump at the opportunity will be revealed in next month’s data!
Numbers to Know 10/22/25: The Latest on Jobs, Housing & Mortgage Rates

This is the latest in a series of videos with Windermere Principal Economist Jeff Tucker, where he delivers the key economic numbers to follow to keep you well-informed about what’s going on in the real estate market.
The government has shut down, and that means most government data publication has paused as well. The monthly CPI inflation report is delayed, and the monthly jobs report is suspended this month. So I’ll have to plan to revisit those when they resume, and in the meantime, I’ll start by checking in on the last publication out of the BLS before the shutdown: the Job Openings and Labor Turnover Survey, or JOLTS for short.
3.2%
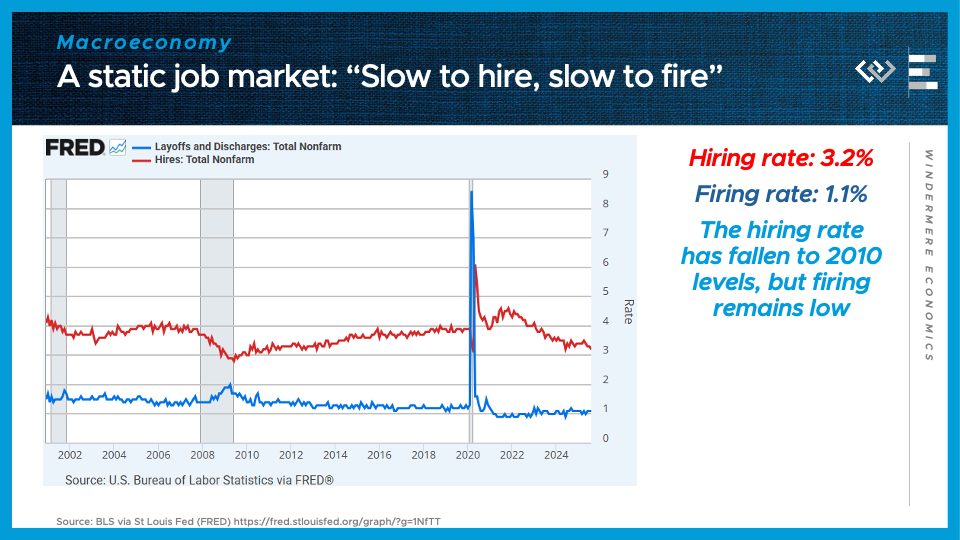
That was the hiring rate in August, meaning the share of the workforce that just got hired. It’s around the lowest hiring rate since 2010, when the economy was just beginning to dust itself off and climb out of the Great Recession. It’s one half of a simple summary of the economy that labor economists have been using for a couple years now: “Slow to hire, slow to fire.”
1.1%
That’s the rate of layoffs and discharges, or, broadly, the firing rate, to fit the rhyming scheme. It is not particularly high right now, even if it’s up slightly from the essentially record-low firing rate below 1% we saw briefly in 2022.
Putting it together, what “Slow to hire, slow to fire” means is that employers are essentially hunkering down, hanging on to their workers but not interested in growing those payrolls quickly. For people with jobs, this means the economy feels essentially OK – not great, but OK. But for those without a job, it’s proving unusually hard to break back into the workforce, which makes this a terrible time to be unemployed, and is gradually inflicting stress on the credit system and consumer spending. These are early signs of an economic slowdown, but not yet any indication of a recession.
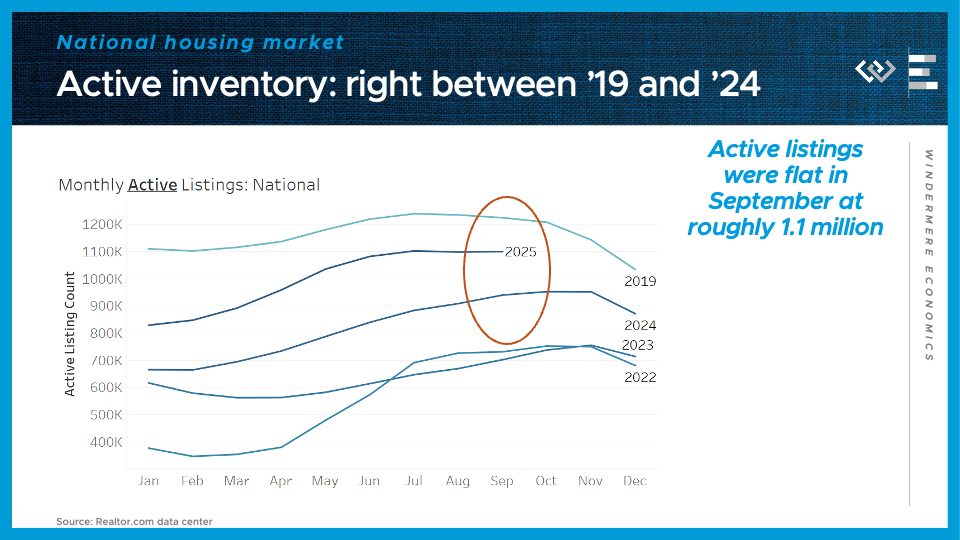
Turning to the housing market: we’ve got a familiar refrain this month. More inventory means buyers have gained more negotiating leverage, although September likely represented the high-water mark for the year, with about 1.1 million active listings for the 3rd month in a row. That’s 17% more than the same time last year.
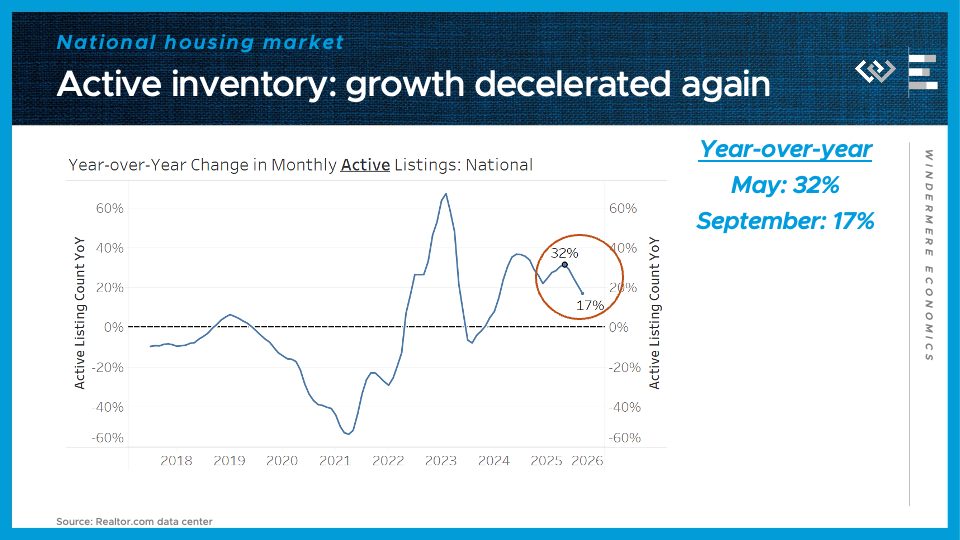
Importantly, inventory growth has passed an inflection point: for the fourth month in a row, the pace of growth of inventory has fallen yet again. Growth has now been roughly cut in half, from the 32% annual growth seen in May. That means inventory is not on a runaway growth track toward a glut that would push prices down. Rather, the market is re-equilibrating, as some sellers steer clear of a buyers’ market, or de-list after not getting a satisfactory offer. For buyers, it means conditions have moved in their favor but they shouldn’t count on that trend intensifying much further.
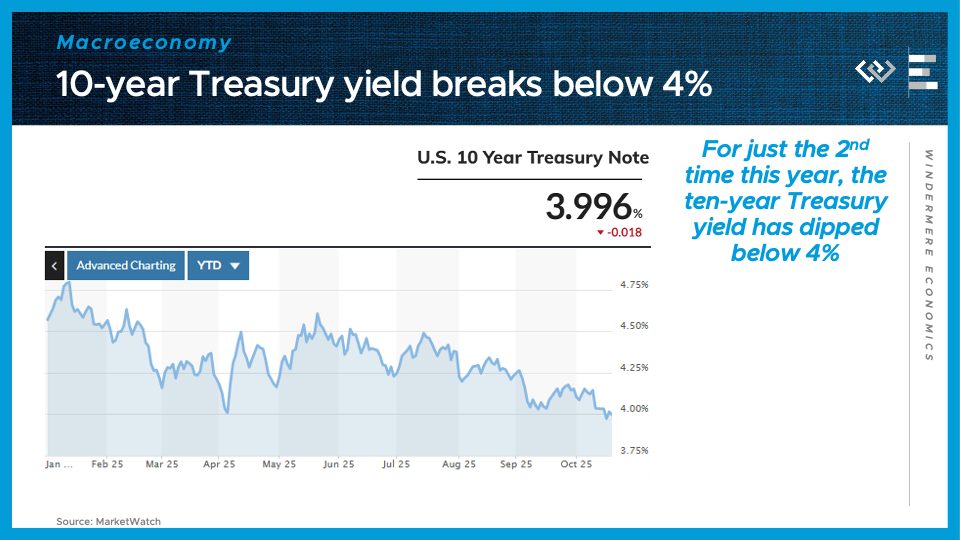
Another helpful factor for buyers, though, is that borrowing costs have continued to fall. The ten-year treasury yield, which is a major benchmark that mortgage rates tend to track, plus about 2 points, has now dipped below 4% for the first time this year. That reflects the combination of lower expected economic growth, and the resulting lower Fed Funds Rates expected over the next few years, as the Fed reacts to try to prevent a recession.
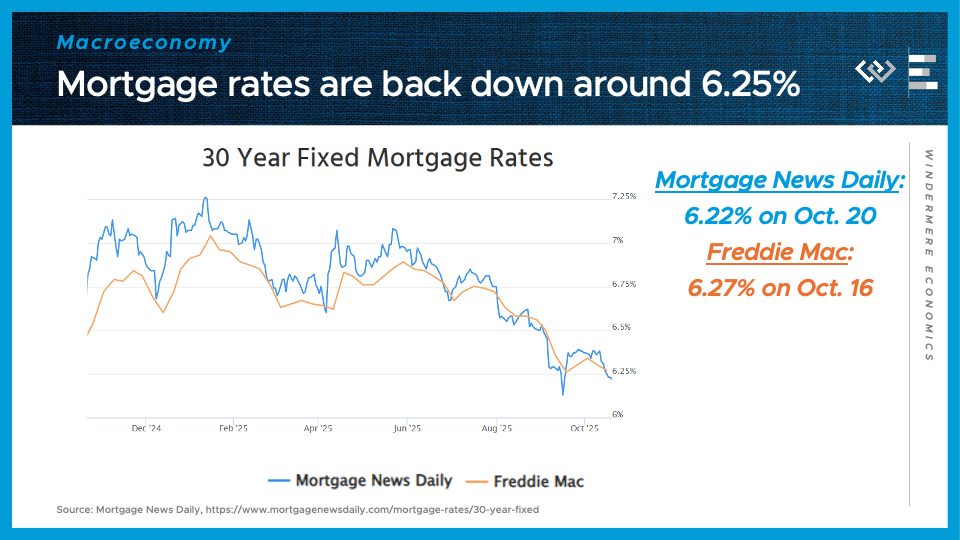
Hand in hand with those lower Treasury yields: Mortgage rates are moving back into their most favorable territory in 12 months, right around 6.25%. That represents significant savings compared to the rates of around 7% to start the year, and is partly driven by investor expectations of interest rate cuts to come. Because those expectations are already factored into the lower rates today, there’s no guarantee that mortgage rates will fall further even if and when the Fed continues cutting its overnight rate.
That is all for this month; I hope we’ll have more BLS data next month, and thanks as always for watching!
Numbers to Know 9/18/25: Why the Fed Cut Rates & What It Means for Housing

This is the latest in a series of videos with Windermere Principal Economist Jeff Tucker, where he delivers the key economic numbers to follow to keep you well-informed about what’s going on in the real estate market.
The Fed has finally started cutting. The two big questions are: Why? And now what?
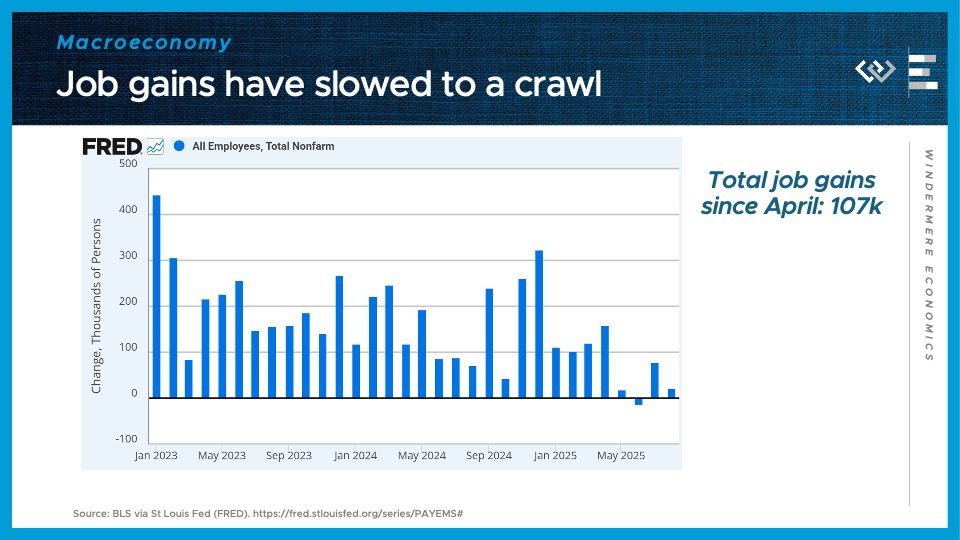
I’ll start with the why: the labor market has started showing signs of distress. The August jobs report delivered more bad news, continuing a streak of weak job growth since April.
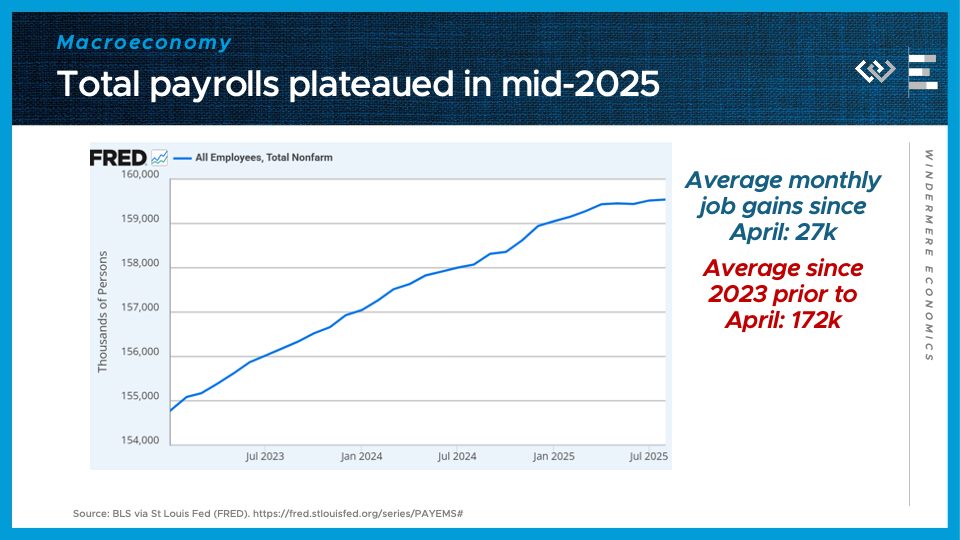
The overall growth of nonfarm payrolls – the number of employed workers in the country – clearly passed a turning point this spring, as growth as slowed to a crawl.
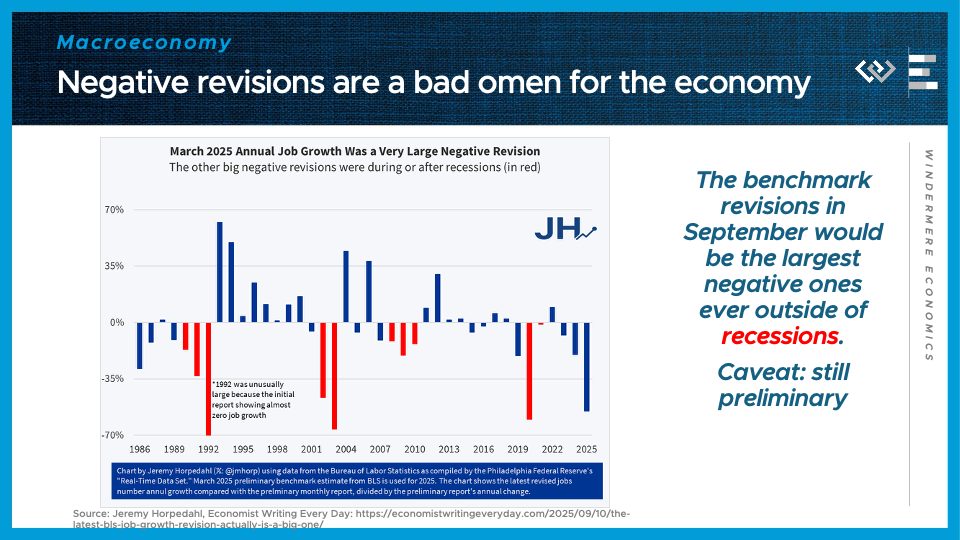
Moreover, the Quarterly Census of Employment and Wages just revised away more than HALF of the job growth previously estimated to have happened in the year ending March 2025, wiping out over 900,000 jobs originally thought to have been added in those 12 months.
Historically, as this chart by Jeremy Horpedahl highlights, big negative benchmark revisions, like the preliminary one released this month, have occurred during recessions. And big negative monthly revisions, like last month’s have been more common just before recessions.
That doesn’t mean a recession is around the corner, but it helps explain why the Fed is changing their posture to try to stop a recession before it gets going.
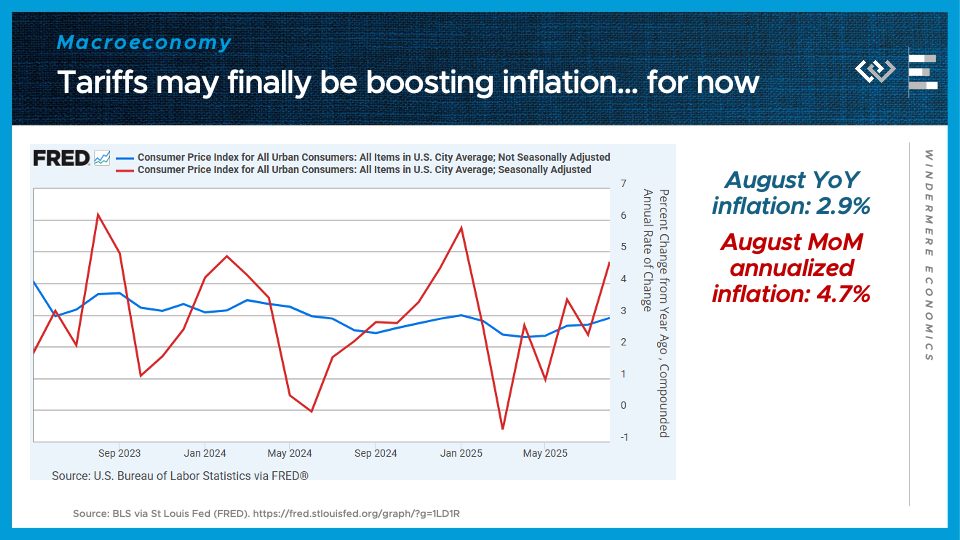
One challenge they’re facing, though, is that they have paused their fight against inflation before it was quite finished: annual inflation stopped falling this spring, and has now re-accelerated to nearly 3%; the more volatile monthly inflation rate is running at 4.7% annualized. Part of the reason the Fed is now willing to cut may be that they view some of this inflation as a transitory, one-time bump from tariffs, that they are willing to look through; but I think the biggest reason is just that the warning sirens in the labor market became too loud to ignore.
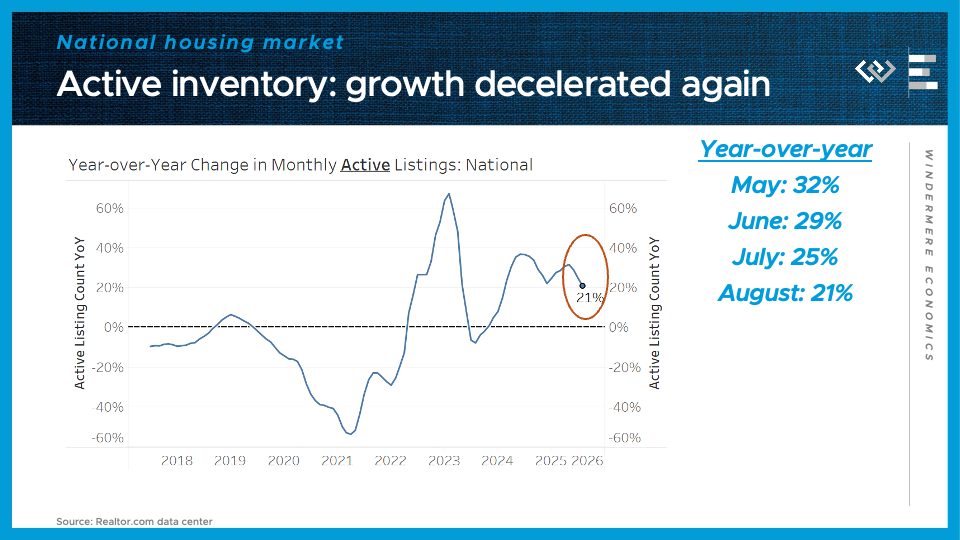
Turning to the housing market: the balance of power has swung in buyers’ favor this year, thanks to higher inventory, but it’s now clear that inventory growth passed an inflection point: for the third month in a row, the pace of growth of inventory has come down again. Now it’s down to just 21% growth from August of last year.
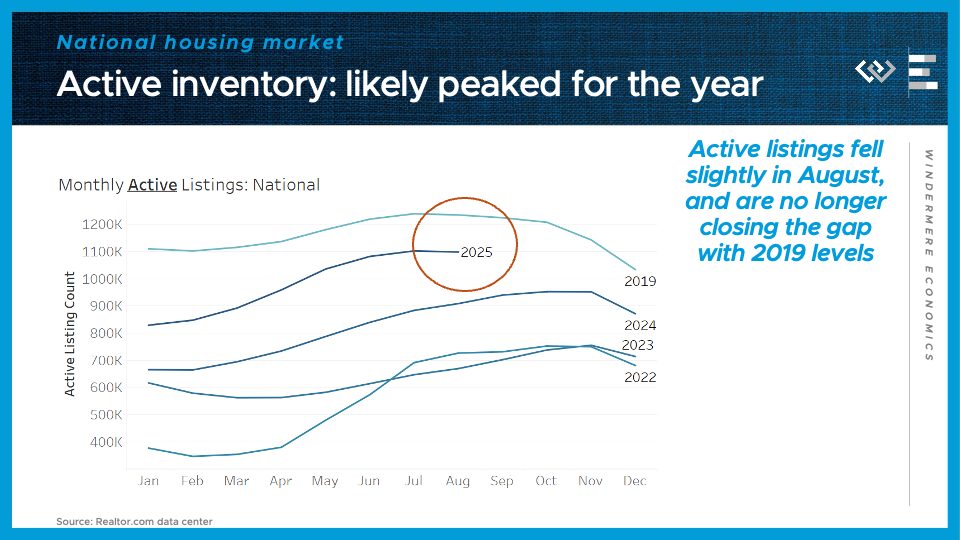
At the end of August, there were just under 1.1 million active listings on the market – down slightly from July, while each of the last 3 years saw inventory grow in August. This means buyers are still favored in many markets, but they can’t count on that pendulum to keep swinging further in their favor.
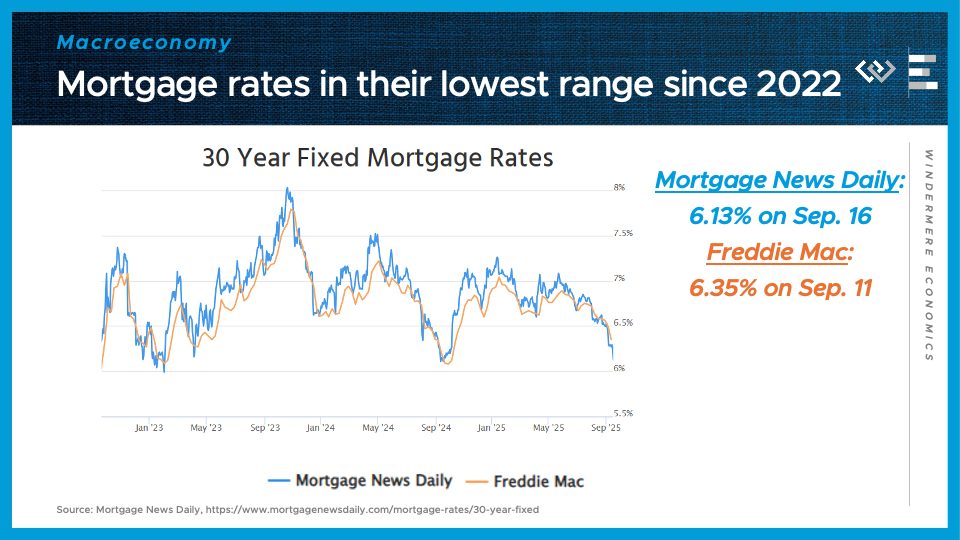
Especially because of the huge news for everyone in the housing market: mortgage rates have fallen to the neighborhood of 6 and an 8th percent, roughly their lowest level since 2022. Investors were anticipating this rate cut by the Fed, and if anything, the fact that the Fed was willing to press ahead with cutting rates, in spite of firmer inflation data, demonstrates their commitment to focus on helping the labor market with easier monetary policy, while setting aside inflation fighting to another day. Maybe more than anything, that change of posture by the Fed is helping to bring mortgage rates low enough that well-qualified borrowers are starting to see a 5-handle without paying any points. There’s no guarantee that the low rates will last – just look at what happened last October, so I’d advise everyone to strike while the iron’s hot. If rates do fall further this winter, well, you can always refi then.
Local Look Western Washington Housing Update 9/8/25
Hi. I’m Jeff Tucker, principal economist at Windermere Real Estate, and this is a Local Look at the August 2025 data from the Northwest MLS.
This summer, the local market has decisively swung in buyers’ favor, as home sellers around Washington have had to contend with both softening demand, and more abundant competing listings. That’s good news for home buyers, but we are seeing fewer of them than we saw last year.
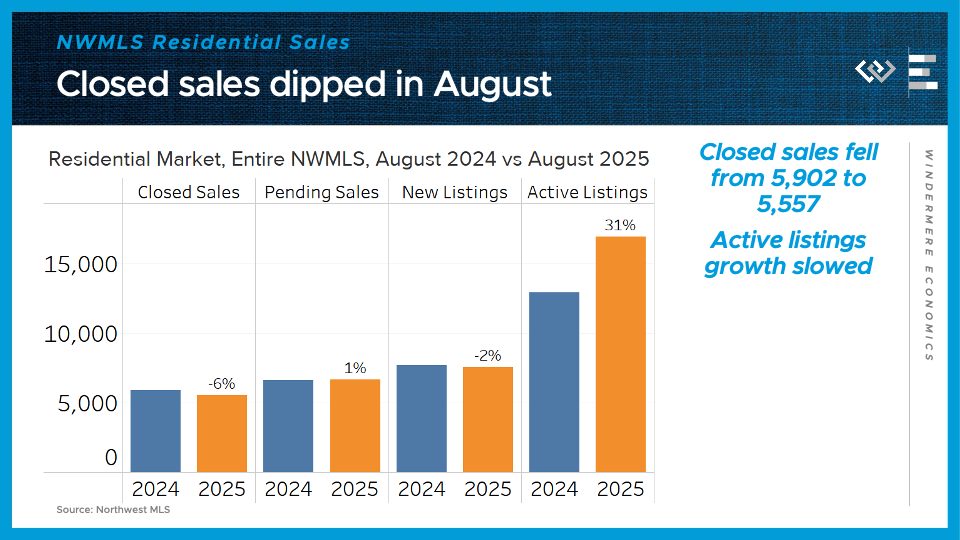
In August, closed sales of residential homes came in 6% below last year’s August total, across the Northwest MLS. Pending sales, which give some signal about next month’s sales, were roughly flat – up just 1% form last year.
On the supply side, we’ve passed an inflection point, where sellers are starting to back away from the market. There were 2% fewer new listings than last August – the first year-over-year decline in new listings since February. The month ended with 31% more active listings than last August, marking a slowdown from the inventory growth of about 36% the last two months. This pullback in supply should put a floor under any potential price decreases that the market shift could bring.
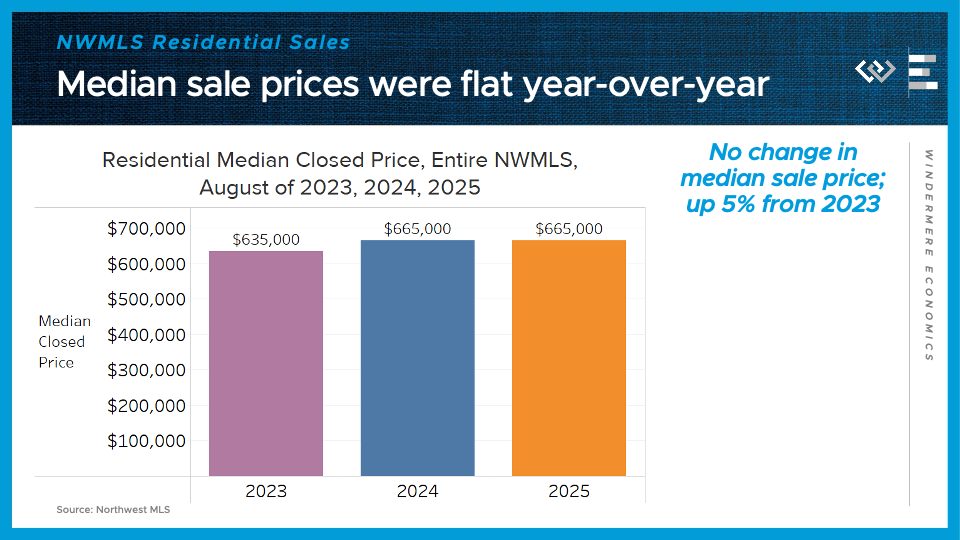
Speaking of which: the steadiest number across the Northwest MLS has been median sale price, which was exactly the same as last August: $665,000. That’s two months in a row of flat annual price changes, but it remains about 5% higher than in 2023.
Now I’ll take a closer look at the four counties encompassing the greater Seattle area.
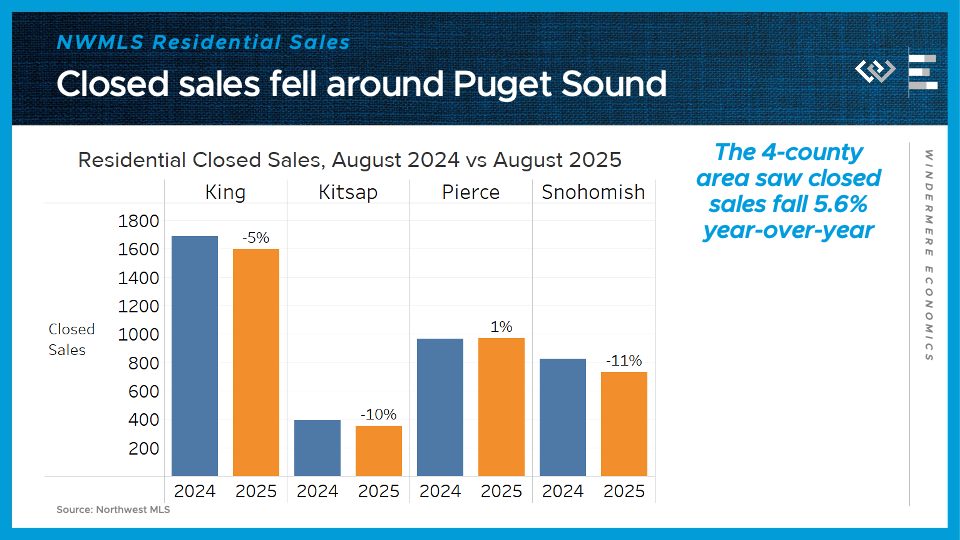
Closed sales dipped by almost 6% from last year. Only Pierce County saw a gain, albeit tiny, from last August.
Median sale prices actually crept upward from last year in all 4 counties: 4% higher in King; 7% higher in Kitsap, 1% higher in Pierce, and 1% higher in Snohomish County.

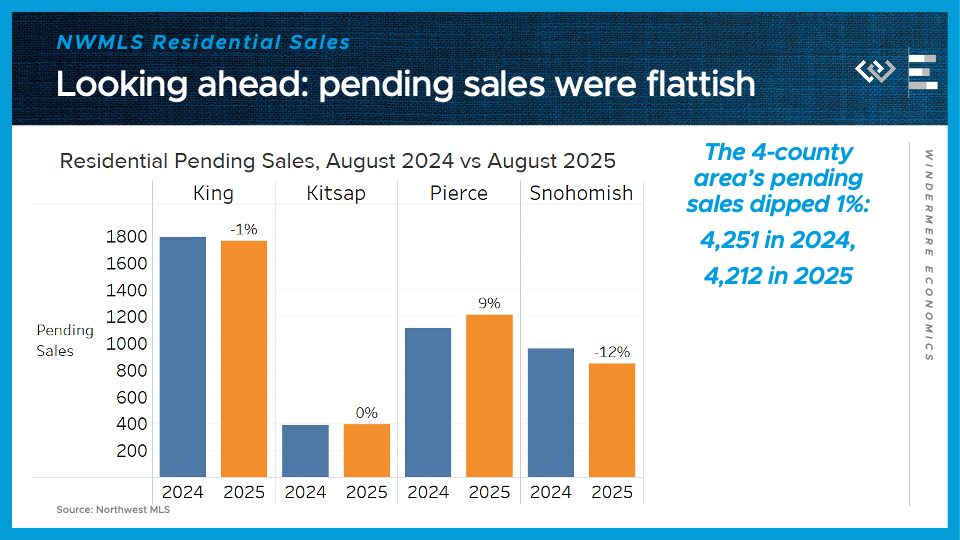
Looking ahead, pending sales dipped 1% across the region, although Pierce County was again the standout for sales, with 9% more pending sales than last year.
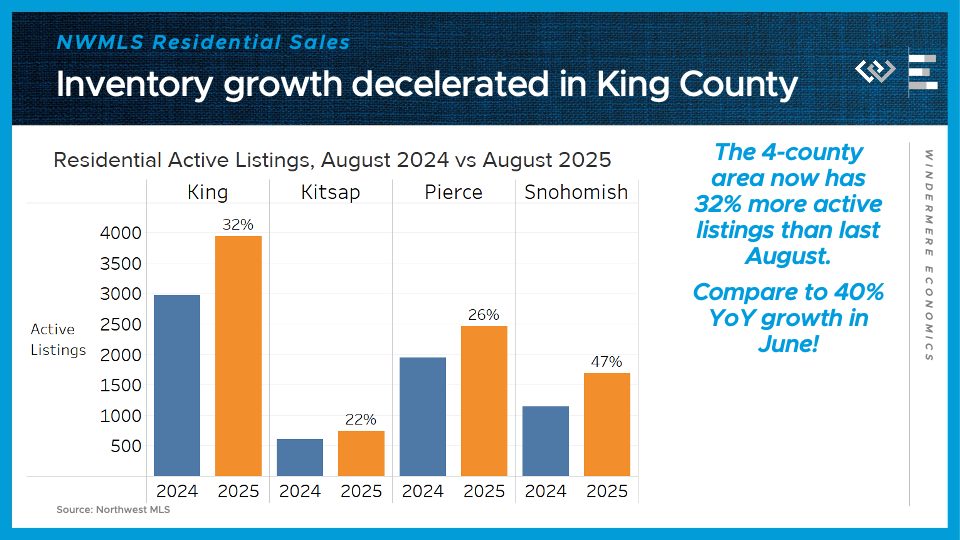
On the supply side, the 4-county greater Seattle area had 32% more active listings than at the end of August 2024. That continues the moderation of inventory growth we’ve seen since May, when this metric peaked at 45% year-over-year growth. King County especially has rebalanced, down from 50% growth to just 32% active listings growth.
Looking ahead, the key question is whether buyers begin to come off the sidelines in response to these more favorable conditions: they’ve got lots of inventory to choose from, listings that have lingered on the market, and mortgage rates that have dipped from about 7% to closer to 6.5% this summer. For people in a position to buy, this fall is looking like a sweet spot.
Numbers to Know 8/21/25: Inventory Up, Prices Down, and Rates Easing

This is the latest in a series of videos with Windermere Principal Economist Jeff Tucker, where he delivers the key economic numbers to follow to keep you well-informed about what’s going on in the real estate market.
I’ll start this month by checking in on our most important barometer of the housing market: inventory. Active listings continued to grow in July, but at least nationally, they are still below somewhat below pre-pandemic levels for this time of year.
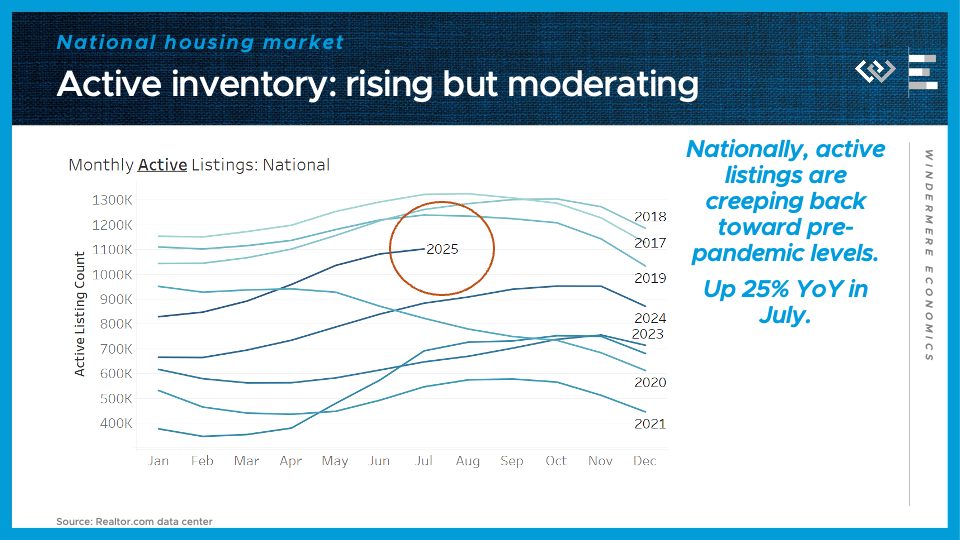
At the end of July, there were just over 1.1 million active listings on the market – below the 1.23 million on the market in July 2019, but up from 884,000 at this time last year.
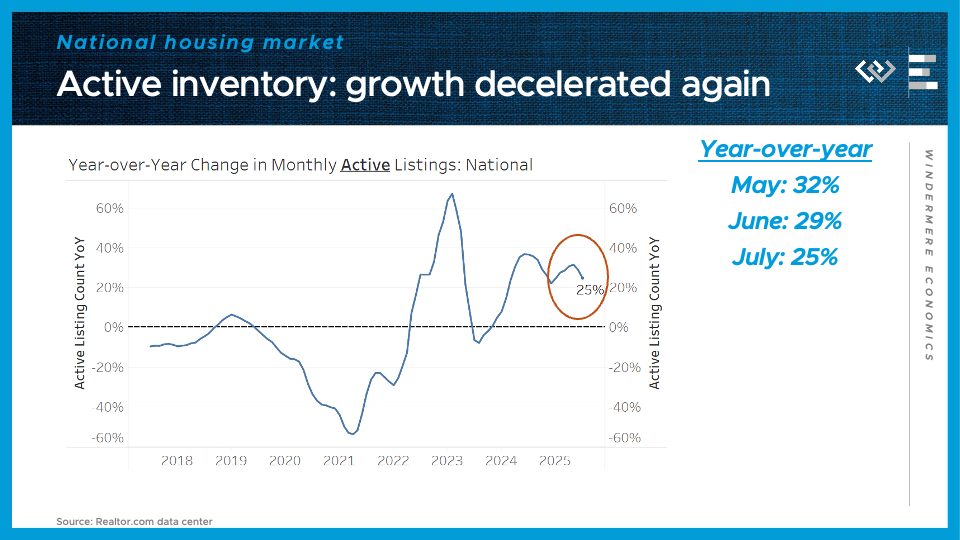
That makes for 25% year-over-year growth, which marks another month of deceleration from a peak of 32% annual growth in May. This continues to make this spring look like an inflection point, where inventory is still growing but at an ever-slower pace.
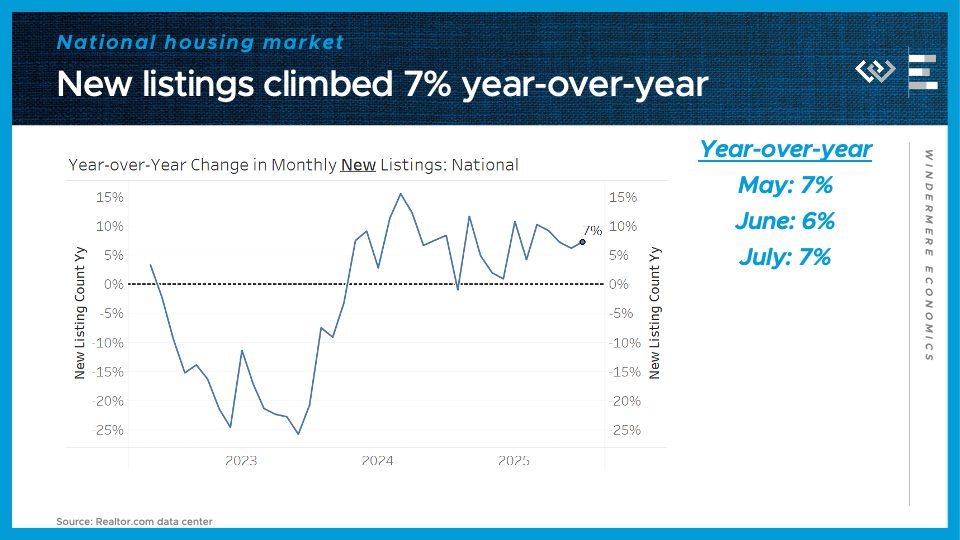
Maybe surprisingly, we didn’t see any deceleration in the flow of new listings in July – it was up 7% year-over-year, or slightly more than June’s 6%. So if inventory growth is slowing, like we just saw, it points to another rising trend this year: de-listings, or expired listings, where sellers are not getting an acceptable offer and just choosing to walk away.
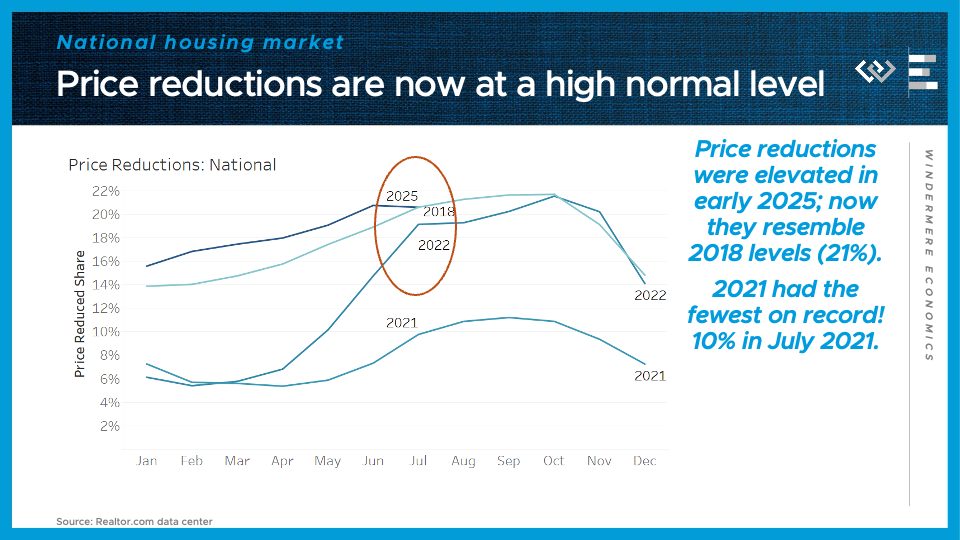
Another sign of sellers being unwilling to bend any further: price reductions. This is the share of active listings where the seller has reduced their asking price. It’s been elevated all year long, but it abruptly stopped rising in July, which is seasonally unusual — so now it’s actually at the exact same share we saw at this time in 2018, 21%, and not far from the share in July 2022.
All in all, the housing market has clearly swung in buyers’ favor, but these signs of an inflection point suggest the momentum in that direction is slowing down.
Turning to the macroeconomy, we have a couple of worrying signals of at least a mild form of macroeconomists’ least favorite condition: stagflation. Starting with the “flation” part, we see that inflation is stubbornly stuck closer to 3% than the Fed’s 2% target.
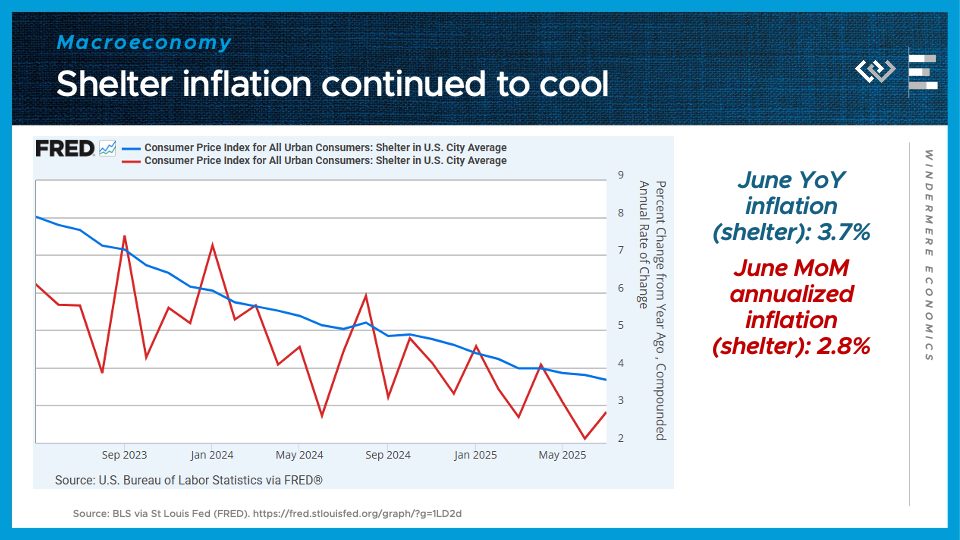
Shelter inflation has kept cooling in a kind of zigzag pattern, finally approaching 2%.
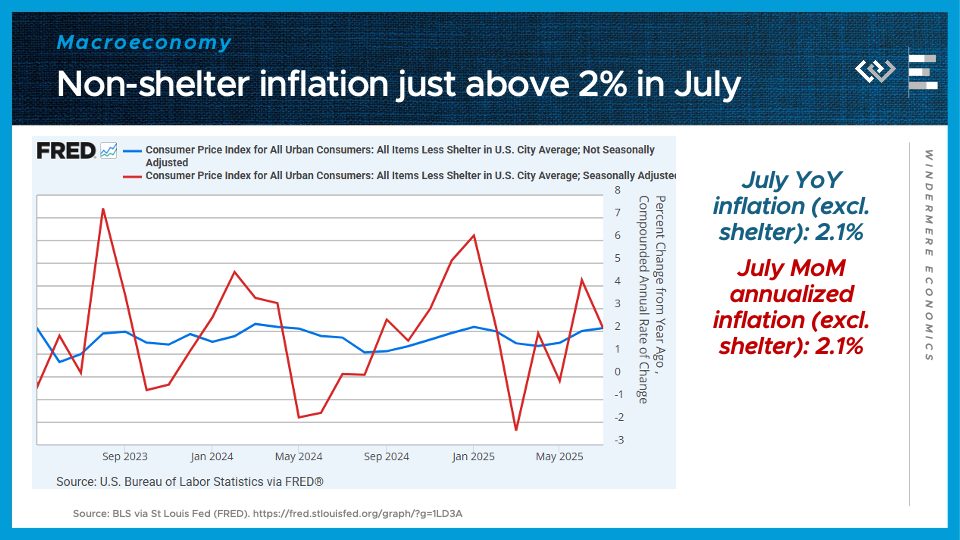
But the rest of the CPI basket, everything BUT shelter, is once again growing at – just barely – faster than 2% annualized.
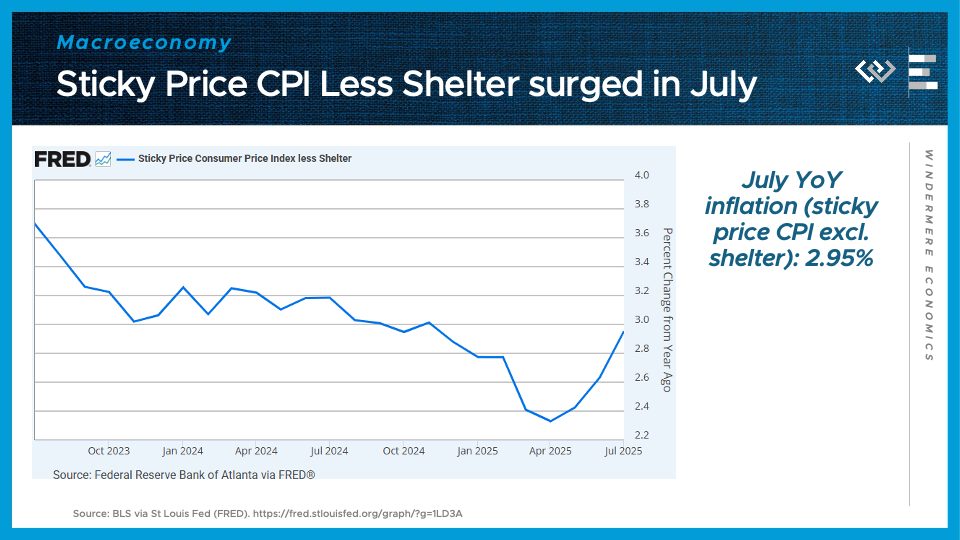
And an especially predictive part of the price index, called the sticky price index less shelter, accelerated sharply to almost 3% annual growth.
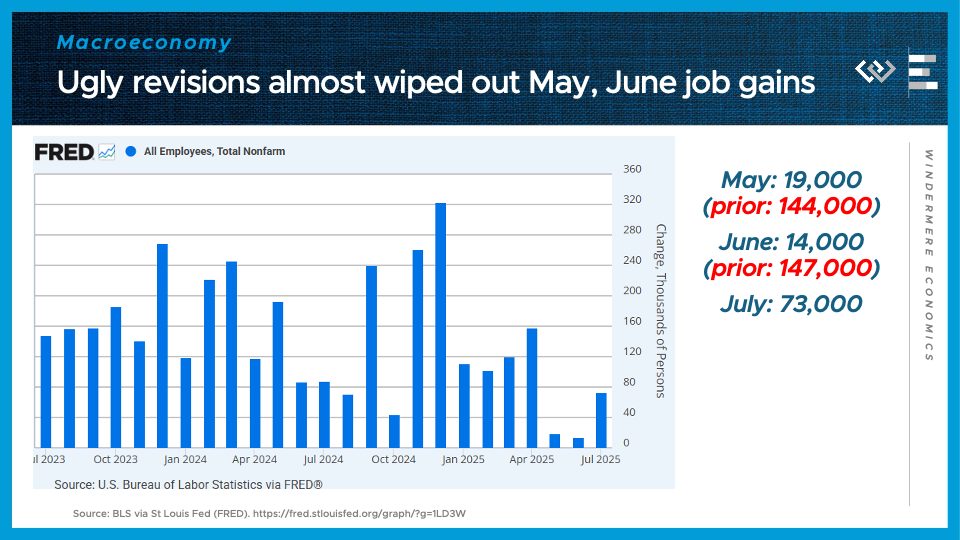
Turning to the stagnation side of things, the jobs report for July, released on August 1st, came in way below expectations. The most concerning part is that job gains for May and June were revised down radically, almost wiping out the healthy job gains the BLS reported just last month. Month-to-month revisions are a normal part of how the Bureau of Labor Statistics reports payroll gains and losses, and a pattern of sharply negative revisions often heralds the beginning of a recession.
Stagflation presents the Fed with a dilemma: the very weak jobs report would give them reason to cut interest rates, but resurgent inflation might give them pause. Markets are betting on at least one interest rate cut, starting in September, but after that it’s anybody’s guess where the data will guide their next decisions.
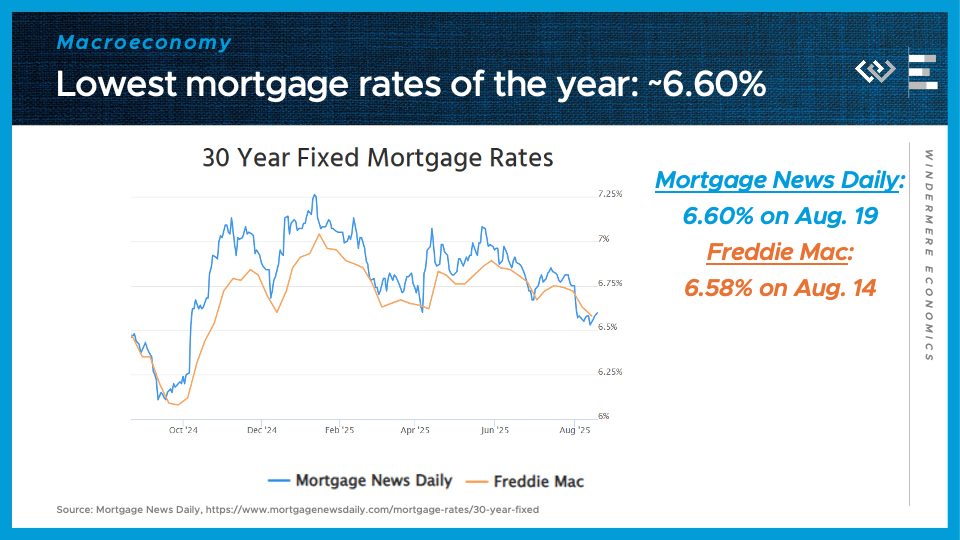
For the housing market, though, what’s most important is mortgage rates, and those have already fallen in the wake of the weak jobs report. Rates swooned, down to just over 6.5%, and while they’ve recovered slightly, this range of around 6.6% is still the best we’ve seen in 2025, so I’ll count that as progress. Buyers seem to be set up for another favorable early autumn housing market – more inventory, plenty of price reductions, and at least some mortgage rate relief.
Local Look Western Washington Housing Update 8/6/25
Hi. I’m Jeff Tucker, principal economist at Windermere Real Estate, and this is a Local Look at the July 2025 data from the Northwest MLS.
After a bit of a roller coaster in the second quarter following the April rollout of Trump’s tariffs, July just looked slow and steady, especially in sales: We saw 4% more closed residential sales across the Northwest MLS in July than last year, and 3% more pending sales.
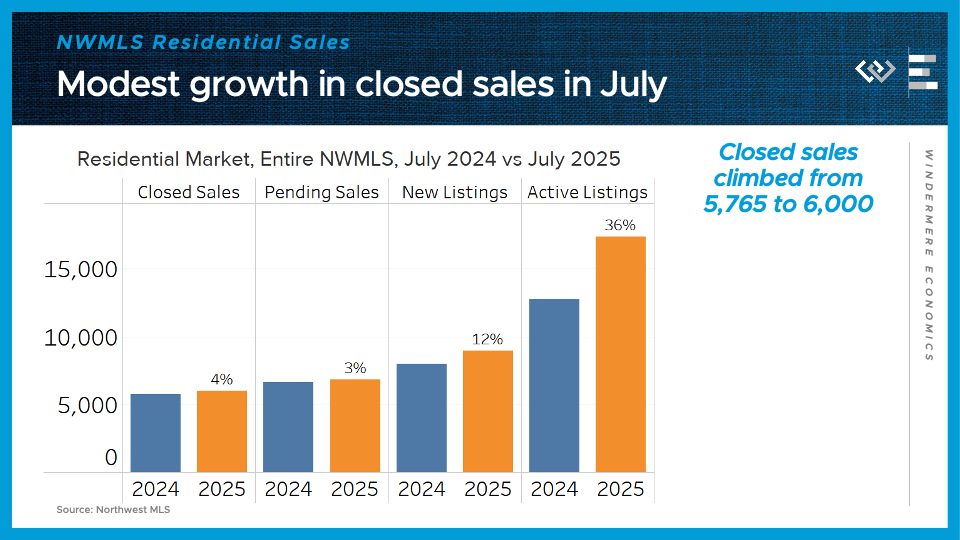
On the supply side, there were 12% more new listings than July of last year, and the month ended with 36% more active listings than last July. That’s almost identical to the pace of growth we saw in June.
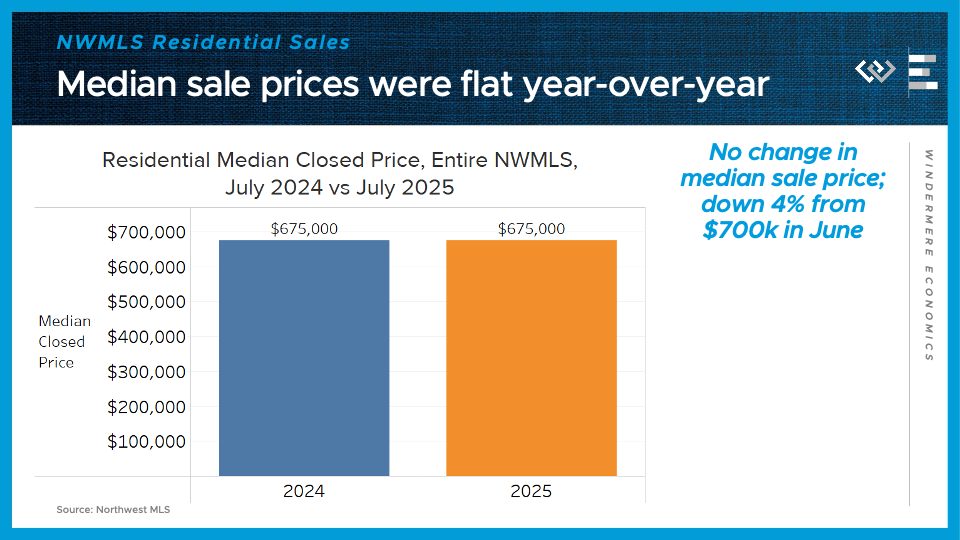
Finally: the most steady number across the Northwest MLS: median sale price, which was exactly the same as last July: $675,000. The growth of active listings has been weighing down price appreciation, and has now brought it down to 0.
This is yet more data showing a market where buyers are gaining negotiating leverage.
Now I’ll take a closer look at the four counties encompassing the greater Seattle area.
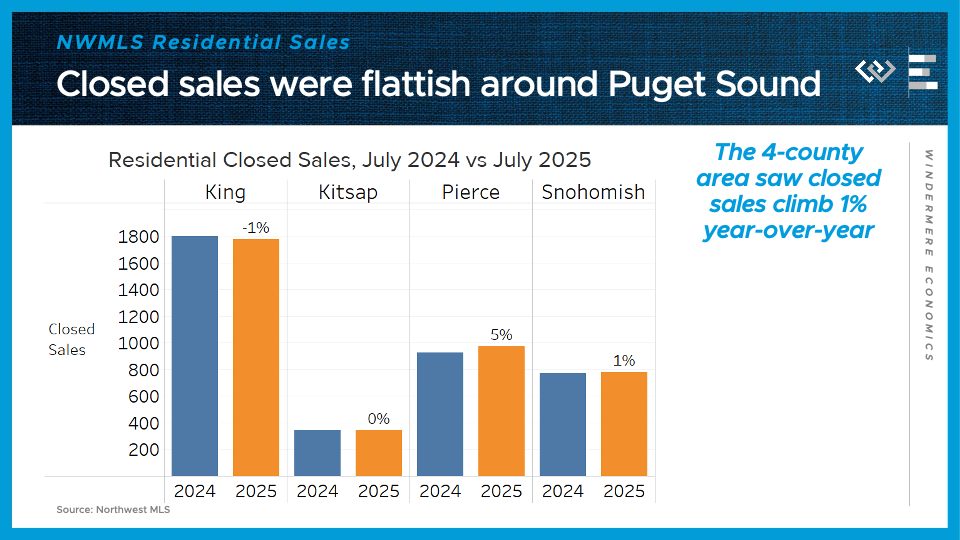
Closed sales climbed here by 1% from last year, led by growth in Pierce County, which offset a tiny decline in King County.
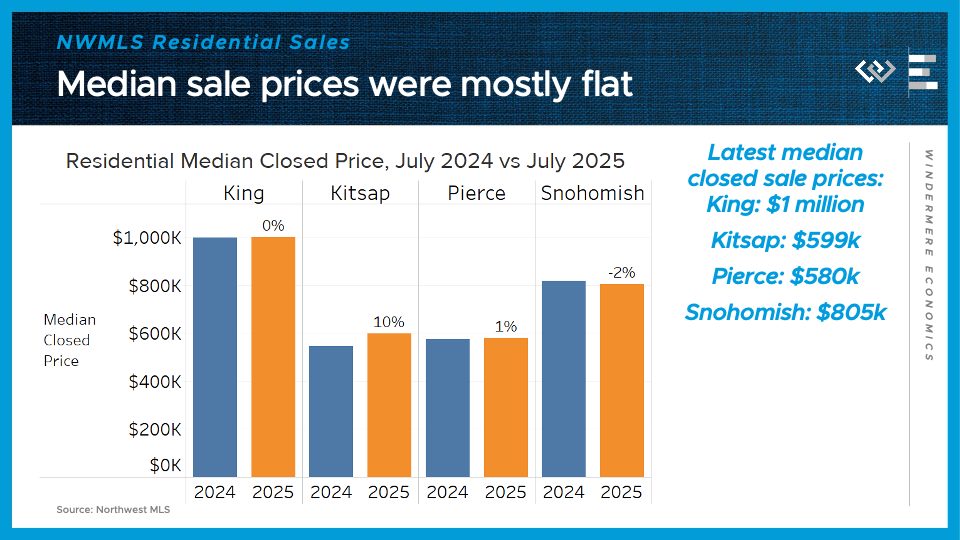
Median sale prices were exactly flat year-over-year here in King County at $1 million; up 10% in Kitsap to almost $600,000; up 1% in Pierece and down 2% in Snohomish County.
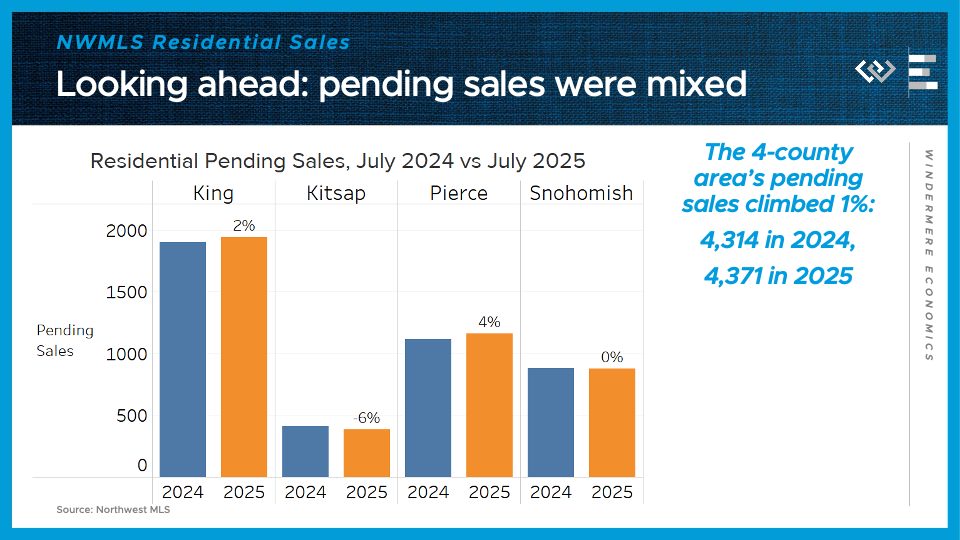
Looking ahead, pending sales climbed a modest 1% across the region, including a 2% gain in King County.
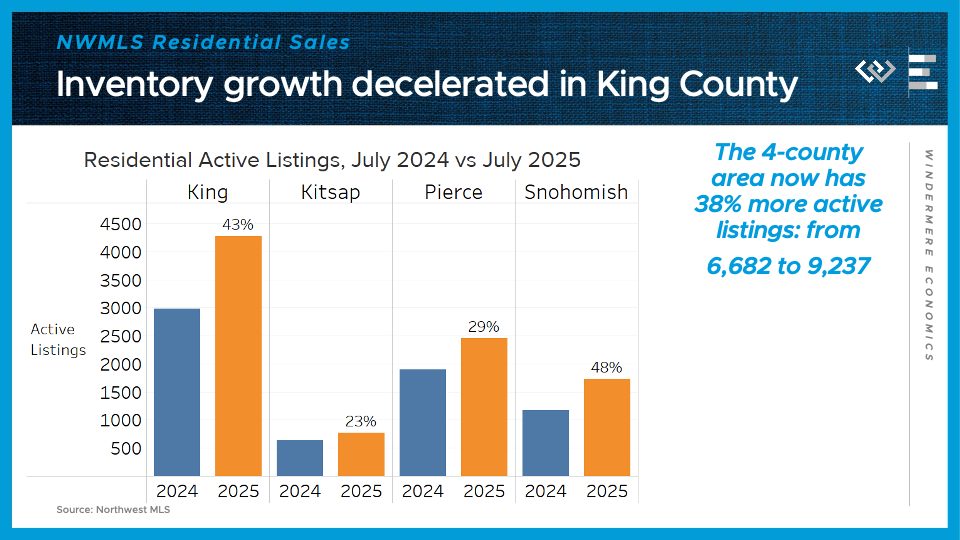
On the supply side, the 4-county greater Seattle area had over 9,000 active listings at the end of July, or 38% more than the same time last year. This is continuing the deceleration in inventory growth since we had 45% year-over-year gains in May; most of the deceleration is thanks to King County, where inventory was up 50% just a couple months ago.
All in all, this market looks like a return to a “new normal” where buyers have gained the upper hand, at least enough to grind price appreciation a halt, but not nearly enough to bring prices down as much as they’d like. Inventory is still up, but not accelerating toward a glut. And new listings are continuing to deliver a lot of new options for buyers here in the dog days of summer.
Numbers to Know 7/22/25: Inventory Slows, Inflation Rises: What It Means for Buyers and Sellers

This is the latest in a series of videos with Windermere Principal Economist Jeff Tucker, where he delivers the key economic numbers to follow to keep you well-informed about what’s going on in the real estate market.
This month I’ll take a closer look at inventory, which is our best barometer of whether the market is trending in sellers’ or buyers’ favor. Nationwide, inventory is still working its way back up toward pre-pandemic levels, but at a somewhat moderating pace.
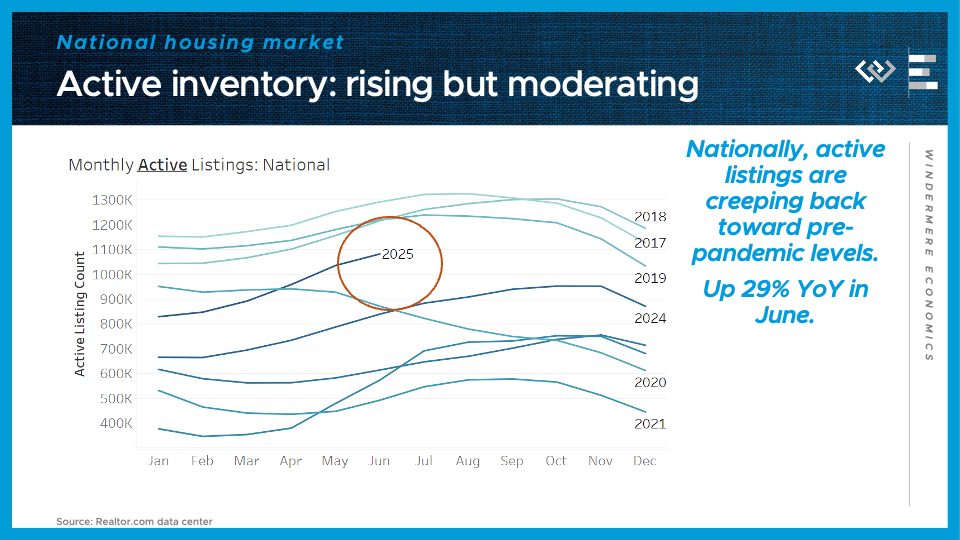
At the end of June, there were about 1 million, 83 thousand active listings on the market, or 29% more than last year. That IS substantial growth, but it’s a step down from the 32% year-over-year gain we saw in May – which marks the first deceleration in this metric since December 2024. This could be a blip, or it could be an inflection point where we see the inventory growth start to slow back down.
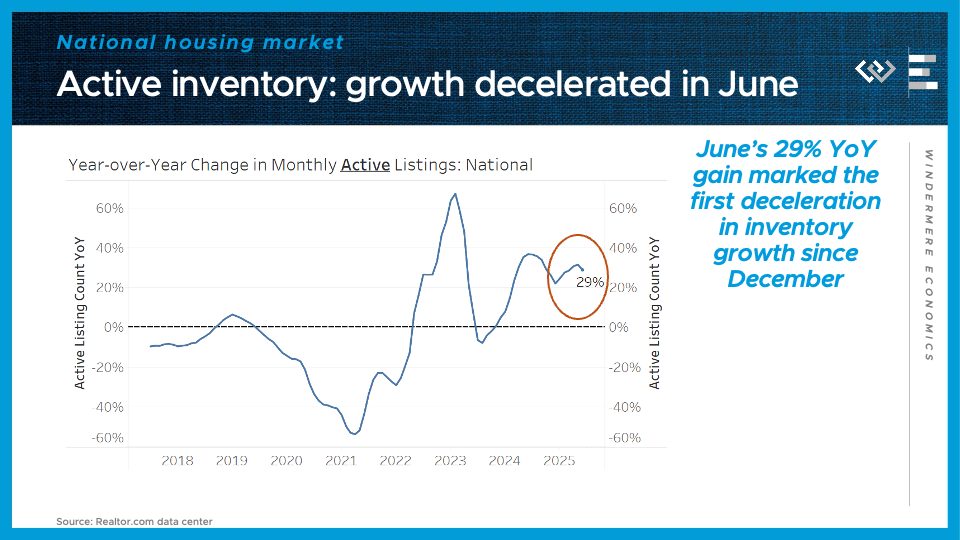
That inventory growth has been swinging the pendulum of negotiating power in buyers’ favor, putting downward pressure on sale prices. Now if inventory growth stalls out, that could help to prevent prices from dropping much below year-ago levels.
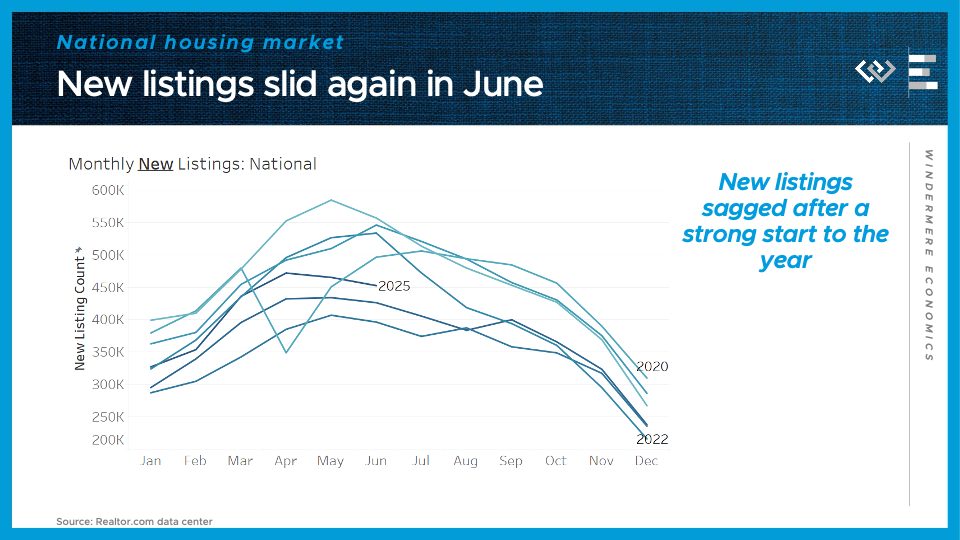
The reason WHY inventory growth has begun to slow seems to lie with sellers: they came roaring in to 2025 with a healthy rebound of new listings, but they’ve dropped off over the course of Q2.
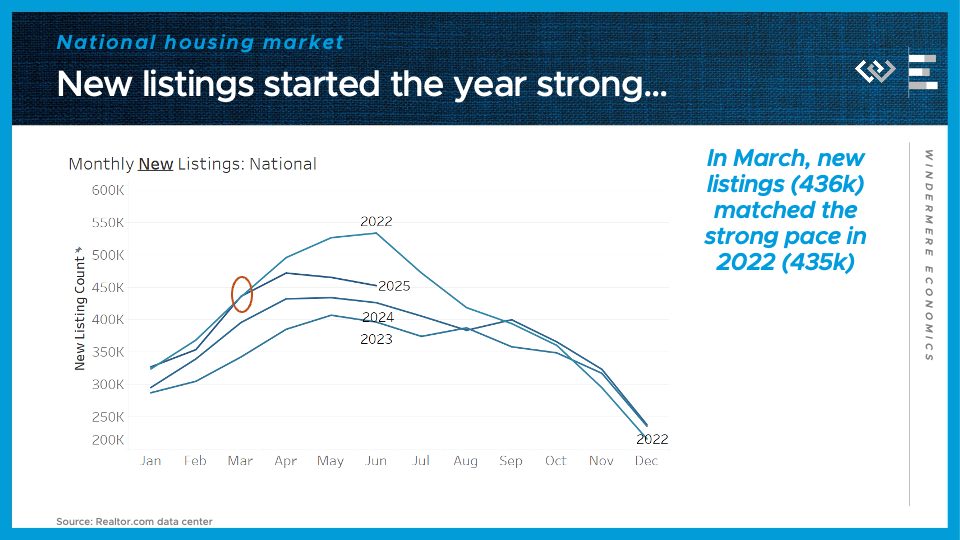
If we just keep the last few years on this chart of new listings, we can see the year started as strong as 2022… but now owners have pulled back from listing as much. It’s not a total sellers’ strike, but in June there were 15% fewer new listings than in June 2022, or only about 6% more than this time last year.
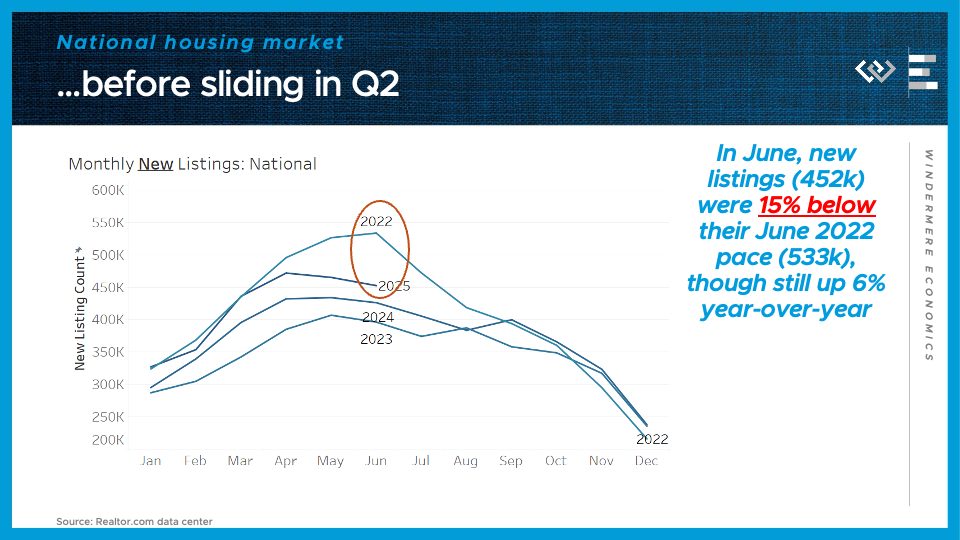
If this trend continues – sellers backing away from the market – it could insulate prices from declining, but at the cost of fewer transactions in the second half of the year.
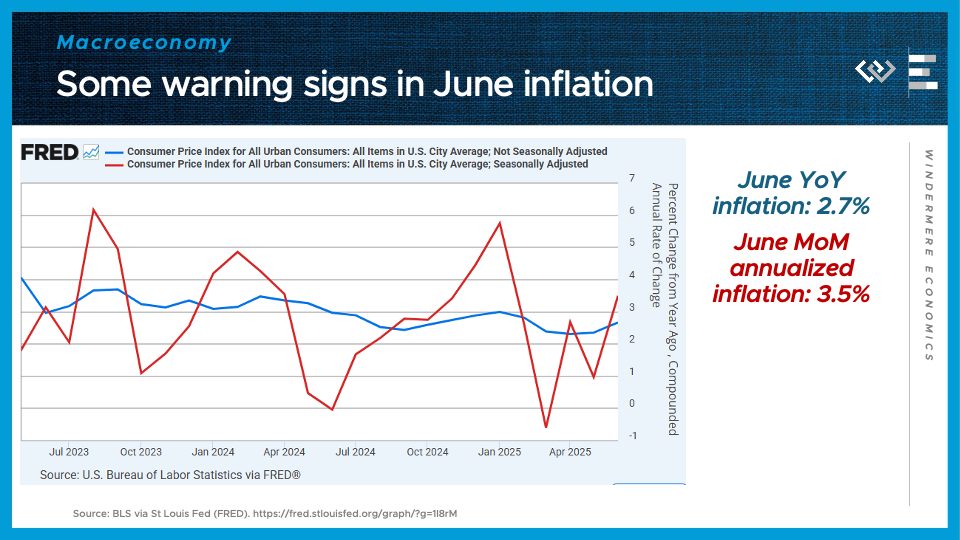
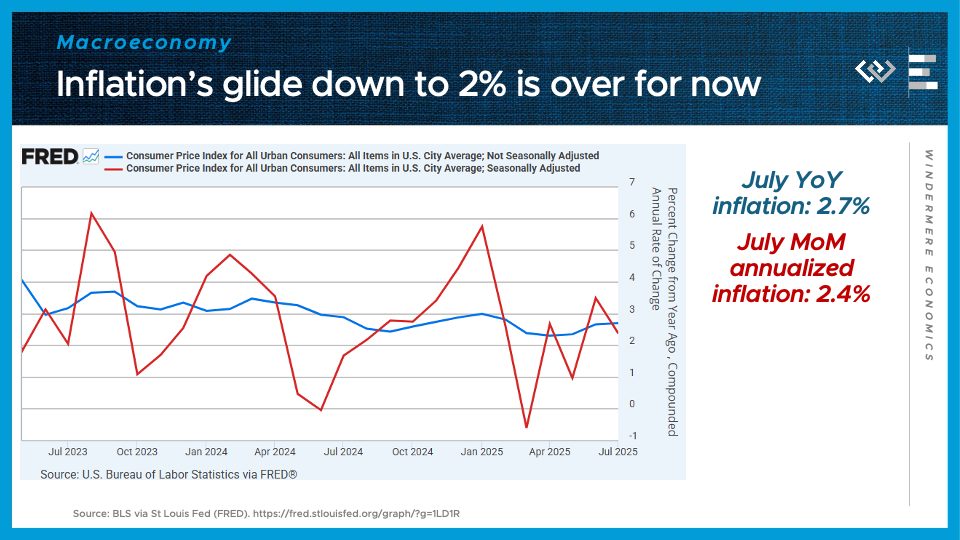
Turning to the macroeconomy, the CPI report for inflation in June started to raise some yellow flags. The annualized monthly growth rate of prices jumped to 3.5%, and the year-over-year change in CPI from last June was only 2.7%.
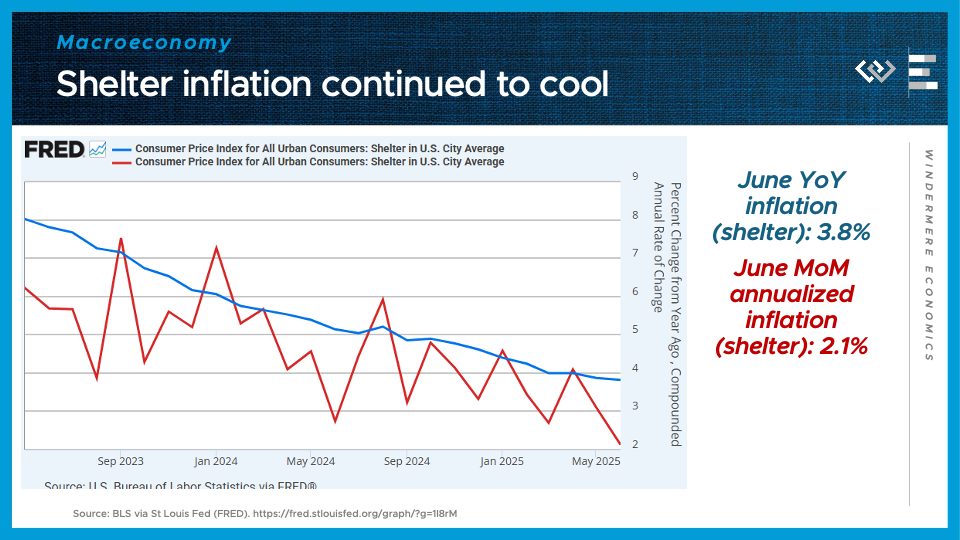
Now, shelter inflation HAS been a major contributor to elevated inflation for the last few years, but it has been decelerating, and that continued in June: in fact, shelter inflation ticked down to its lowest monthly pace in years, at just 2.1% annualized.
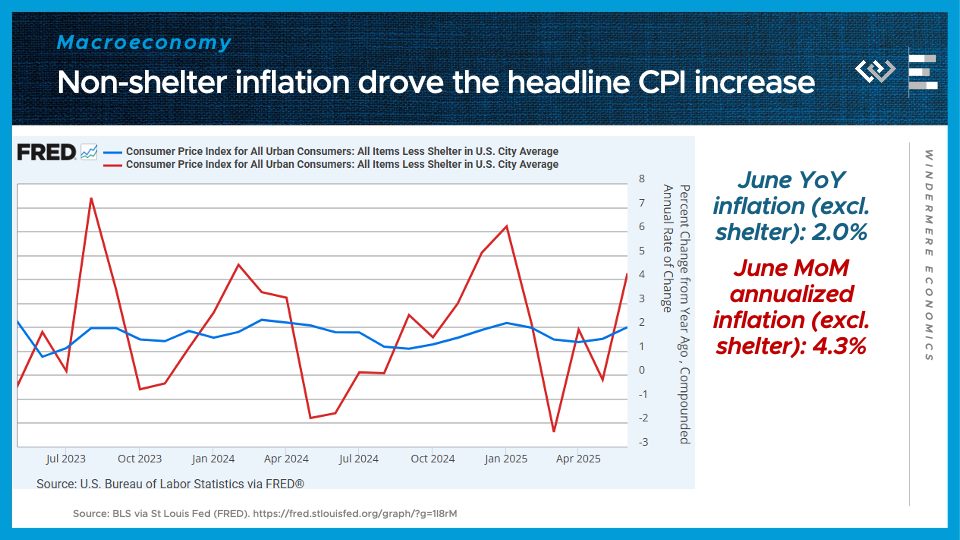
The rest of the CPI basket, excluding shelter, is what drove inflation higher: back up to just over 2% for the first time in months. The rise in non-shelter inflation, especially inflation for other services, could lead the Fed to keep their rate cut plans on hold.
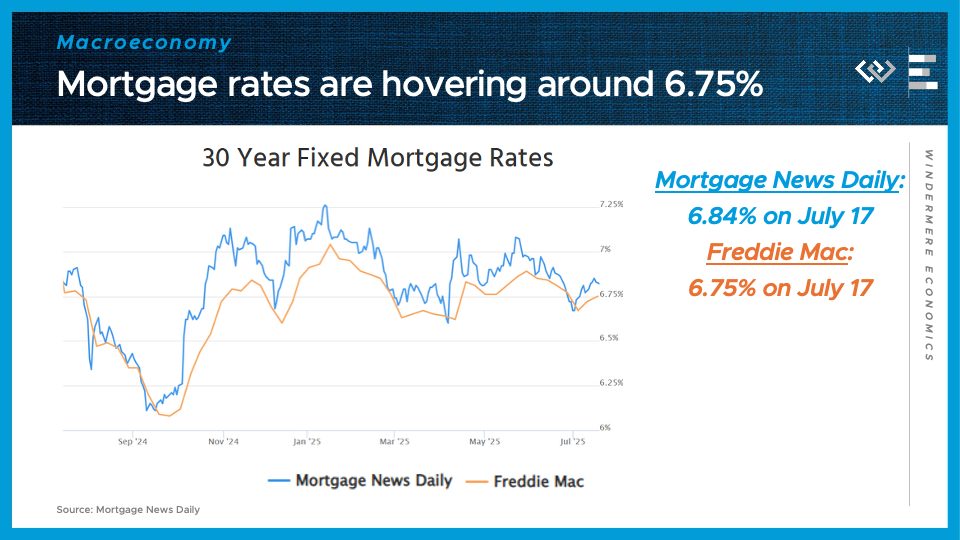
Speaking of interest rates, it still feels like Groundhog Day, with 30-year mortgage rates bouncing around 6 and three-quarters percent. There was a modest decline late in June, but that was erased by mid-July. Between strong economic growth, rebounding inflation, and higher debt issuance by the Treasury, I just don’t see much reason to expect mortgage rates to fall dramatically, until some of those factors change. This is still a higher-for-longer world when it comes to long-term interest rates.
")


