
 Facebook
 X
X
 Pinterest
 Copy Link

The following analysis of the Big Island real estate market is provided by Windermere Real Estate Chief Economist Matthew Gardner. We hope that this information may assist you with making better-informed real estate decisions. For further information about the housing market in your area, please don’t hesitate to contact your Windermere Real Estate agent.
Regional Economic Overview
The recovery in jobs on the Big Island has been, shall we say, frenetic. After the return of 7,000 jobs in the final quarter of 2020 and 1,000 jobs in the first quarter of 2021, total employment dropped by 650 jobs in the second quarter. The Island’s economy remains fragile. As of early July, travel restrictions have been relaxed for some fully vaccinated travelers. Hopefully this will bring more visitors, which will certainly help the labor market. As of the end of the second quarter, Hawaii County has recovered 12,100 of the 21,850 jobs lost due to COVID-19. There is a long way to go, and the pace of improvement may face additional headwinds with the rise of the Delta and Lambda variants of COVID-19. Only time will tell. Even with the slow return of jobs, the county’s unemployment rate in June was 7.9%, down from 8.5% in March and well below the 13.8% level of a year ago. The state unemployment rate was 7.7% in June, down from 9.1% in March.
big island of hawaii Home Sales
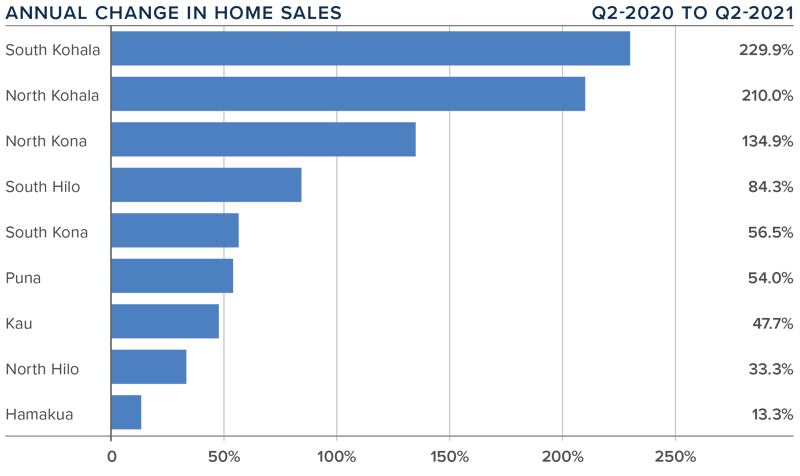
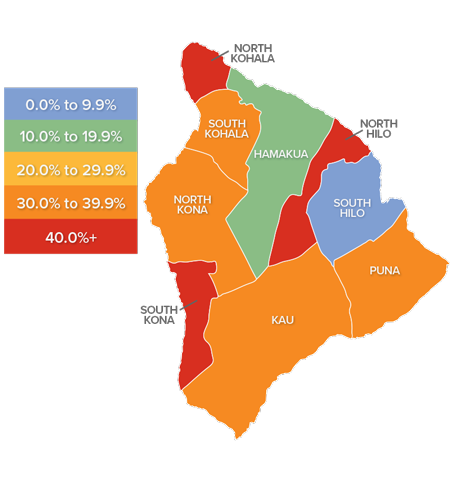
❱ In the second quarter, 1,189 homes were sold on the Big Island, more than doubling the number of sales that occurred a year ago, and 7.1% higher than in the first quarter of the year.
❱ Sales were higher across the board compared to a year ago, with the number of transactions more than doubling in three markets. Compared to the first quarter of 2021, sales rose in all areas other than Puna, North Kohala, and South Kona, but the drop in sales in these markets was minimal.
❱ The growth in sales came even though inventory levels were 32% lower than in the first quarter, suggesting that homes are selling very quickly.
❱ Pending home sales fell 7.7% compared to the first quarter of the year. This is likely a function of low supply levels and may lead total sales to drop modestly in the third quarter.
big island of hawaii Home Prices
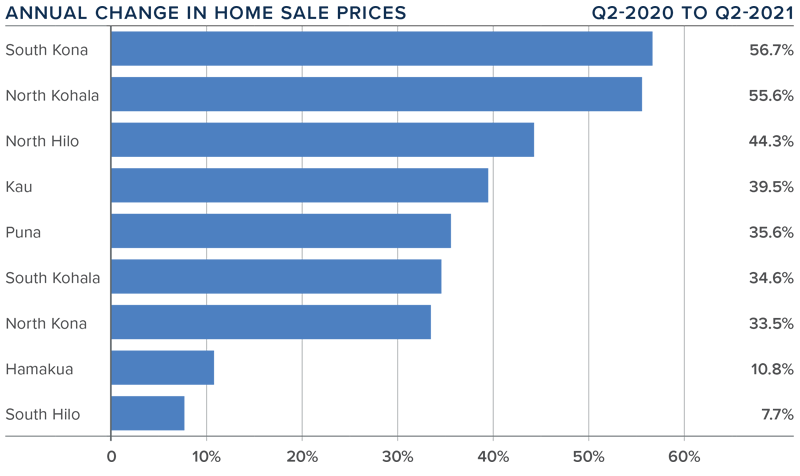
❱ The average home price on the Big Island rose by a very impressive 54.4% year over year to $884,759, but prices only managed to increase by a modest .7% from the first quarter.
❱ Home prices were up in five markets compared to the first quarter, but were lower in North and South Hilo, Hamakua, and North Kona.
❱ Year-over-year, prices rose by double-digits in all but one market, with significant growth in South Kona, North Kohala, and North Hilo.
❱ I would say that the housing market is performing as well as can be expected given current circumstances. The Big Island remains supply starved, but despite this, price growth appears to be strained.
Days on Market
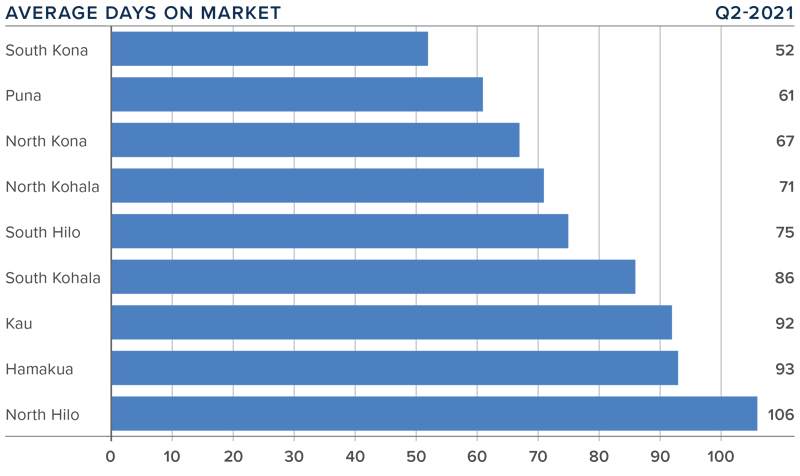
❱ The average time it took to sell a home on the Big Island dropped 14 days compared to the second quarter of 2020.
❱ The amount of time it took to sell a home dropped in all but two markets, with North Kohala remaining unchanged and Hamakua rising by 27 days.
❱ In the second quarter, it took an average of 78 days to sell a home, with the fastest sales occurring in South Kona and slowest in North Hilo.
❱ Due to the drop in available inventory, it took 58 fewer days to sell a home in the second quarter of 2021 than in the first.
Conclusions

This speedometer reflects the state of the region’s real estate market using housing inventory, price gains, home sales, interest rates, and larger economic factors.
Without a doubt, supply levels are not meeting the very strong demand. The modest uptick in mortgage rates in the first quarter was not maintained and rates have lowered again, which undoubtedly has influenced rising demand.
Even with the economic recovery stalling—and COVID-19 cases spiking again—the housing market is still on solid footing. I would be very surprised to see a significant uptick in the number of homes for sale in the coming months, which will clearly favor home sellers. Given these factors, I am moving the needle more in their favor.
About Matthew Gardner

As Chief Economist for Windermere Real Estate, Matthew Gardner is responsible for analyzing and interpreting economic data and its impact on the real estate market on both a local and national level. Matthew has over 30 years of professional experience both in the U.S. and U.K.
In addition to his day-to-day responsibilities, Matthew sits on the Washington State Governors Council of Economic Advisors; chairs the Board of Trustees at the Washington Center for Real Estate Research at the University of Washington; and is an Advisory Board Member at the Runstad Center for Real Estate Studies at the University of Washington where he also lectures in real estate economics.
")


