
 Facebook
 X
X
 Pinterest
 Copy Link

The following analysis of the Eastern Washington real estate market is provided by Windermere Real Estate Chief Economist Matthew Gardner. We hope that this information may assist you with making better-informed real estate decisions. For further information about the housing market in your area, please don’t hesitate to contact your Windermere Real Estate agent.
Regional Economic Overview
The Eastern Washington job market continues to recover following the loss of more than 47,000 jobs due to the pandemic. The latest numbers show that all but 6,300 of the jobs lost have returned, with solid numbers after the state reopened fully. It was interesting to note that the Benton/Franklin market has now recovered all of the jobs that were lost due to COVID-19, and Walla Walla and Lincoln counties have reached almost a full recovery. Spokane County is still down 3,500 jobs from its pre-pandemic peak, which is expected given its size. That said, I would not be surprised to see a full recovery there by the end of the summer, if not sooner. With jobs returning, the unemployment rate continues to decline. The latest data shows the region’s unemployment rate is down to 5.1% from 11.4% a year ago.
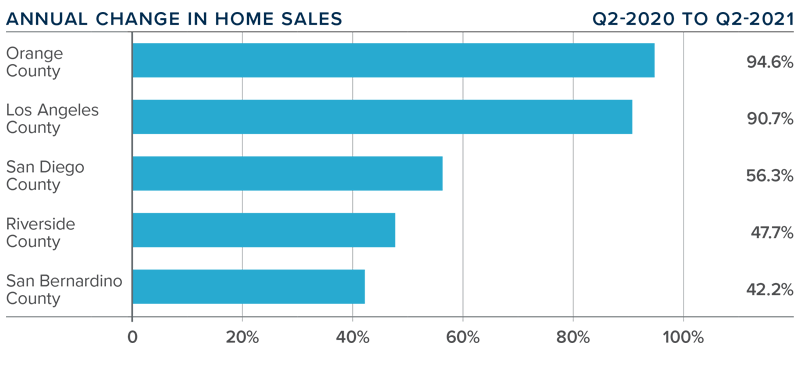
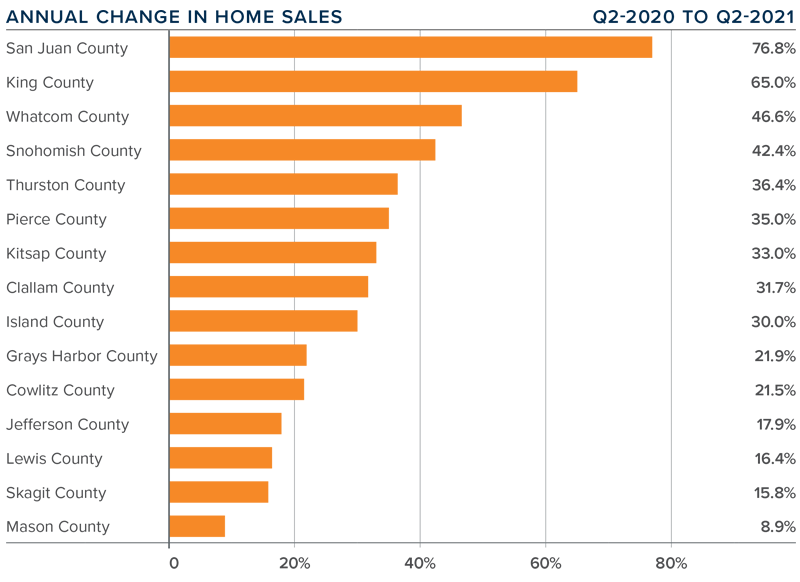
eastern washington Home Sales
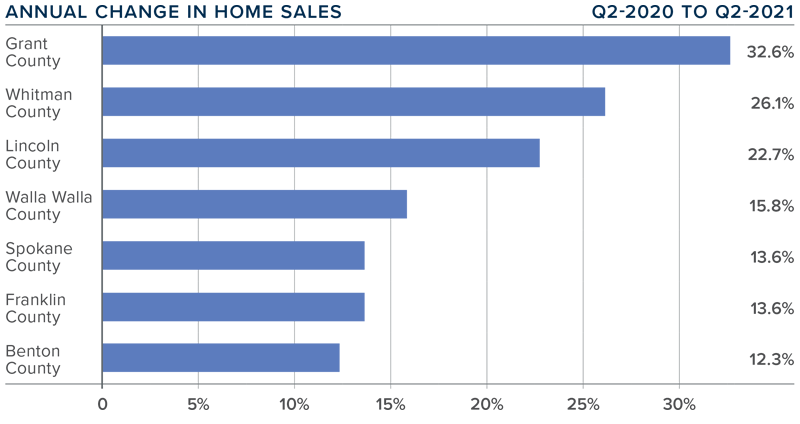
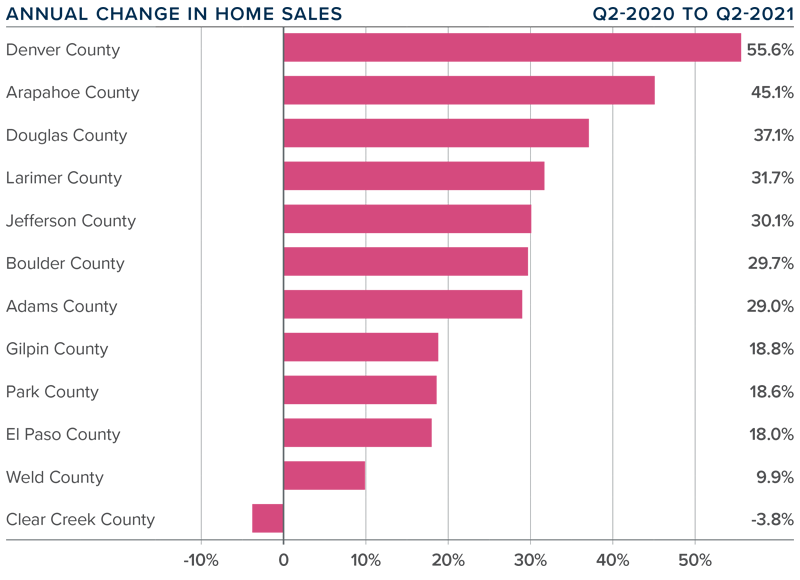
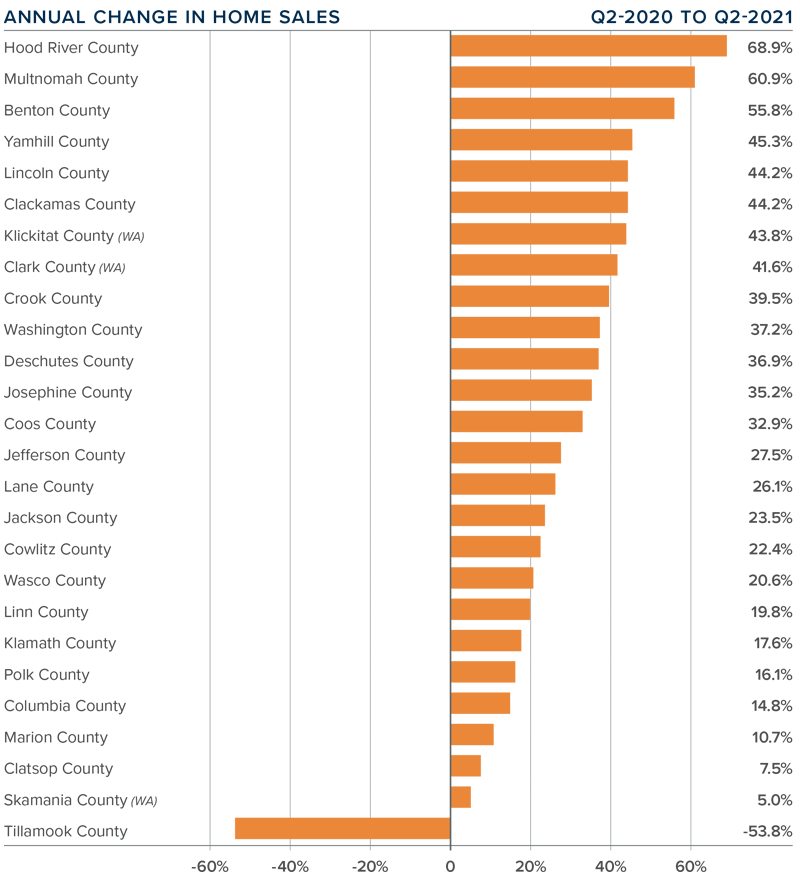
❱ Home sales throughout Eastern Washington rose 15.4% compared to the same quarter in 2020. Given that the pandemic was in full swing at that time, these stats aren’t very informative. Of greater interest was that sales rose 47.9% from the first quarter of this year.
❱ Listing activity was up more than 26% from the first quarter, which explains the rapid growth in sales. That said, the number of homes for sale is still 52% lower than during the early pandemic period.
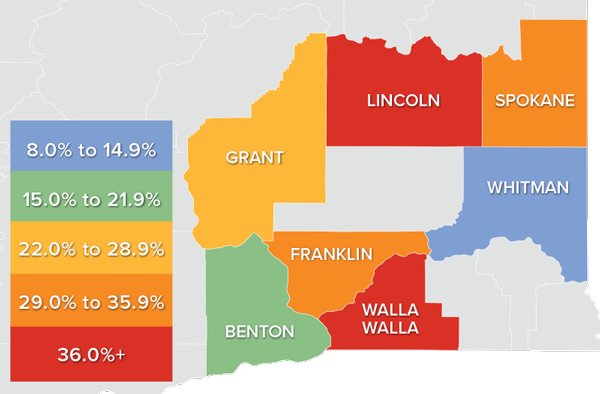
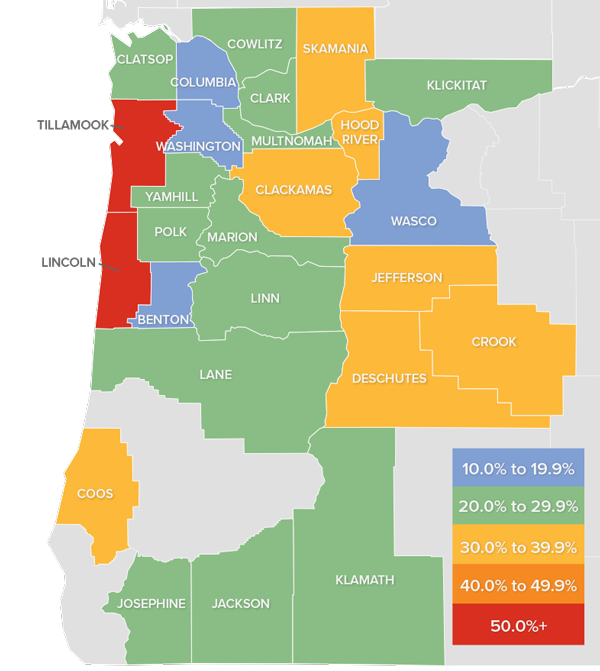
❱ Year-over-year, sales rose by double digits across the board. Of particular note was significant growth in Whitman, Spokane, Lincoln, and Walla Walla counties compared to the first quarter of this year.
❱ Pending home sales, which are an indicator of future closings, were 38.3% higher than in the first quarter. This suggests that closings in the third quarter will be positive.
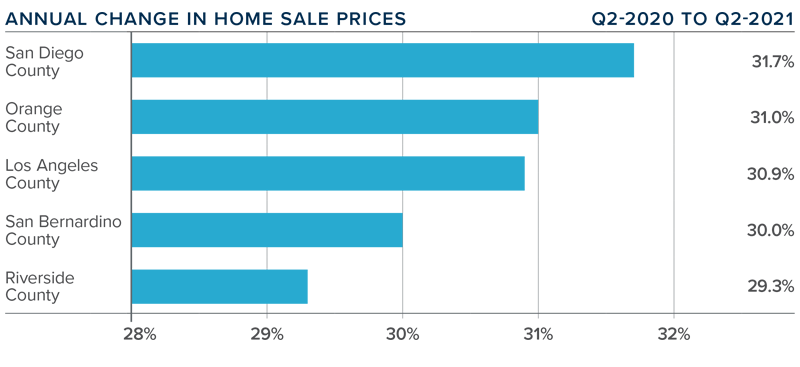
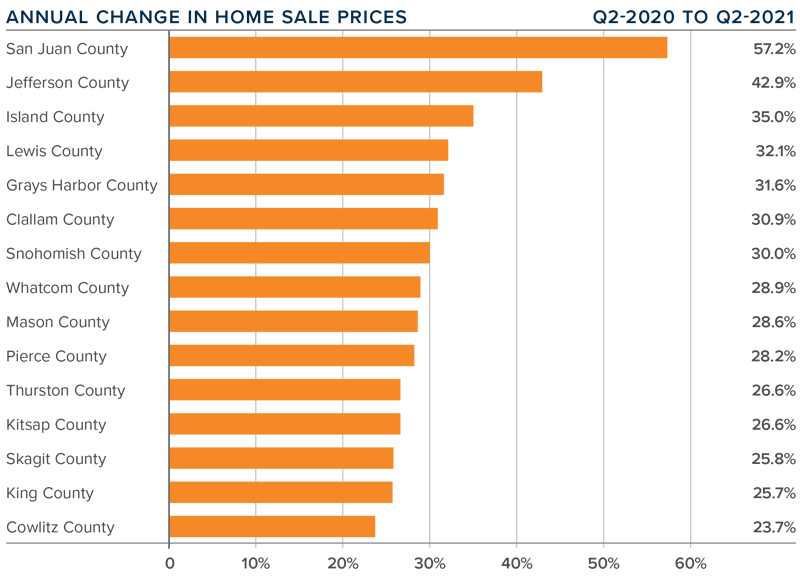
eastern washington Home Prices
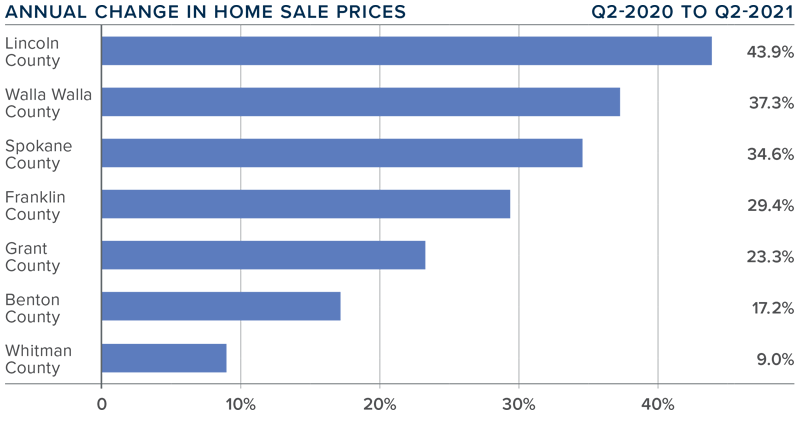
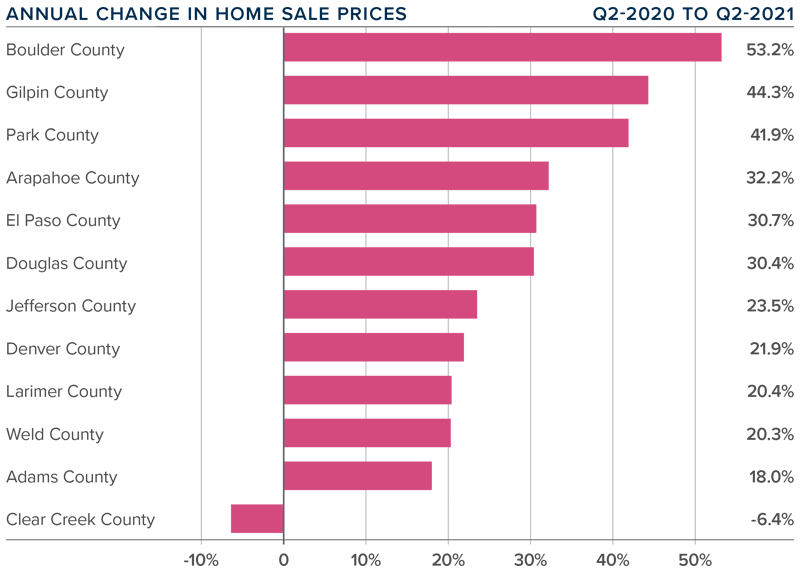
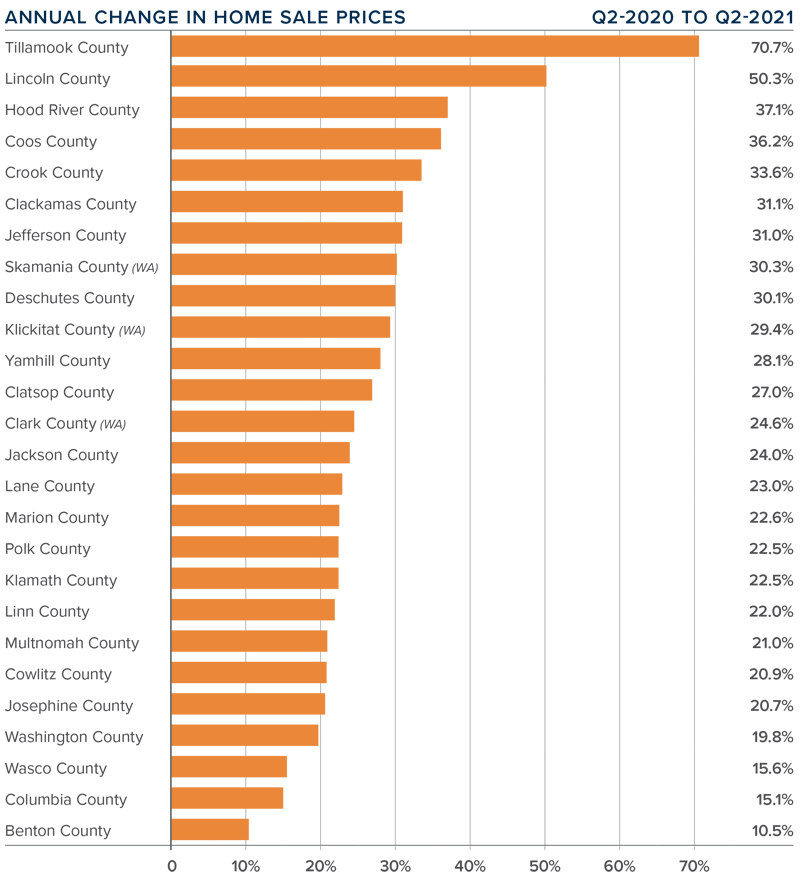
❱ Year-over-year, the average home price in Eastern Washington rose a very significant 28.8% to $410,242. Home prices were also 14.1% higher than in the first quarter of this year.
❱ Demand remains strong, and, even with greater inventory of homes for sale, prices continue to rise at well-above-average rates.
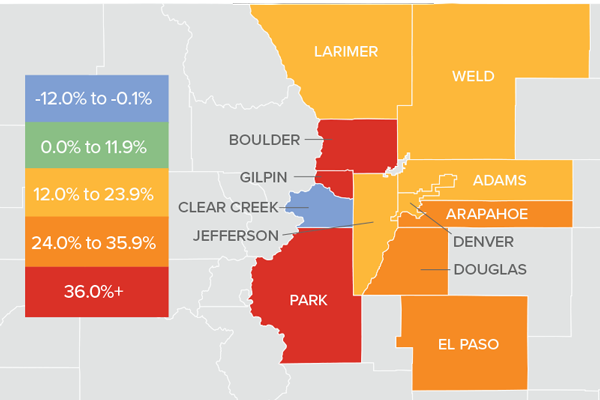
❱ Prices rose in every county, and all but one county saw double-digit increases. Lincoln, Walla Walla, and Spokane counties all experienced significant growth.
❱ Mortgage rates pulled back in the quarter, but I expect them to rise modestly as we move through the year. This will have some impact on the pace of home price growth, but a larger factor will be affordability. Spokane County is verging on becoming technically unaffordable for buyers, and all counties aside from Lincoln are now considered unaffordable for first-time buyers.
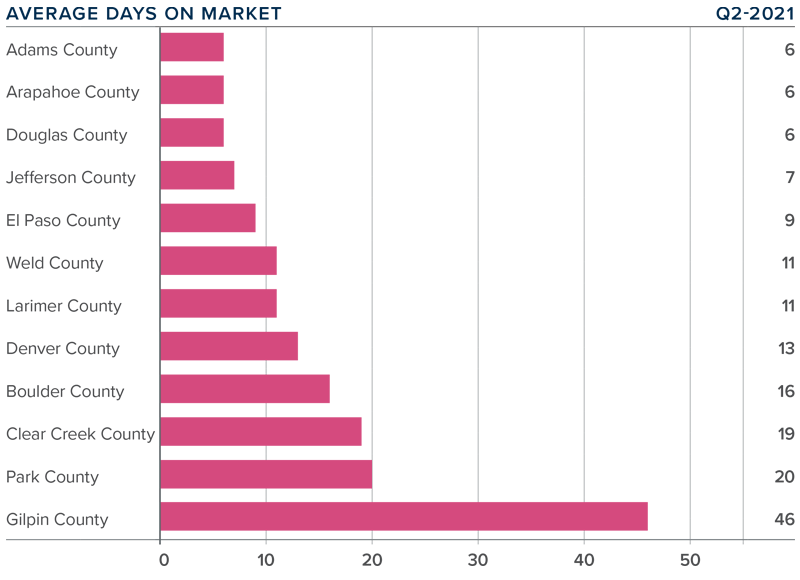
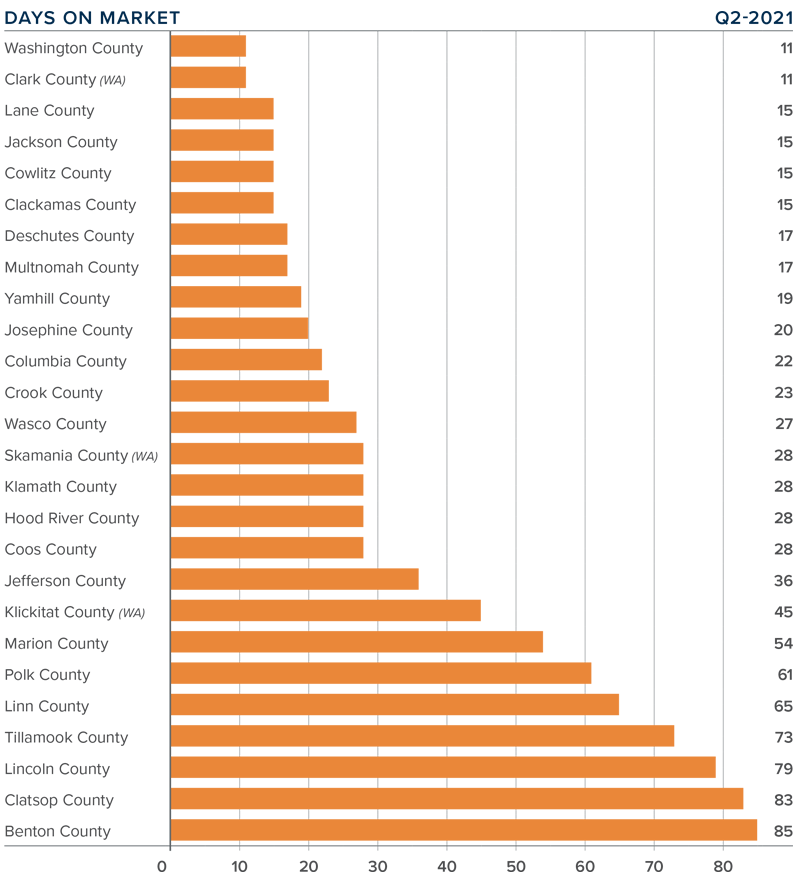
Days on Market
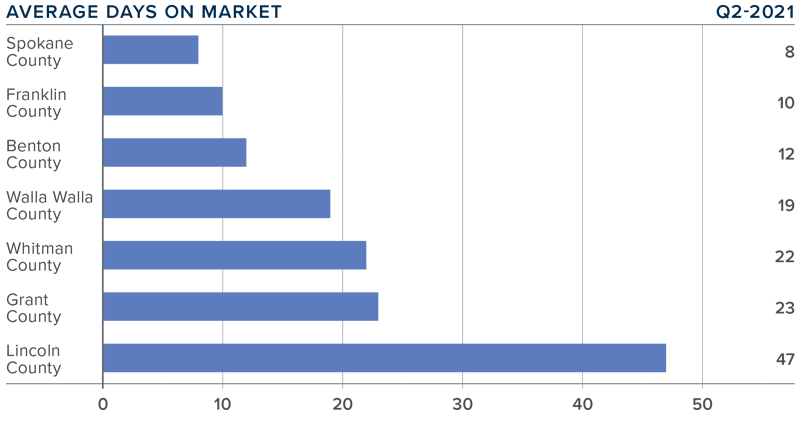
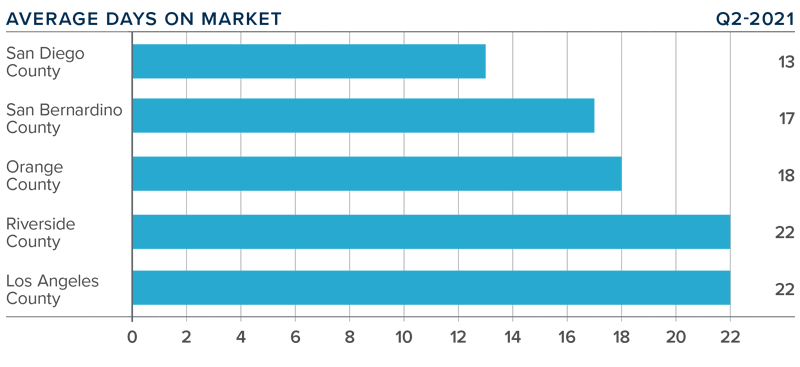
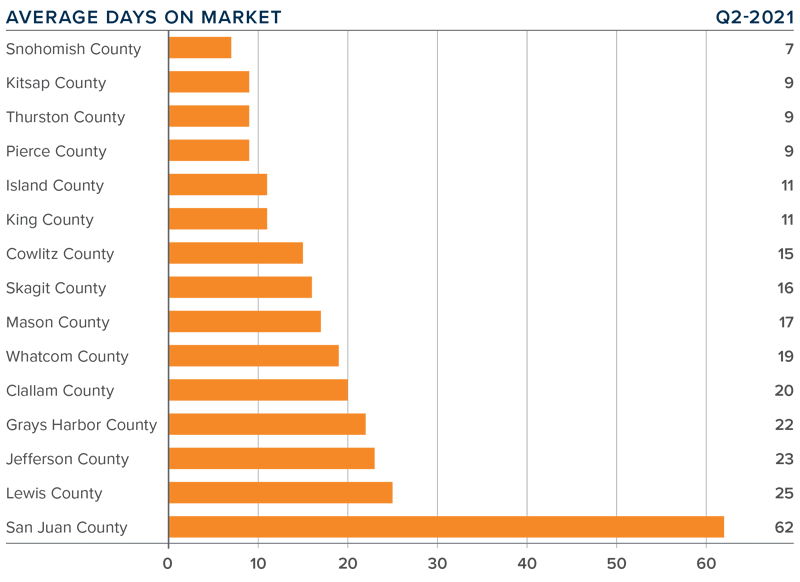
❱ The average time it took to sell a home in Eastern Washington in the second quarter of 2021 was 20 days.
❱ During the second quarter, it took 15 fewer days to sell a home in Eastern Washington than it did a year ago.
❱ All markets saw days-on-market drop compared to the second quarter of 2020, with significant declines in Walla Walla (-27 days), Whitman (-22 days), and Grant (-20 days) counties.
❱ It took 13 fewer days to sell a home in the second quarter than it did during the first quarter of last year.
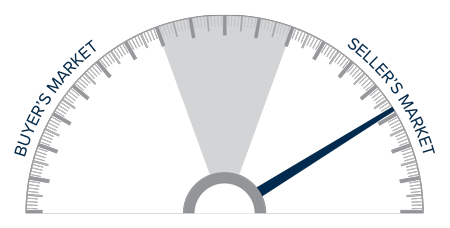
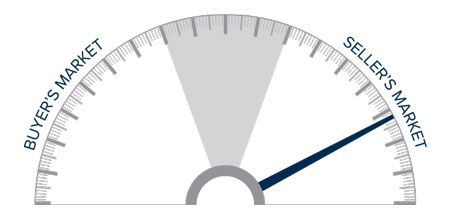
Conclusions
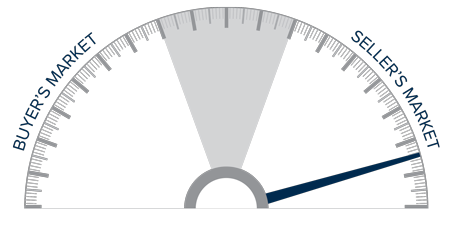
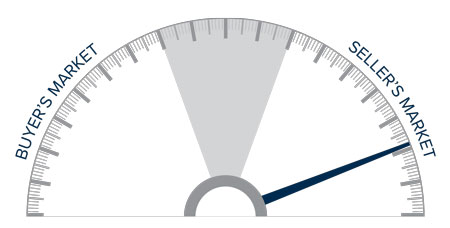
This speedometer reflects the state of the region’s real estate market using housing inventory, price gains, home sales, interest rates, and larger economic factors.
Eastern Washington’s economy continues to recover, and rising mortgage rates in the first quarter nudged a lot of buyers off the fence. Even with rates pulling back in the second quarter, the belief that they will start to rise again has only increased buyer urgency, which has also been buoyed by growing levels of inventory.
The market will continue to perform strongly as we move through the balance of this year and, even though there are more homes for sale, conditions are still highly competitive. Because affordability issues are increasing, I am leaving the needle in the same place as last quarter, but it remains a seller’s market.
About Matthew Gardner

As Chief Economist for Windermere Real Estate, Matthew Gardner is responsible for analyzing and interpreting economic data and its impact on the real estate market on both a local and national level. Matthew has over 30 years of professional experience both in the U.S. and U.K.
In addition to his day-to-day responsibilities, Matthew sits on the Washington State Governors Council of Economic Advisors; chairs the Board of Trustees at the Washington Center for Real Estate Research at the University of Washington; and is an Advisory Board Member at the Runstad Center for Real Estate Studies at the University of Washington where he also lectures in real estate economics.


")


