
 Facebook
 X
X
 Pinterest
 Copy Link
Local Look: Western Washington Housing Update 6/5/2025

Hi. I’m Jeff Tucker, principal economist at Windermere Real Estate, and this is a Local Look at the March 2025 data from the Northwest MLS.
Last month, we saw a sudden pullback in pending sales, and those chickens came home to roost with fewer closed sales in May.
Many of these impacted closed sales originated from the weeks in April following Trump’s “Liberation Day”, when the stock market had dropped sharply, and a lot of buyers paused their home searches. Now, we saw the stock market fully recover by May, and while it’s still a little too early to tell, there are indications that the housing market is also getting back on track.
Here are the four key metrics I watch to track supply and demand in the market: closed and pending sales, which tell us a lot about demand; and listings – new and active – which tell us a lot about supply.
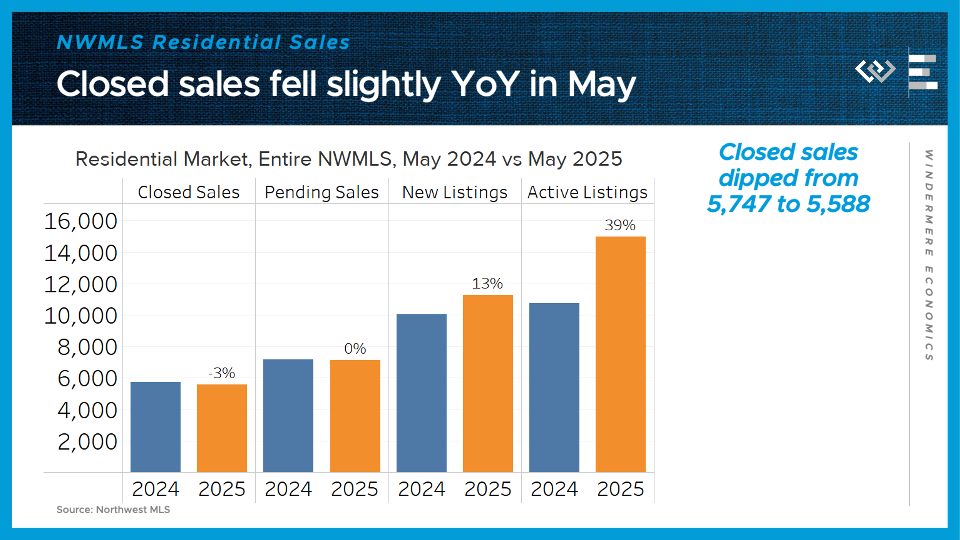
Across the Northwest MLS, closed sales of single-family homes fell 3% in May from their year-ago levels, after growing 1% in April. Pending sales, which are more of a real-time demand indicator, were flat from last year, a promising rebound after falling 4% year-on-year in April.
On the supply side, about 13% more new listings hit the market this May, and the tally of active listings ended the month 39% higher than May 2024’s inventory. Buyers are still seeing a lot more options than they had last spring, but one little glimmer of an inflection point here is that year-over-year inventory growth has stopped accelerating higher.
Finally: the median price for those closed single-family home sales fell 1% from last year, to $677,500. The extra inventory and cautious buyers have brought price appreciation to a halt for now.

Putting it all together: closed sales, and home prices, stepped down slightly from last year at this time, which we were expecting after the weak demand signals in April’s data. But the pending sales data suggest that buyers started coming back in May.
Now I’ll dig into details for the four counties encompassing the greater Seattle area.
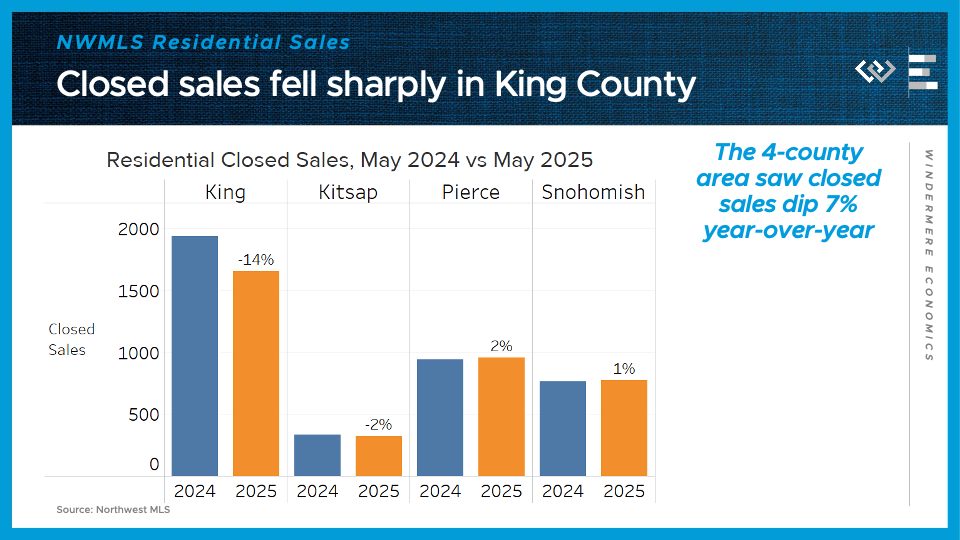
Residential closed sales dipped 7% year over year here in the 4-county region, led by a 14% drop in King County. Closed sales dipped 2% in Kitsap County; climbed 2% in Pierce County, including Tacoma; and climbed 1% in Snohomish County, including Everett. The 3 counties other than King held up surprisingly well, given that all 4 counties had seen sizeable pending sales declines in April. Maybe some buyers came back and closed quickly in May!
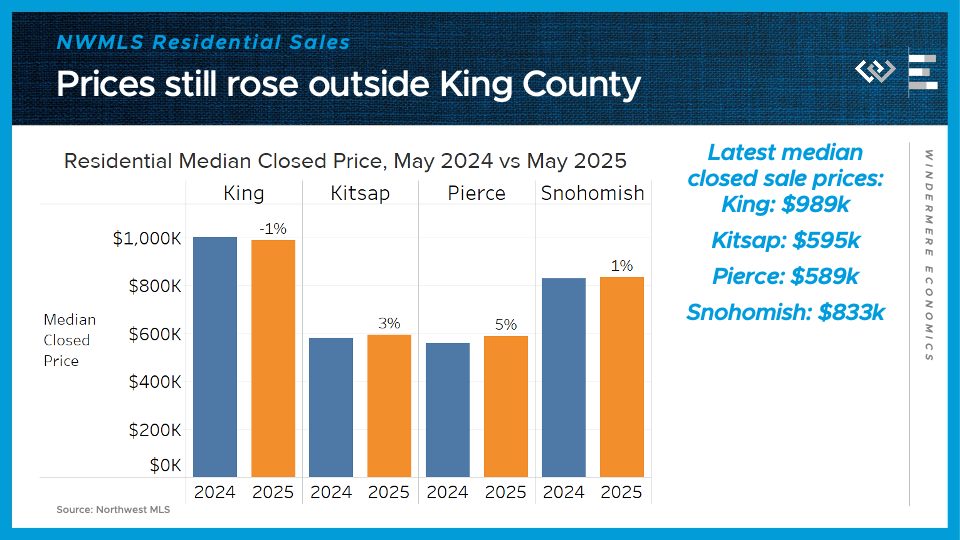
Similarly, King County saw the only median sale price decline, by 1.2%, back down just below a million dollars, while median prices kept climbing modestly in Kitsap and Pierce Counties, and just barely climbed in Snohomish County.
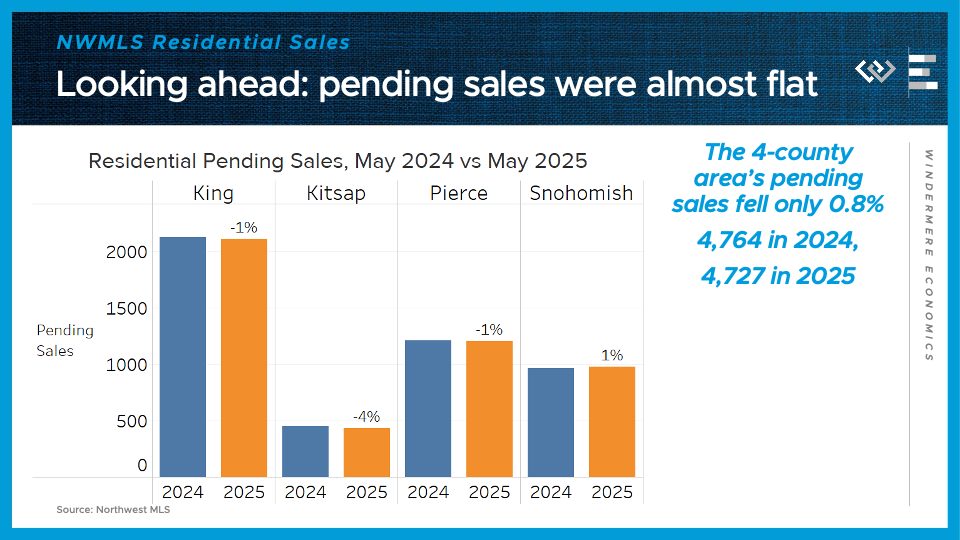
Looking ahead, pending sales dropped only 0.8% in the 4-county area: 0.8% in King, down 4% in Kitsap, down 0.7% in Pierce, and up 0.8% in Snohomish County. That’s a strong indication that local market activity has rebounded a bit after the shock in April around new tariff announcements.
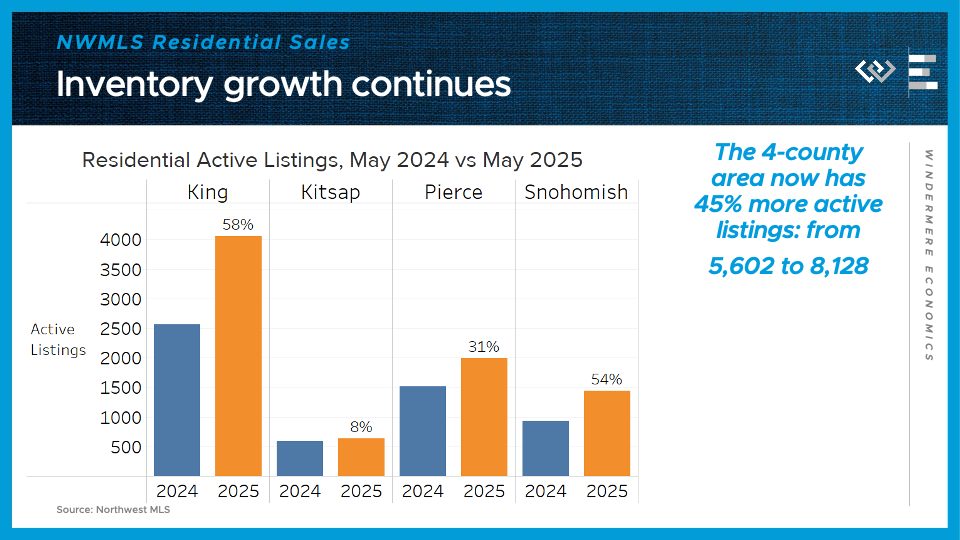
On the supply side, the 4-county greater Seattle area had just over 8,100 active listings at the end of May, up 45% from the same time last year. Just like in April, the inventory growth is especially dramatic in King and Snohomish Counties, where listings are up 58% and 54% respectively. Kitsap inventory is only up 8% year-over-year.
All in all, this report confirmed that greater-Seattle-region buyers stepped back in April, but gave some promising indications that buyers returned at nearly year-ago levels in May. Economic uncertainty is still the watchword, and mortgage rates have unfortunately settled in at a higher range of around 7%. But buyers shopping now will definitely benefit from the most inventory in years, helping them find the perfect fit, all while facing less competition from other buyers than we’ve seen in recent spring selling seasons.
Numbers To Know 4/16/25: Let’s Talk Tariffs

This is the latest in a series of videos with Windermere Principal Economist Jeff Tucker where he delivers the key economic numbers to follow to keep you well-informed about what’s going on in the real estate market.
Our first number this week is all about the elephant in the room:
Tariffs
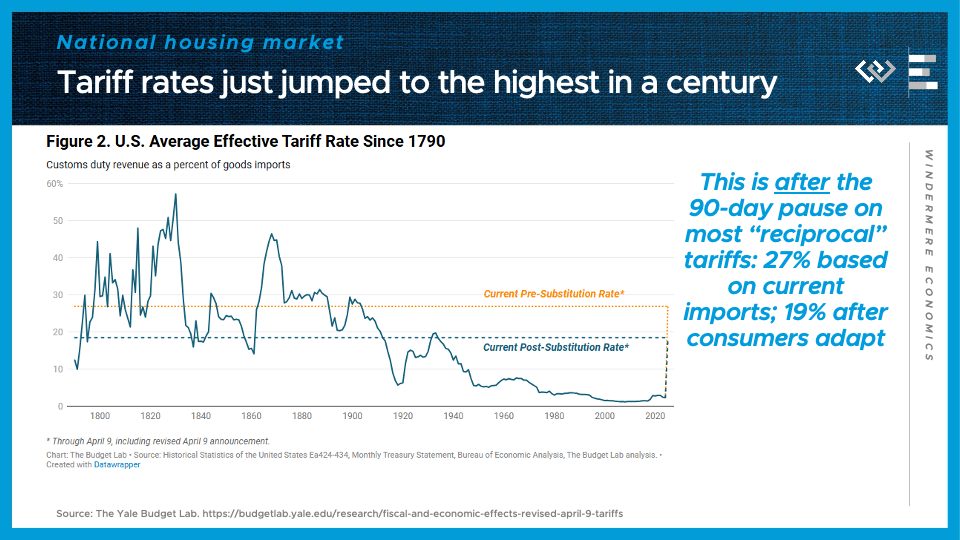
President Trump’s new tariff schedule announced so far in April will raise the average effective tariff rate on imports by a factor of TEN, from 2.6% to 27% — the highest since 1903. And that’s including the 90-day pause for some of the higher reciprocal tariffs. The Yale Budget Lab computed that based on the mix of imports we have been buying. They also estimated, on this chart, that after Americans start substituting away from highly-tariffed sources like China, the post-substitution rate might fall as low as 18.5 percent. That would be the highest since 1933, when trade was shrinking during the Great Depression.
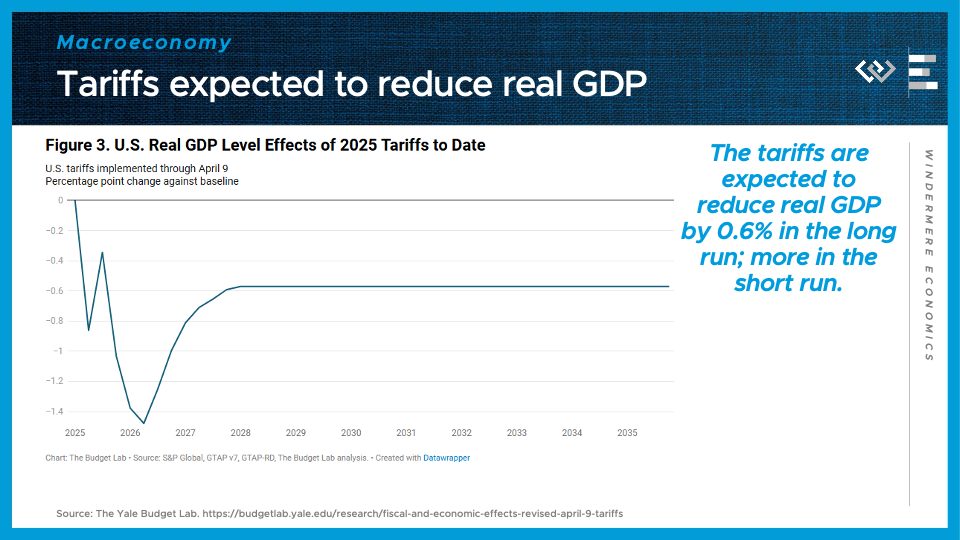
What effect will this have? For one, it will reduce real GDP in the U.S. One estimate has it reducing real GDP growth in 2025 by 1.1 percentage points, and a permanent reduction of 0.6%.
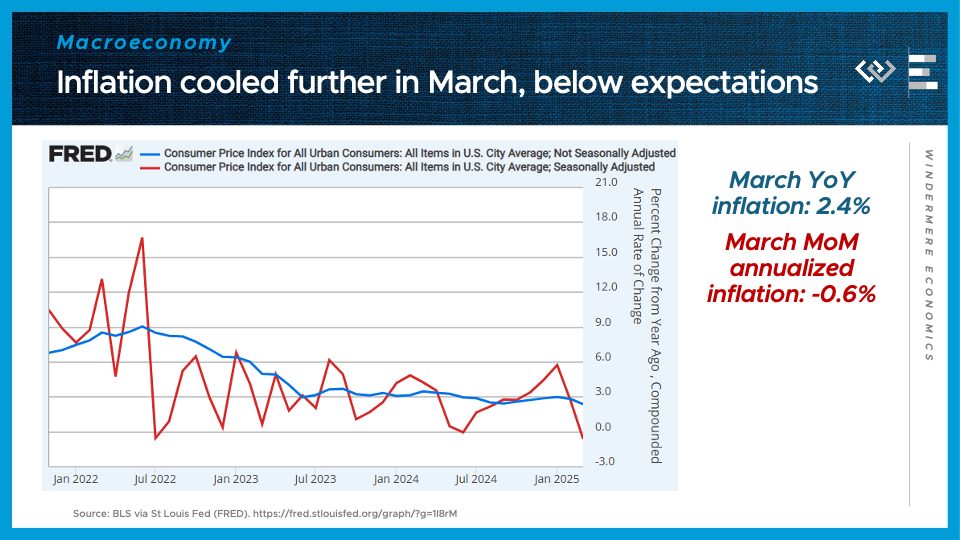
So far, the effects of tariffs haven’t shown up in much hard economic data. The March CPI inflation report, for instance, showed inflation came in below expectations, with a surprising month-over-month decline in the price level, and a cooldown in the year-over-year growth rate to 2.4%. That’s important because it helps give the Fed permission to cut rates later this year, if they start to see the job market slow down.
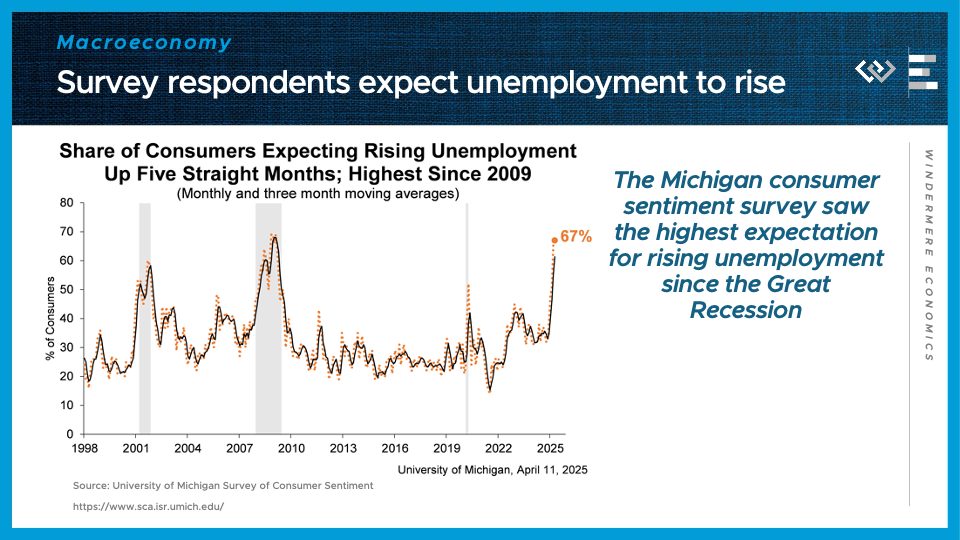
One place where the data is rapidly turning south is forward-looking indicators and especially in sentiment surveys, like the Michigan Consumer Sentiment Survey, whose respondents are the gloomiest about future unemployment that they’ve been since 2009.
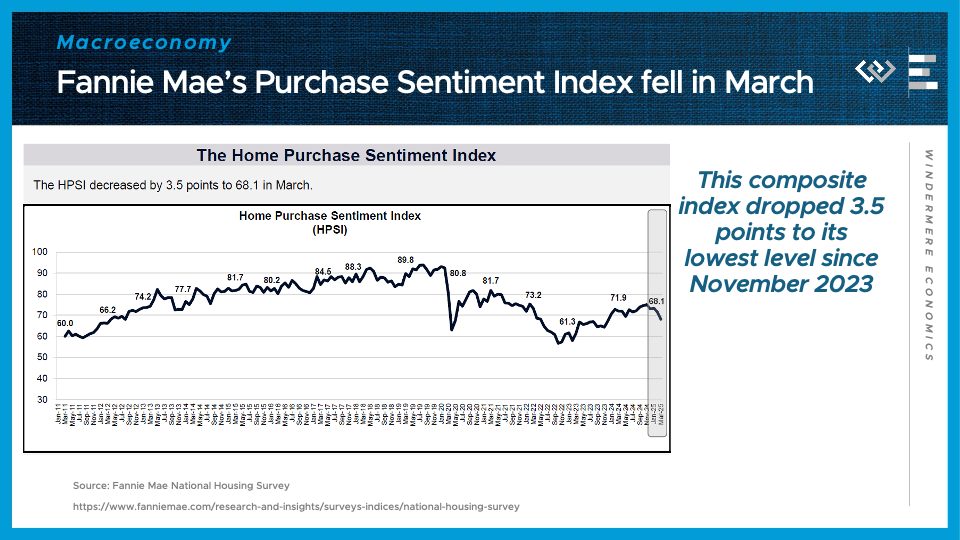
And in the housing market, the Fannie Mae Home Purchase Sentiment Index fell in March to its lowest level in about a year and a half.
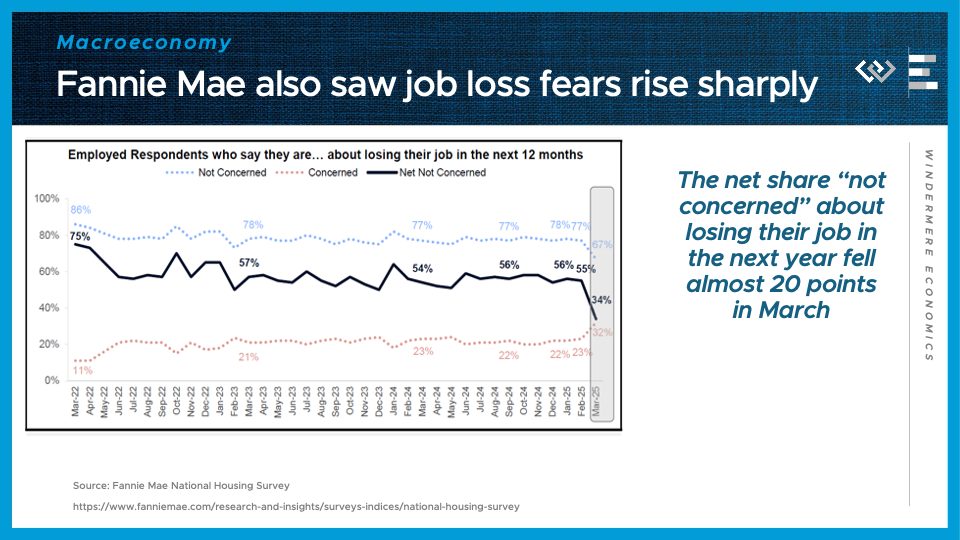
The main factor driving that decline was a sharp increase in respondents’ fears of job loss in the next 12 months. Unlike the Michigan chart a minute ago, this is respondents’s fears of losing their own job. That is likely to cause some would-be home buyers and sellers to hunker down and maybe press “Pause” on buying or selling until their outlook brightens up.
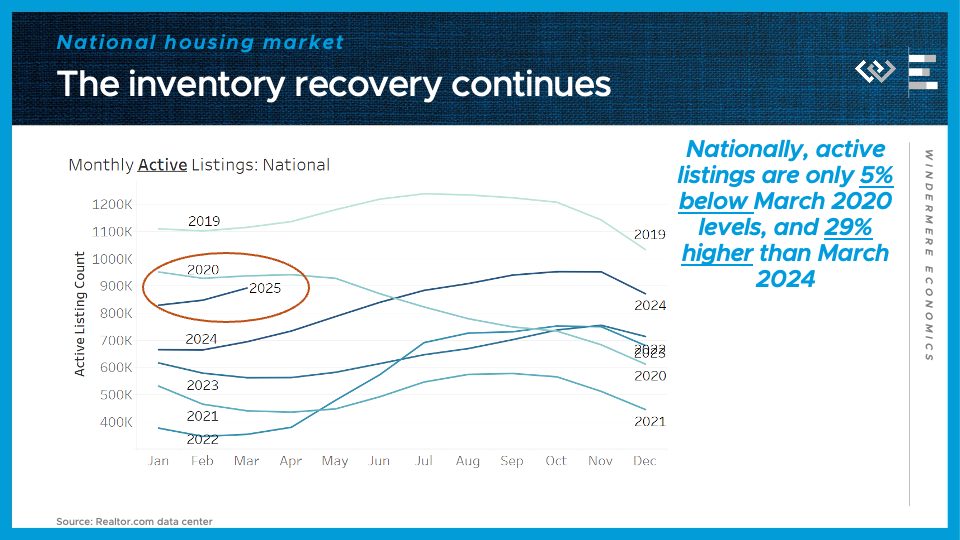
Speaking of the housing market: Data for March continue to show a relatively balanced spring market. Active inventory is only 5% below March 2020 levels, on the eve of the pandemic, and up 29% from last year.
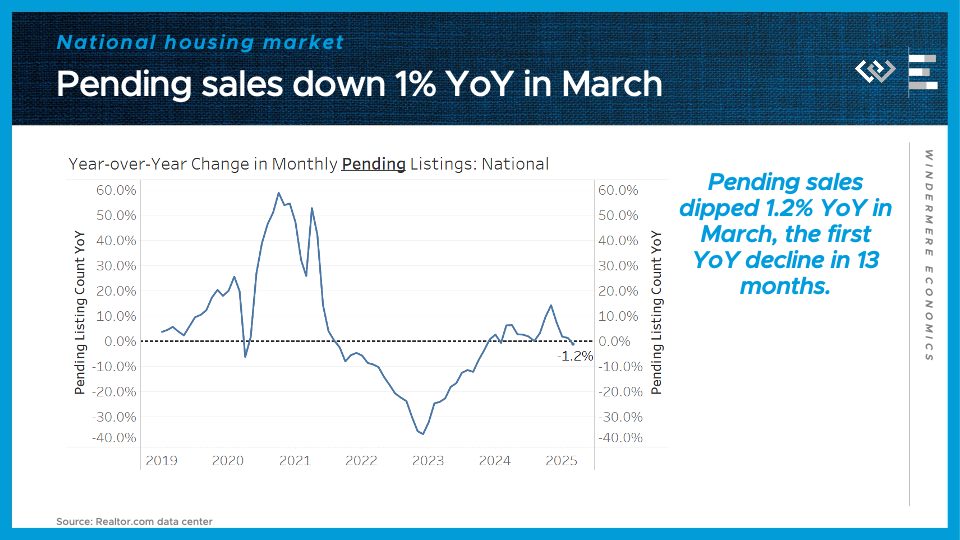
Pending sales are down about 1% from last March. So before any tariff impact, we are seeing just a tiny decline in sales activity.
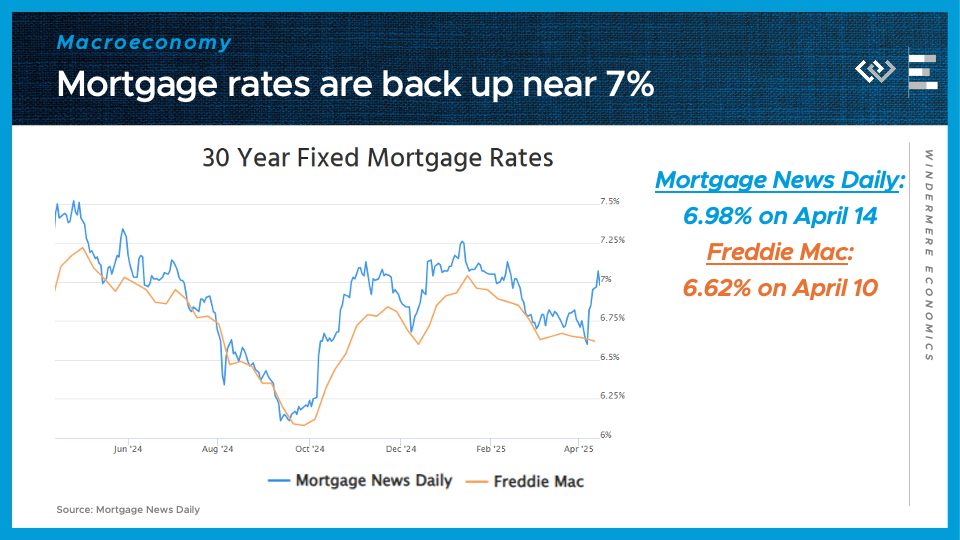
Finally, I’ll end by checking in with the USUAL elephant in the room: mortgage rates, which are back up around 7%. The financial market turmoil in response to the tariff news briefly pushed interest rates down, but then mortgages got carried along with a surprising upswing in US bond yields. That may settle back down in the coming weeks, but uncertainty really remains the watchword for economic data this year.
Local Look: Western Washington Housing Update 3/6/25

Hi. I’m Jeff Tucker, principal economist at Windermere Real Estate, and this is a Local Look at the February 2025 data from the Northwest MLS.
Hi. I’m Jeff Tucker, principal economist at Windermere Real Estate, and this is a Local Look at the February 2025 data from the Northwest MLS.
After an impressive Q4, and a decent start to the year in January, this February saw buyer activity – and listing activity – slow down a bit relative to last year. I think the rise in mortgage rates back to around 7% this winter has finally cooled off some of the buyer enthusiasm we saw in Q4.
Here are the four key metrics I watch to track supply and demand in the market: closed and pending sales, which tell us a lot about demand; and listings – new and active – which tell us a lot about supply.
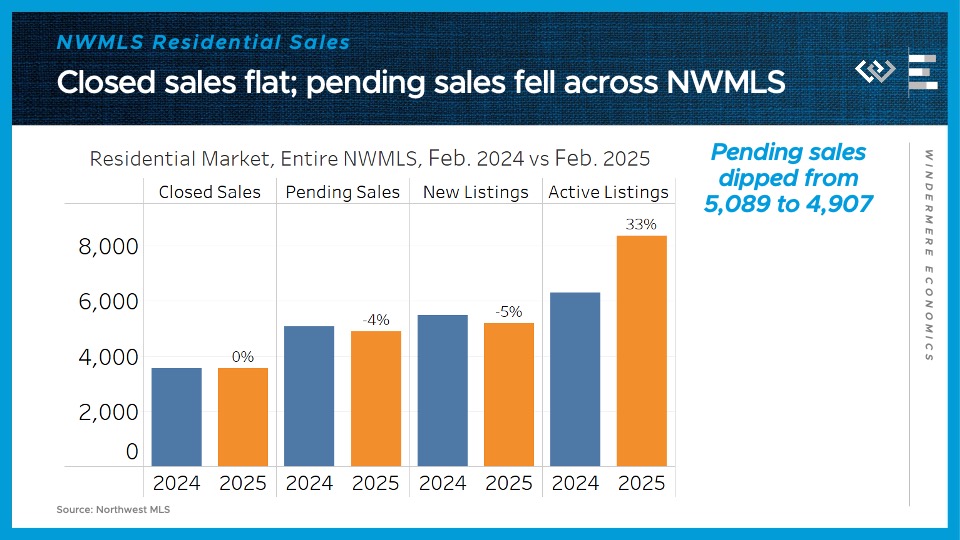
Across the Northwest MLS, closed sales of single-family homes were almost exactly flat year-over-year, at 3,550 vs last year’s 3,553. Pending sales, which will mostly close in March, dropped 4% from the same month last year. One extenuating circumstance was we had 1 less business day this February, since last year was a leap year, but this is still looking like a cooler market in terms of demand than we saw in Q4.
On the supply side, about 5% fewer new listings hit the market this February compared to last year’s, while the pool of active listings in the reservoir ended the month 33% higher than February 2024’s inventory.
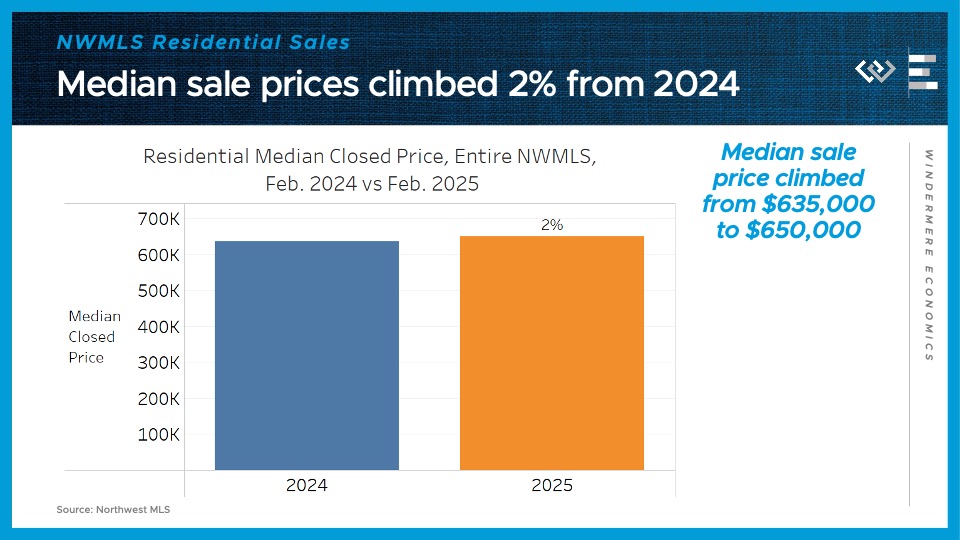
The final key metric to check in on: the median price for those closed single-family home sales climbed just 2% year-over year in February, from about $635,000 to $650,000. That represents a further cooldown from median price growth we’d seen in Q4, and it seems to indicate that the higher levels of inventory are putting some competitive pressure on sellers, preventing prices from rising too much.
Putting it all together, this looks like a market where the normal seasonal upswing in sales and prices has begun, but the year-over-year comparisons are looking a lot cooler than they were throughout Q4 and into January. I think that cooldown was mostly due to interest rates rebounding this winter, which discouraged buyers, so looking ahead, if we see the recent dip in interest rates in late February and early March actually stick, I could see some of that heat coming back into the market right as we hit the spring buying season.
Now I’ll dig into the four counties encompassing the greater Seattle area, where a similar cooldown played out in February.
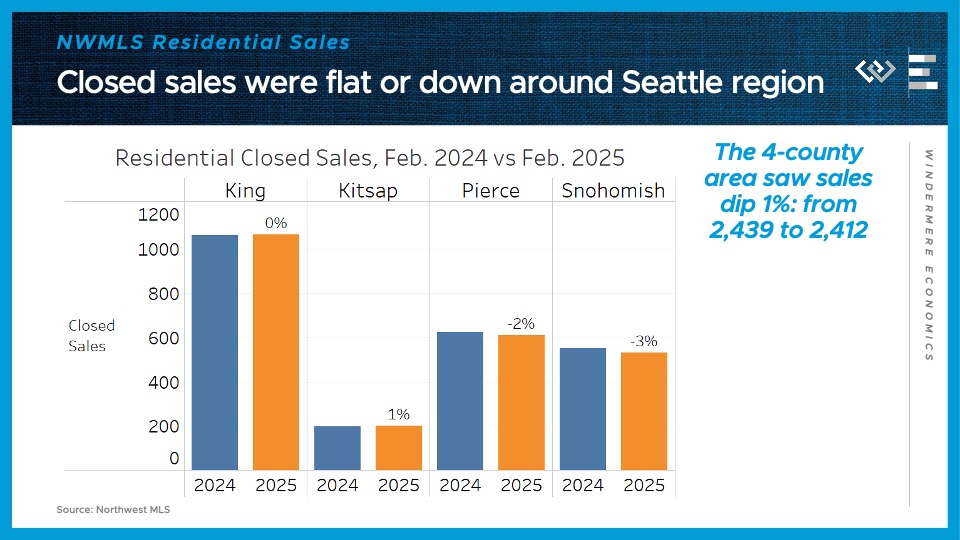
Residential closed sales were flat year over year here in King County; inched up 1% across the Sound in Kitsap County; dipped 2% in Pierce County, including Tacoma; and fell 3% in Snohomish County, including Everett. So for the 4-county region as a whole, that’s a dip of 1% from the same month last year. Not bad but it is a slowdown after 6% growth in January.
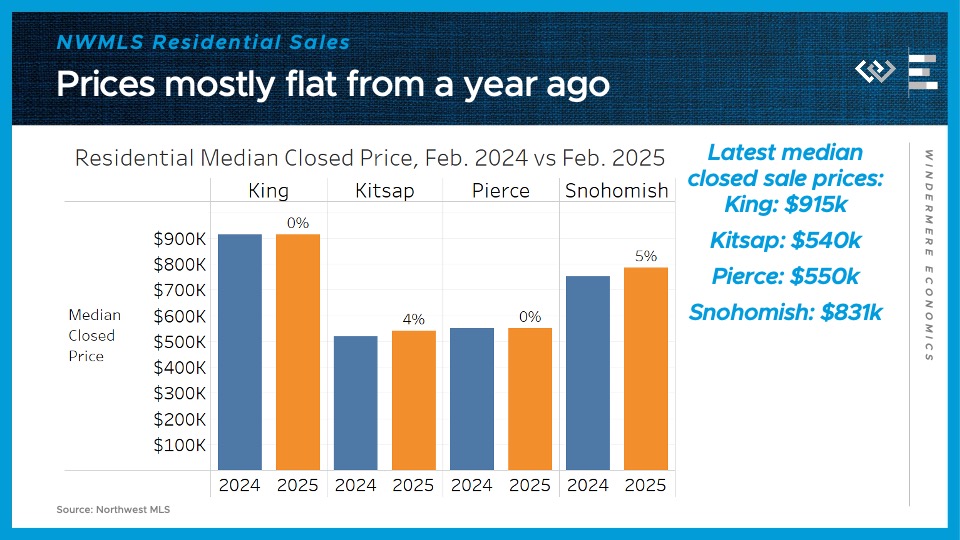
The median sale price was mostly flat, locally: 0% change from last year in King County and Snohomish County, up 4% in Kitsap County, and up 5% in Pierce County.
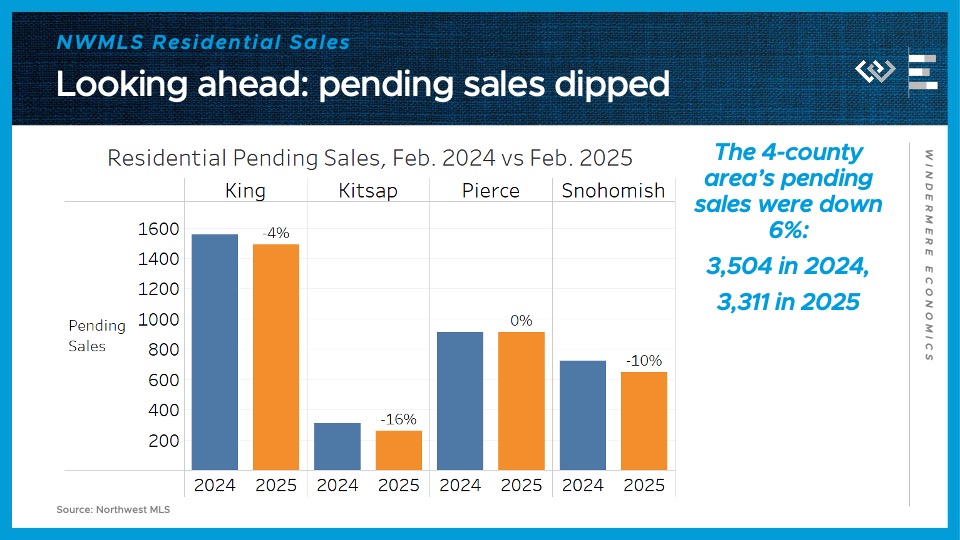
Looking ahead, pending sales were flat or down locally: down 4% in King, down 16% in Kitsap, flat in Pierce, and down 10% in Snohomish County. Altogether that makes a 6% decline across the 4 counties, suggesting we’ll see closings continue to fall year-over-year in March.
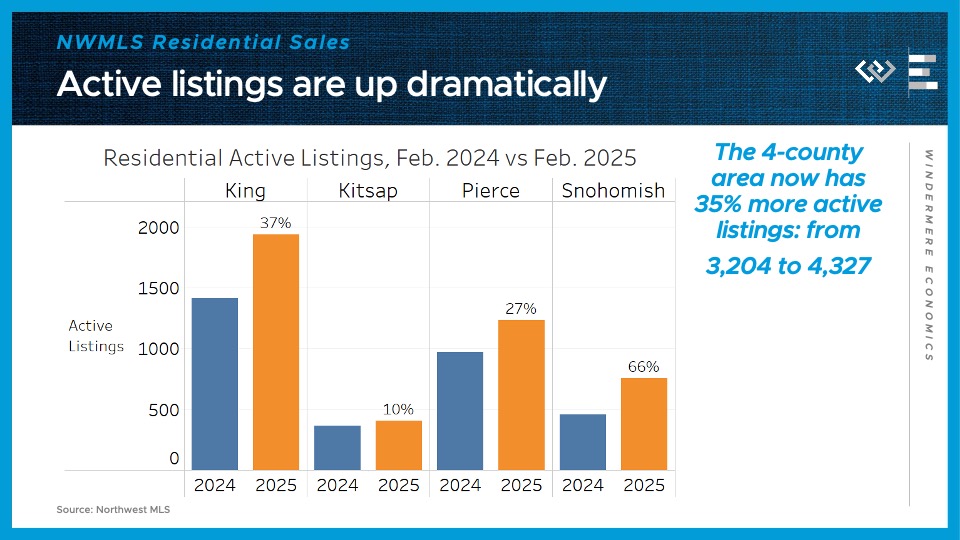
On the supply side, the 4-county greater Seattle area had about 35% more active listings at the end of February than the same time last year. That inventory growth comes in spite of a 7% decline across the region in the flow of new listings this February. Again, that was potentially impacted by the slightly shorter month, but it does suggest that sellers haven’t been flocking to list their homes in greater numbers yet this year. It could also be due to sellers jumping the gun on listing: year to date, new listings are up 8%, thanks to very impressive new listings in January. Now I’ll be curious to see if the recent dip in rates can help re-start the listing pipeline locally.
Matthew Gardner COVID-19 Housing & Economic Update: 10/26/2020

In today’s episode of “Monday with Matthew,” Windermere Chief Economist Matthew Gardner dives into three of the latest housing market data releases and gives context to their historical significance.
Matthew Gardner COVID-19 Housing & Economic Update 10/12/2020
On this week’s episode of “Mondays with Matthew,” Windermere Chief Economist, Matthew Gardner, takes another look at mortgage rates and forecasts what we can expect in the coming months for rates, affordability, and inventory.
Matthew Gardner Weekly COVID-19 Housing and Economic Update: 10/5/2020
This week on “Mondays with Matthew” our Windermere Chief Economist Matthew Gardner covers last week’s top economic headlines. Watch here for updates on the latest Case-Shiller and Consumer Confidence indexes.
Matthew Gardner Weekly COVID-19 Housing and Economic Update: 9/28/2020
On this week’s “Mondays with Matthew,” Windermere’s Chief Economist, Matthew Gardner analyzes data released last week about existing home sales, new home sales, and mortgages, demonstrating the housing market’s resilience in an economy mired by COVID-19.
Matthew Gardner Weekly COVID-19 Housing & Economic Update: 9/21/2020
On this week’s episode of “Mondays with Matthew”, Matthew Gardner discusses the most recent economic and real estate news, including retail sales, consumer sentiment, and the housing market index which is published by the National Association of Home Builders.
Matthew Gardner Weekly COVID-19 Housing & Economic Update: 9/14/2020
On this week’s episode of “Mondays with Matthew,” Windermere Chief Economist Matthew Gardner revisits mortgage forbearance, bringing you the latest in light of some recent headlines.
Matthew Gardner Weekly COVID-19 Housing & Economic Update: 8/31/2020
On this week’s episode of “Mondays with Matthew,” Matthew Gardner looks at last week’s real estate and economic news and goes beyond the headlines so that you can not only stay on top of the issues that affect you and your business, but also get more detail than is generally offered by the media.
")


