
 Facebook
 X
X
 Pinterest
 Copy Link
Q3 2023 Arizona Real Estate Market Update

The following analysis of select counties of the Arizona real estate market is provided by Windermere Real Estate. We hope that this information may assist you with making better-informed real estate decisions. For further information about the housing market in your area, please don’t hesitate to contact your Windermere Real Estate agent.
Regional Economic Overview
Job growth in Arizona has levelled off. The addition of 57,000 new jobs over the past 12 months represents an annual growth rate of 1.8%, which matches the level in the second quarter of this year. That said, Arizona’s unemployment rate in August was 3.8%, down from 4% in the third quarter of 2022.
Looking at the metro markets contained in this report, over the past 12 months Phoenix saw its job base rise 1.9% or 40,200 positions. With the addition of only 400 new jobs, employment in Prescott rose .6%. Unemployment rates suggested that both markets remain close to full employment, with the Phoenix area showing a jobless rate of 3.5%, while the unemployment rate in Prescott was 3.8%. The jobless rate in Phoenix matched the level in the third quarter of 2022, while Prescott saw its rate rise from 3.5%.
Arizona Home Sales
❱ In the third quarter of 2023, 14,711 homes sold. This was down 7% from the third quarter of 2022 and down 21.3% compared to the second quarter of this year.
❱ The slowdown in sales from the second quarter came in concert with a modest .9% increase in listing activity. It appears that the impact of higher mortgage rates is starting to be felt.
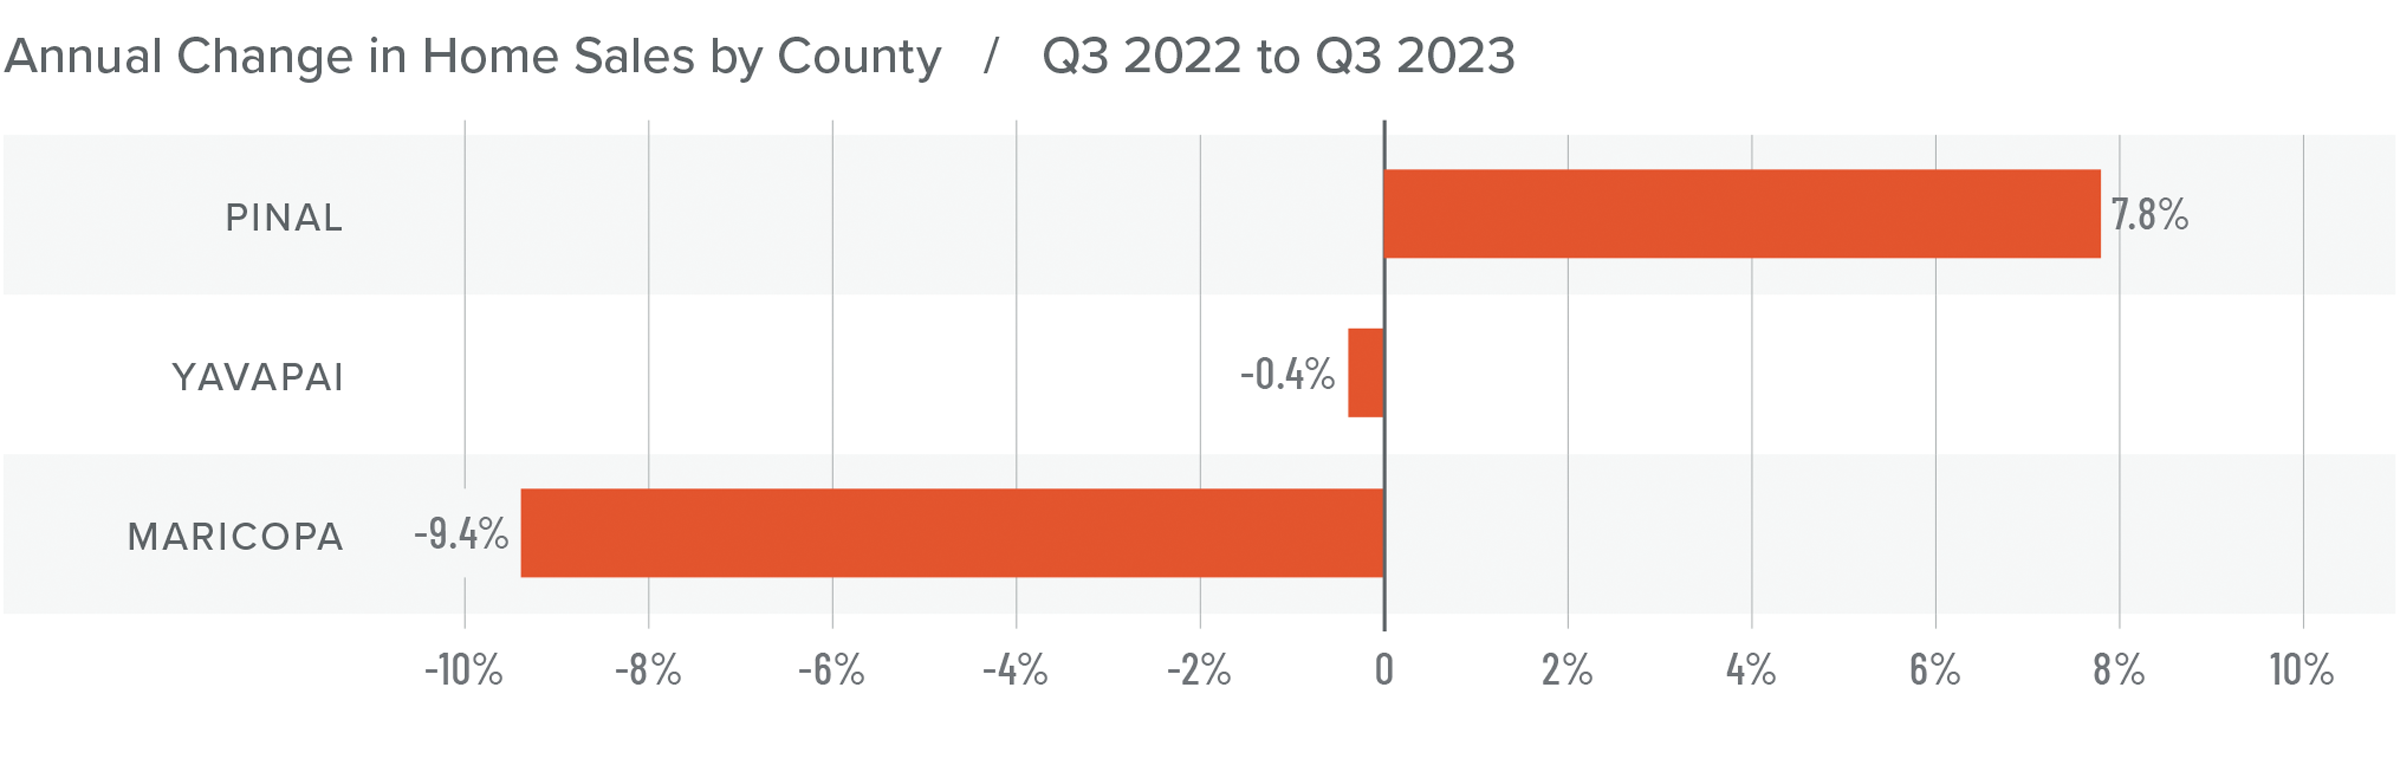
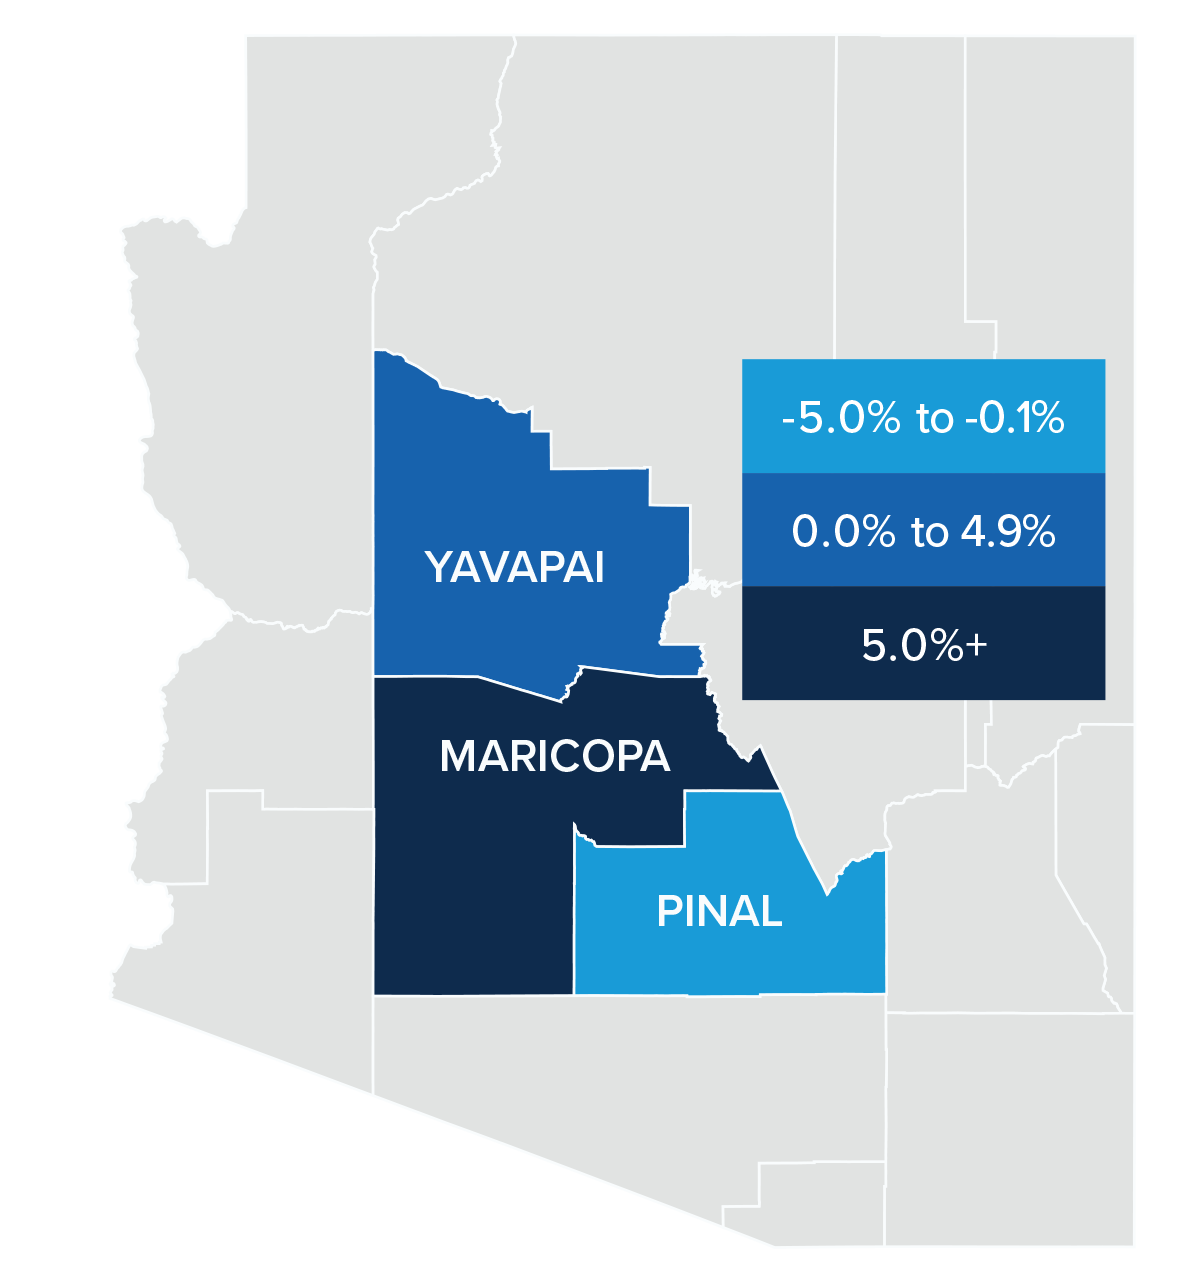
❱ Sales fell in Maricopa and Yavapai counties from the same period of 2022. Sales were up almost 8% in Pinal County. Compared to the second quarter of this year, sales fell across the board.
❱ Pending sales fell in Pinal and Maricopa counties but rose in the smaller Prescott market compared to the second quarter of 2023. With Maricopa County accounting for 84% of the market, I think it’s safe to assume that sales in the fourth quarter may also be down.
Arizona Home Prices
❱ Home sale prices rose a modest 1.9% compared to the third quarter of 2022 but were 2.2% lower than in the second quarter of the year. The average sale price was $596,465.
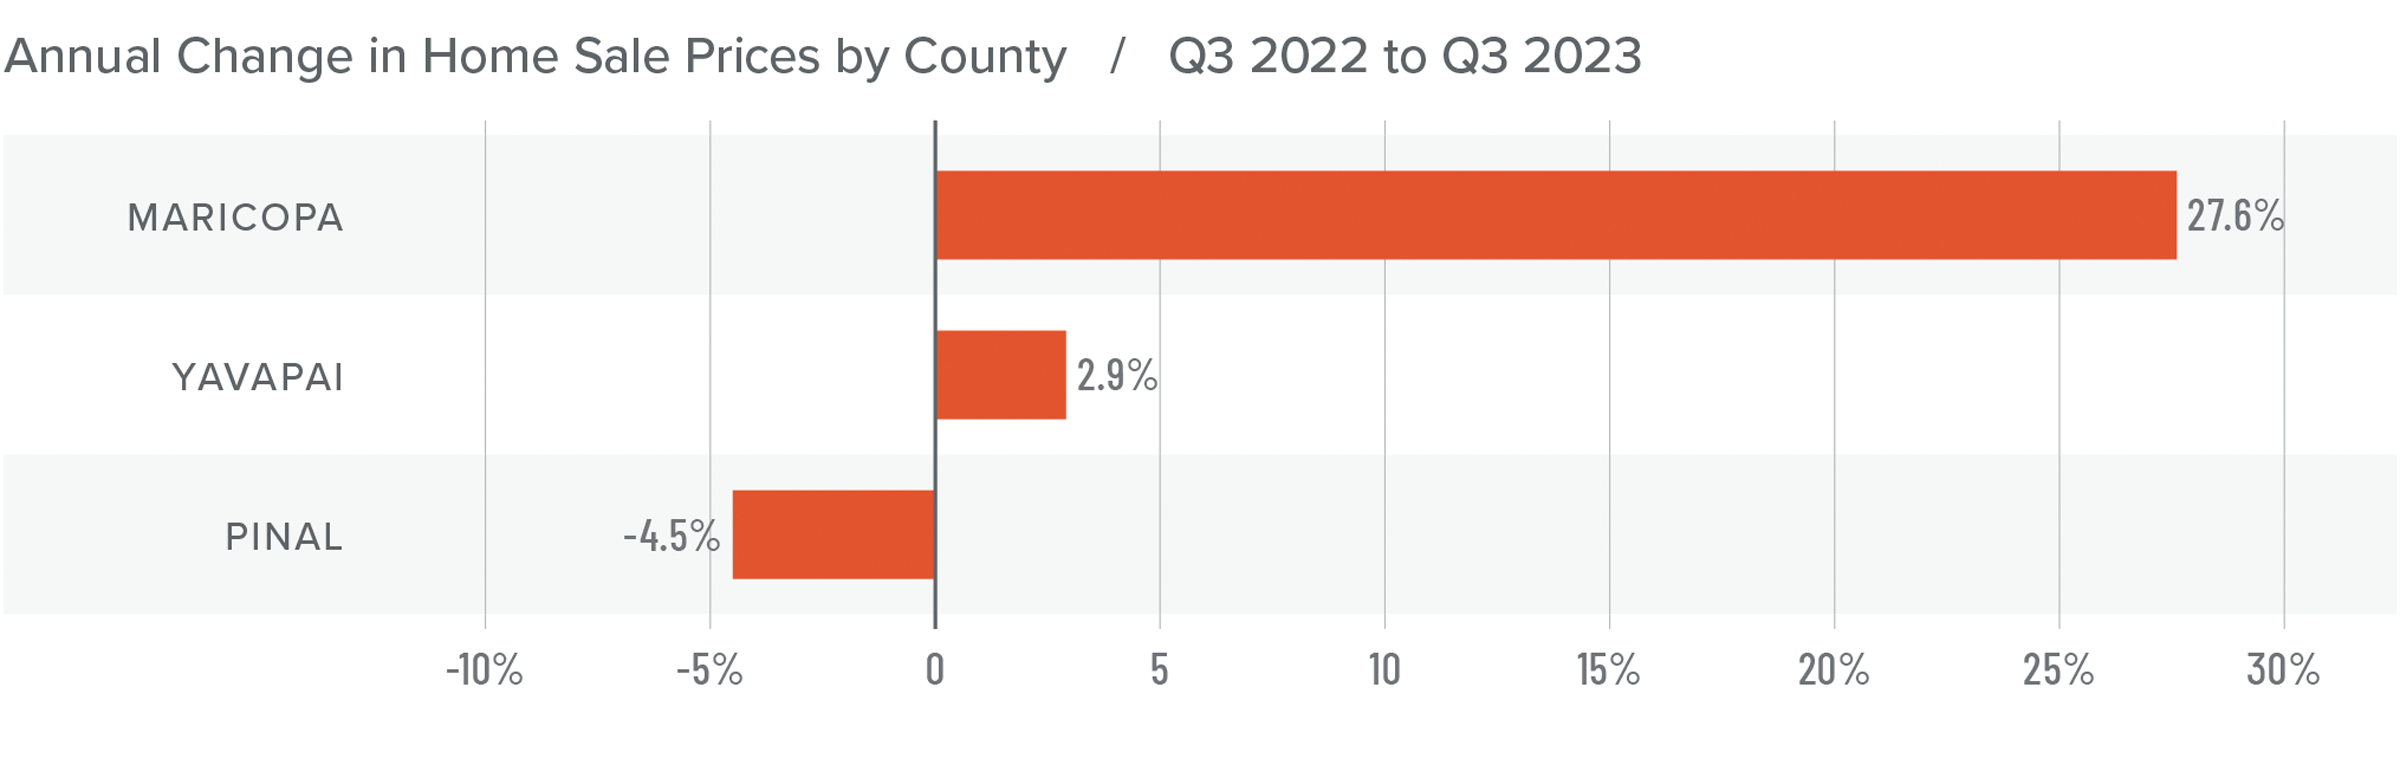
❱ Compared to the second quarter of this year, sale prices were 24.3% higher in Yavapai County but fell in the other two markets. Pinal County prices dropped .2% and Maricopa County prices were 2.3% lower.
❱ Lower sale prices are likely due to higher mortgage rates and decreasing affordability, as well as the fact that median list prices fell 1.7% between the second and third quarters of the year.
❱ With list prices lower and mortgage rates substantially higher, I doubt prices will see tangible increases for the remainder of the year.
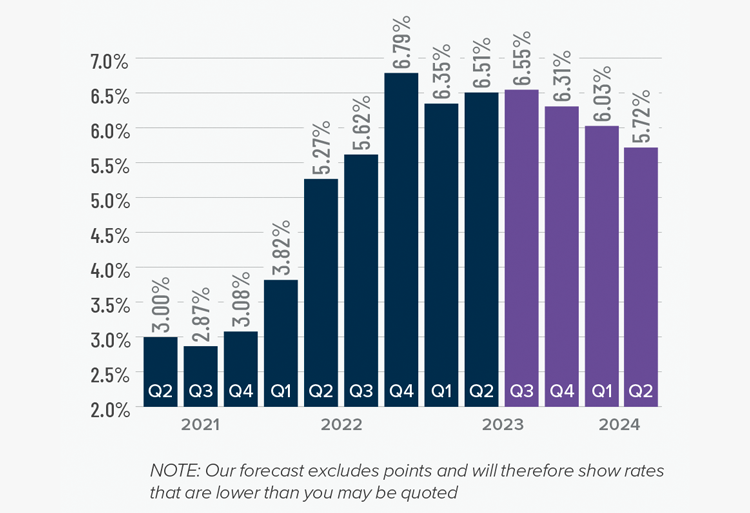
Mortgage Rates
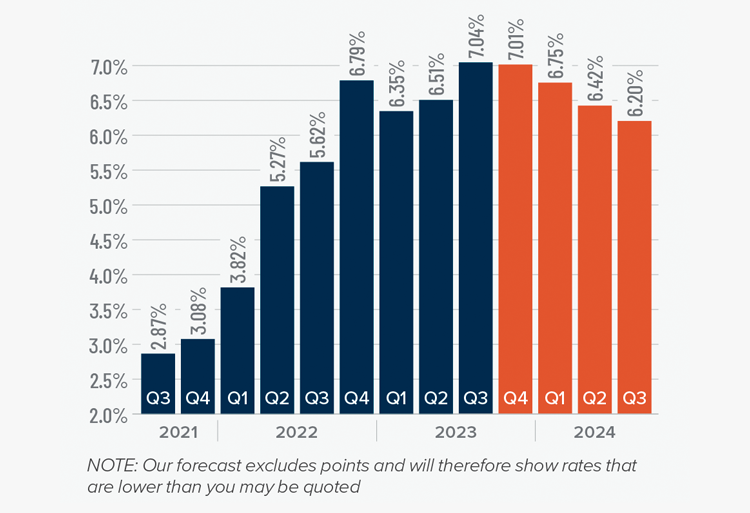
Mortgage rates continued trending higher in the third quarter of 2023 and are now at levels we have not seen since the fall of 2000. Mortgage rates are tied to the interest rate (yield) on 10-year treasuries, and they move in the opposite direction of the economy. Unfortunately for mortgage rates, the economy remains relatively buoyant, and though inflation is down significantly from its high, it is still elevated. These major factors and many minor ones are pushing Treasury yields higher, which is pushing mortgage rates up. Given the current position of the Federal Reserve, which intends to keep rates “higher for longer,” it is unlikely that home buyers will get much reprieve when it comes to borrowing costs any time soon.
With such a persistently positive economy, I have had to revise my forecast yet again. I now believe rates will hold at current levels before starting to trend down in the spring of next year.
Arizona Days on Market
❱ It took an average of 54 days for a home to sell in the third quarter of 2023. This was 20 more days than in the same quarter of 2022, but 11 fewer days compared to the second quarter of this year.
❱ Maricopa County was the tightest market in the region, with homes taking an average of 41 days to sell. Homes in Pinal and Yavapai counties took the longest time to sell at 61 days.
❱ All counties contained in this report saw average days on market rise from the same period in 2022, but market time fell across the board compared to the second quarter of this year.
❱ The greatest drop in market time compared to the second quarter of this year was in Pinal County, where it took 15 fewer days for a home to sell.

Conclusions
This speedometer reflects the state of the region’s real estate market using housing inventory, price gains, home sales, interest rates, and larger economic factors.
Lower pending and closed sales, in concert with falling list and sale prices, suggest that the market has shifted away from home sellers.
Although supply levels rose modestly from the previous quarter, they were down 42% from the same period in 2022, so the market cannot be described as oversupplied. This will function as some protection when it comes to home values, but prices likely won’t move much until mortgage rates start to drop, which won’t happen until early next year.
Home sales will still occur because there will always be households who have to move, but many buyers will be sidelined until rates come down, which means the housing market will remain somewhat static for the balance of the year.
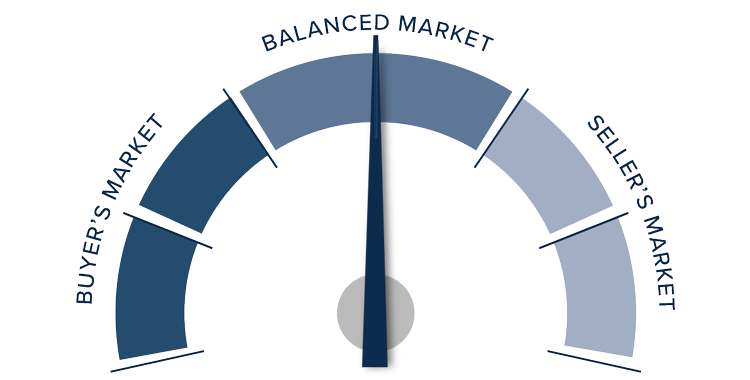
Given these factors, the needle has been moved back into the balanced quadrant, with neither buyers nor sellers having the upper hand.
Q2 2023 Arizona Real Estate Market Update

The following analysis of select counties of the Arizona real estate market is provided by Windermere Real Estate Chief Economist Matthew Gardner. We hope that this information may assist you with making better-informed real estate decisions. For further information about the housing market in your area, please don’t hesitate to contact your Windermere Real Estate agent.
Regional Economic Overview
Job growth in Arizona continues to slow. Though the state added 56,800 new jobs over the past 12 months, the annual growth rate of 1.8% is the lowest pace of growth since the pandemic ended. That said, the state’s unemployment rate in May was 3.4%, which was lower than the 3.7% rate we saw at the same time in 2022. Comparing the markets contained in this report to the second quarter of 2022, the Phoenix metro area saw its job base rise 1.9%, or 43,800 positions. The Prescott metro area saw employment rise 1.5%, with the addition of 1,000 new jobs. Unemployment rates suggested that both markets were at full employment. The jobless rate was 3.1% in the Phoenix area and 3.3% in the Prescott area. Both markets saw unemployment fall relative to the same period in 2022.
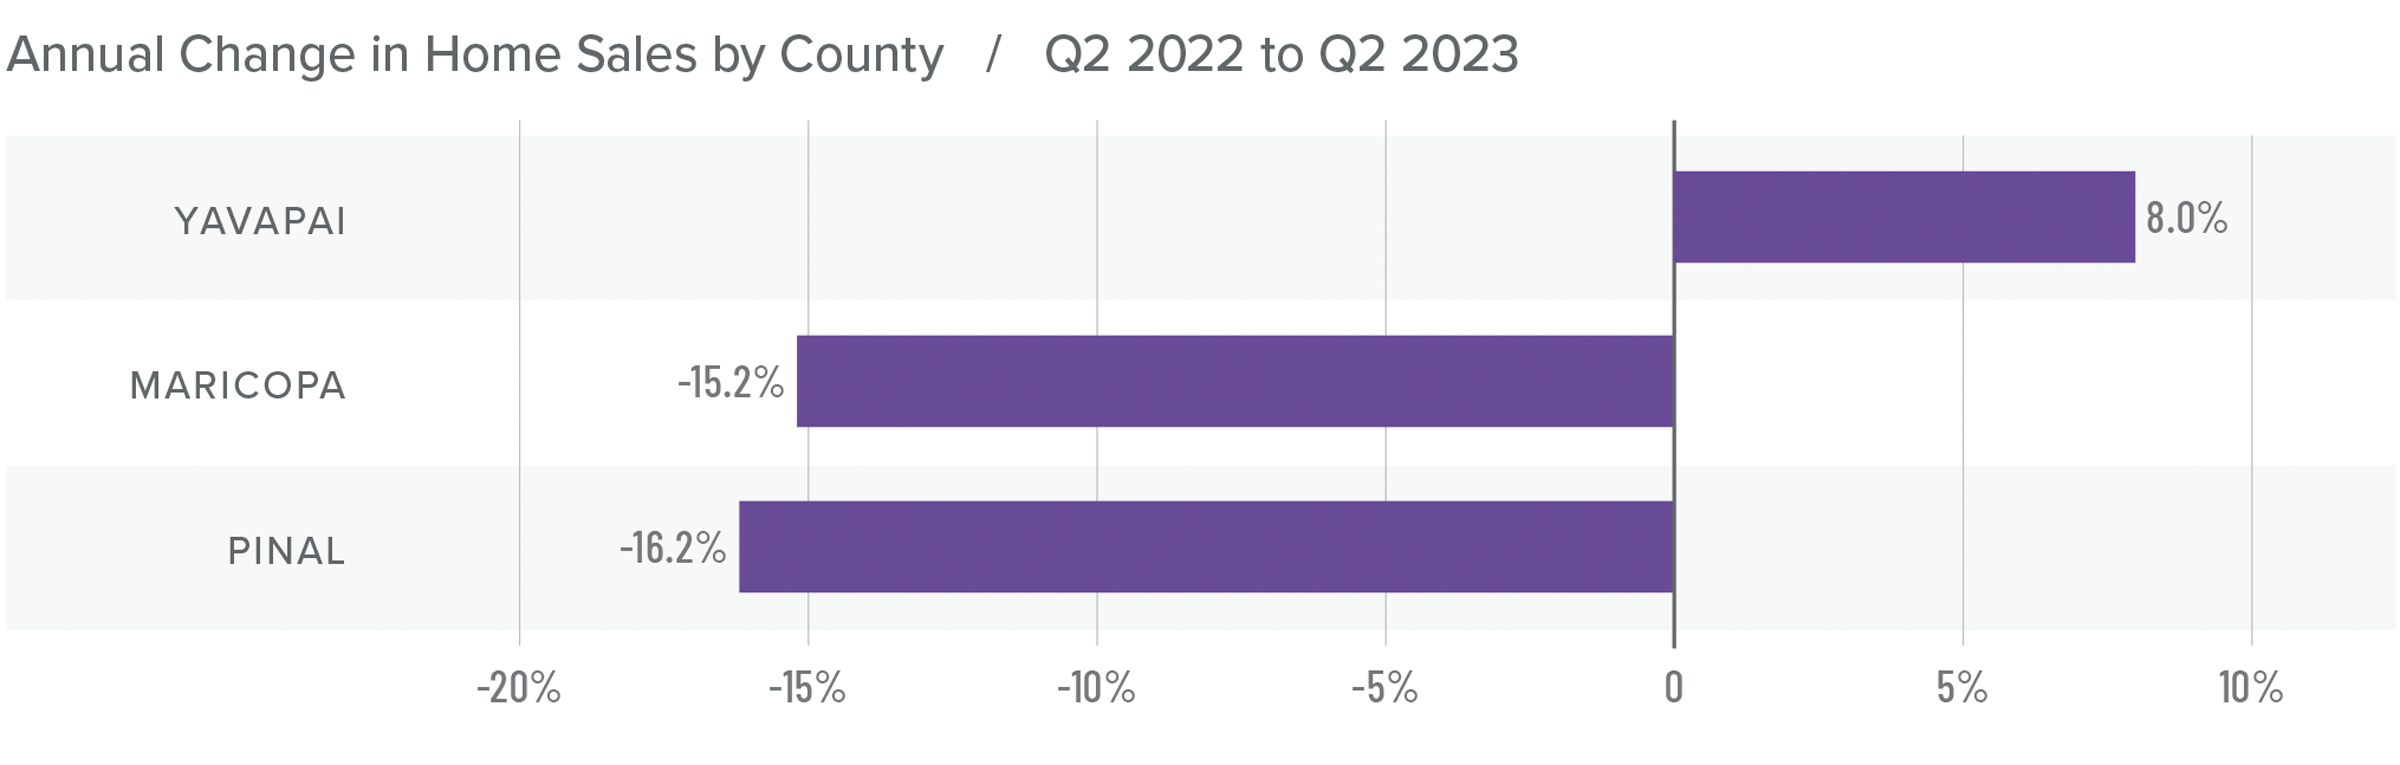
Arizona Home Sales
❱ In the second quarter of 2023, 18,658 homes sold. This was down 15.1% from the second quarter of 2022, but up a very impressive 24.6% compared to the first quarter of this year.
❱ The growth in quarter-over-quarter sales was more impressive given that average inventory levels in the quarter fell 23.4%.
❱ Sales fell in Maricopa and Pinal counties year over year. However, sales managed to rise 8% in the Prescott market. Compared to the first quarter of this year, sales rose substantially in all three counties. Pinal County led the charge as sales rose 37.1%.
❱ Pending sales rose in Pinal and Yavapai counties but fell in the larger Maricopa County market. This suggests that it might be a challenge to maintain this level of growth into the third quarter of the year.
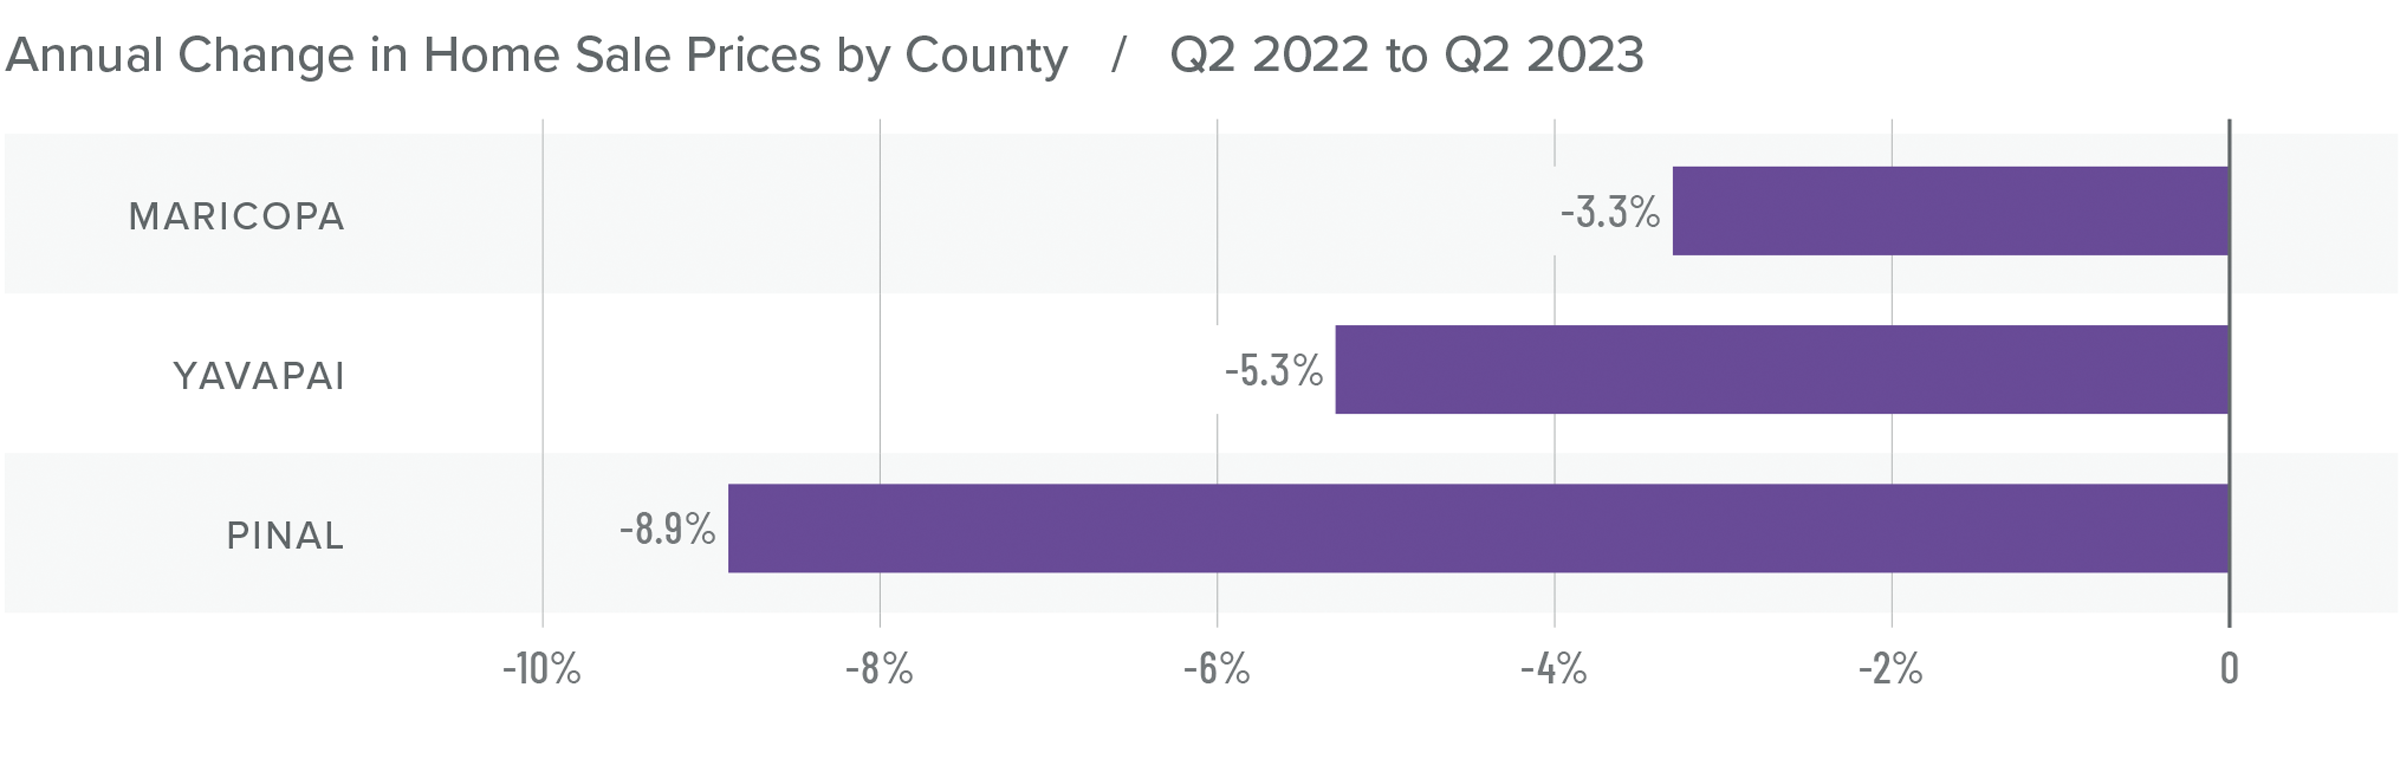
Arizona Home Prices
❱ Sale prices fell an average of 3.8% compared to the second quarter of 2022 but were 7.8% higher than in the first quarter of 2023. The average home sale price was $609,602.
❱ Compared to the first quarter of this year, prices were higher in all counties. Maricopa County saw particularly strong gains, with prices rising an average of 8.6%.
❱ The year-over-year drop in prices was not surprising given that the market was peaking in the second quarter of 2022 due to rapidly rising mortgage rates.
❱ It was interesting to see list prices rise in all markets compared to the first quarter of the year. Tight inventory levels have sellers feeling confident even in the face of significantly higher mortgage rates.
Mortgage Rates
Although they were less erratic than the first quarter, mortgage rates unfortunately trended higher and ended the quarter above 7%. This was due to the short debt ceiling impasse, as well as several economic datasets that suggested the U.S. economy was not slowing at the speed required by the Federal Reserve.
While the June employment report showed fewer jobs created than earlier in the year, as well as downward revisions to prior gains, inflation has not sufficiently slowed. Until it does, rates cannot start to trend consistently lower. With the economy not slowing as fast as expected, I have adjusted my forecast: Rates will hold at current levels in third quarter and then start to trend lower through the fall. Although there are sure to be occasional spikes, my model now shows the 30-year fixed rate breaking below 6% next spring.
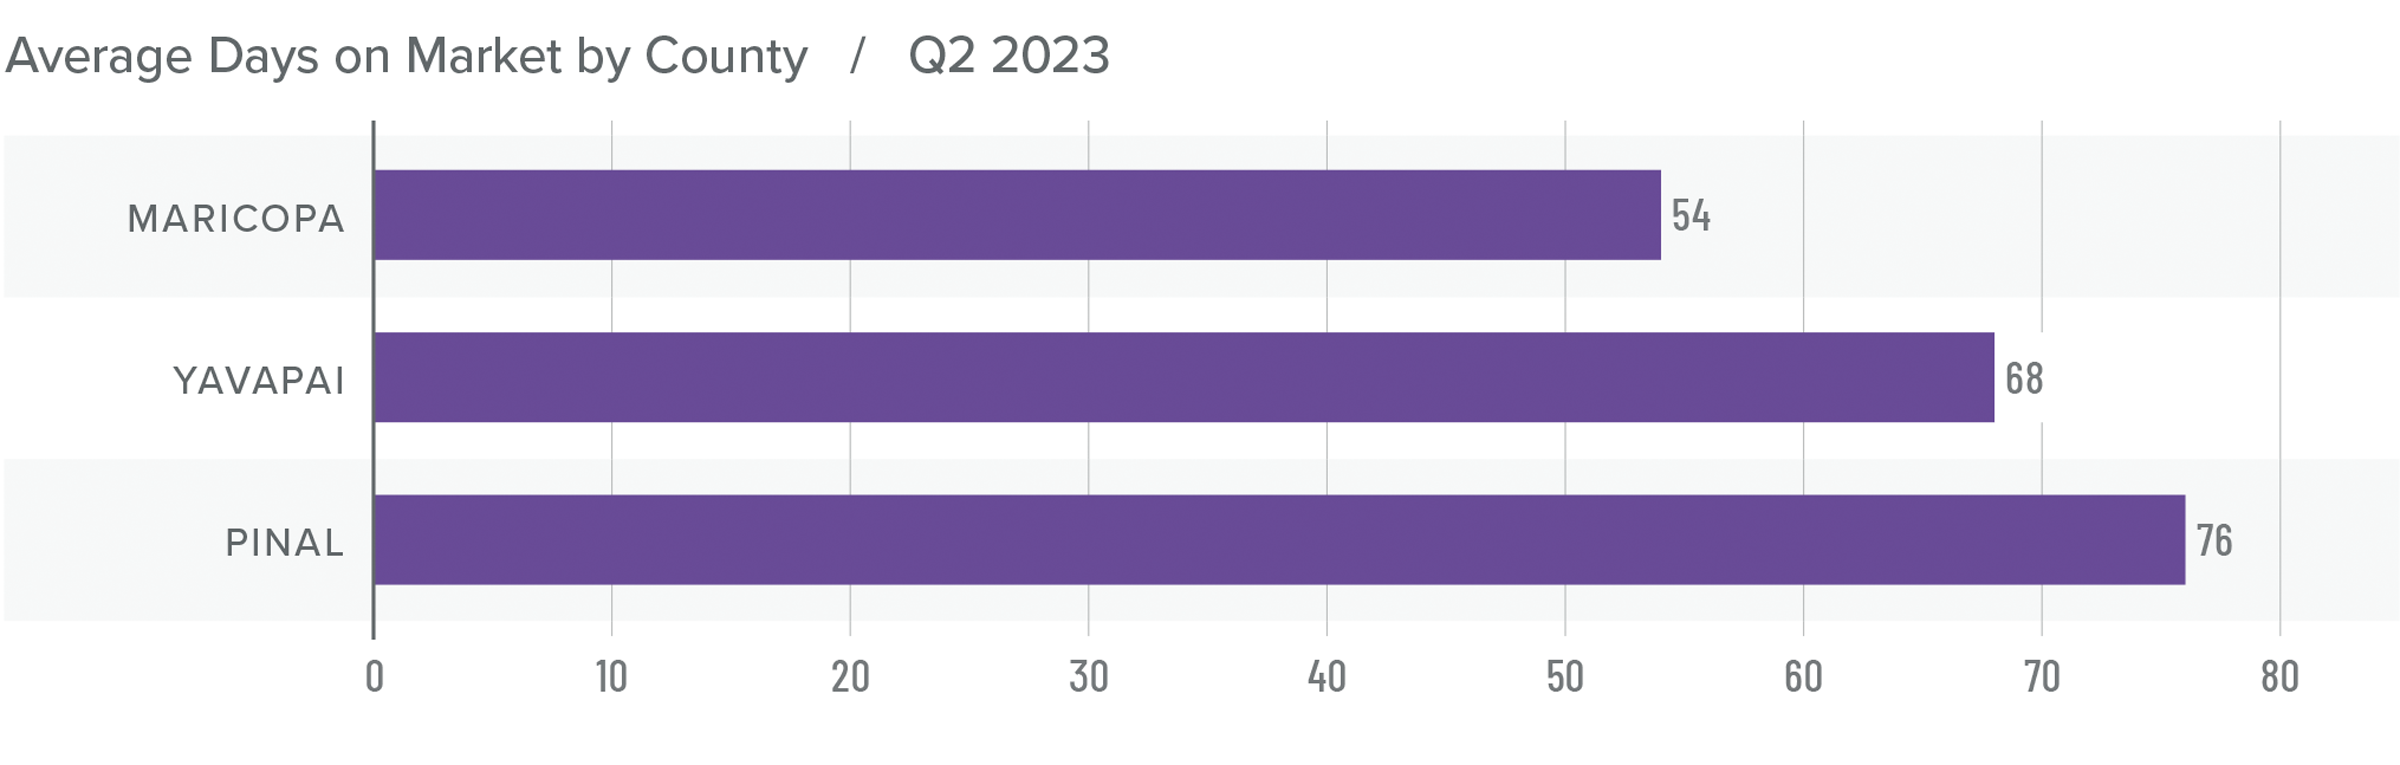
Arizona Days on Market
❱ It took an average of 66 days for a home to sell in the second quarter. This was 40 more days than in the same quarter of 2022, but 5 fewer days than in the first quarter of this year.
❱ Maricopa County was the tightest market in the region, with homes taking an average of 54 days to sell. Homes in Pinal County took the longest time to sell, at 76 days.
❱ All counties contained in this report saw average days on market rise from the same period in 2022. Compared to the first quarter of 2023, market time fell in Maricopa and Pinal counties and rose by two days in Yavapai County.
❱ The greatest fall in market time compared to the first quarter was in Maricopa County, where days on market fell 13 days.
Conclusions
This speedometer reflects the state of the region’s real estate market using housing inventory, price gains, home sales, interest rates, and larger economic factors.
Even with mortgage rates well above levels we’ve seen over the past few years, demand for homes still exceeds supply. Given that almost 84% of homeowners with mortgages have an interest rate below 5% and almost a quarter have rates at or below 3%, there is little incentive for them to sell if they don’t have to. This suggests that supply levels are unlikely to improve to a level that meets demand until rates drop significantly. With this supply-demand imbalance, it’s not surprising that home prices are rising again following the decline in the second half of 2022. I expect this trend to continue through the second half of the year.
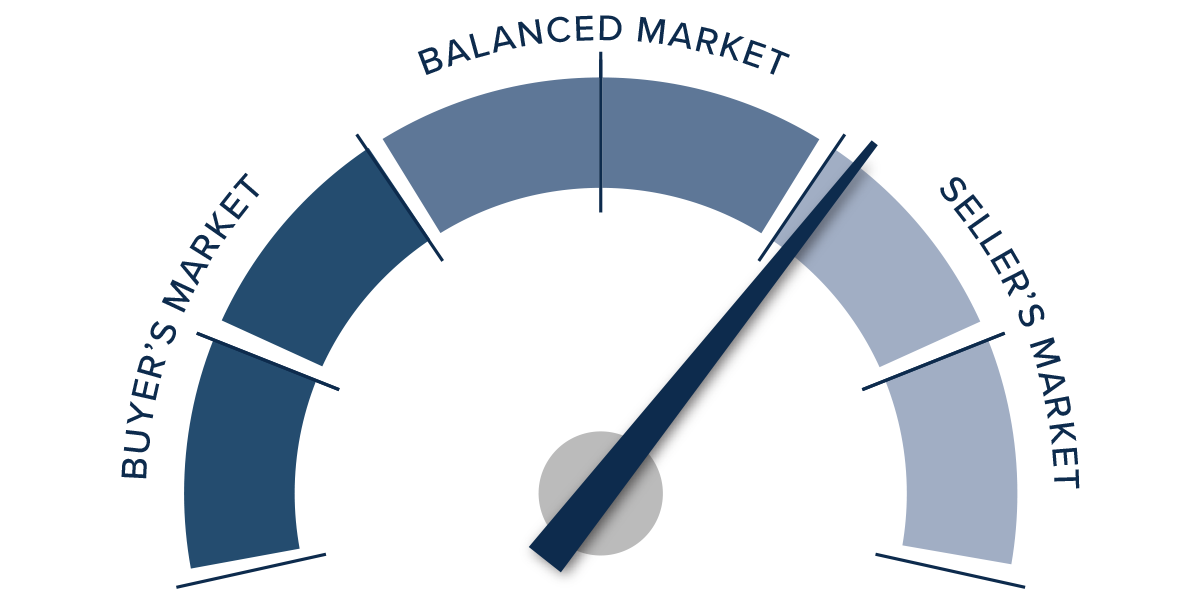
For the time being, rising list and sale prices, shorter time-on-market, and higher pending and closed sales appear to be offsetting higher mortgage rates. Given these factors, I have moved the needle in favor of sellers. However, it will be interesting to see what the market looks like after the summer lull.
About Matthew Gardner

As Chief Economist for Windermere Real Estate, Matthew Gardner is responsible for analyzing and interpreting economic data and its impact on the real estate market on both a local and national level. Matthew has over 30 years of professional experience both in the U.S. and U.K.
In addition to his day-to-day responsibilities, Matthew sits on the Washington State Governors Council of Economic Advisors; chairs the Board of Trustees at the Washington Center for Real Estate Research at the University of Washington; and is an Advisory Board Member at the Runstad Center for Real Estate Studies at the University of Washington where he also lectures in real estate economics.
")


