
 Facebook
 X
X
 Pinterest
 Copy Link

Hello there and welcome to the first Mondays with Matthew for 2021. It’s great to be back and I hope that you all had a fantastic holiday season and are getting into the new year groove.
Well, there’s a lot of data releases to talk about today so let’s get to it. First up is the latest National Association of Homebuilders report on builder confidence.
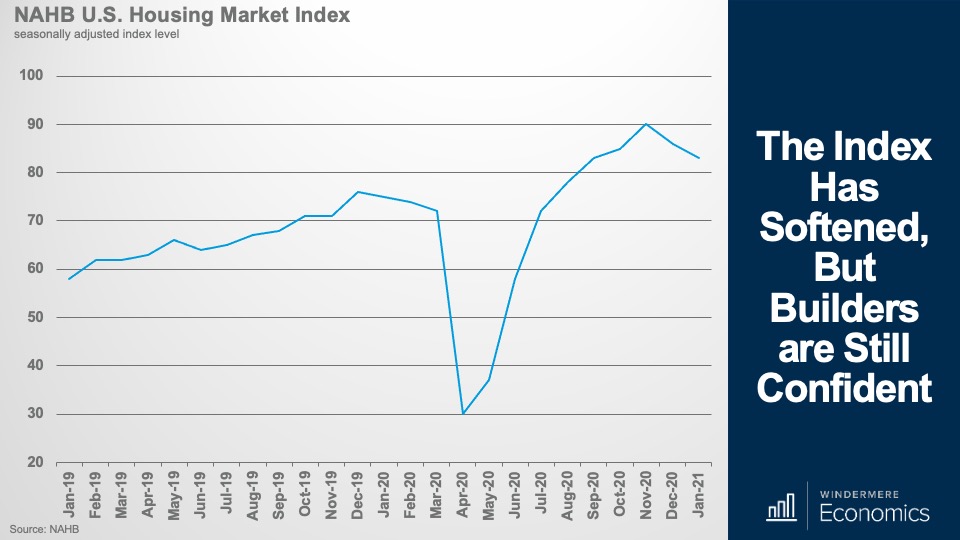
The index slipped to 83 from 86 but, for context, any reading above 50 means more builders view market conditions as favorable than poor.
Now, as you can see, following a very impressive recovery following the start of the pandemic, U.S. homebuilder confidence has trended lower for the past 2-months but, to tell you the truth, I really wasn’t surprised to see this.
Why wasn’t I surprised?
Well, its actually rather simple. Surging COVID-19 infections in concert with increasing material costs offset record low mortgage rates.
Builders are still grappling with supply-side constraints related to not just material costs, but a lack of affordable lots on which to build, and labor shortages that are all putting upward pressure on new home prices.
It’s very frustrating for builders these days as they see very significant demand for housing – driven by cheaper mortgages as well as an exodus from city centers to the suburbs and other low-density areas as companies allow employees to work from home because of the pandemic.
Oh! Talking of work-from-home, I did see a number put out by the Census Bureau in their Household Pulse Survey that suggested that about 38% of the labor force is now working at least part-time from home. That’s a massive number.
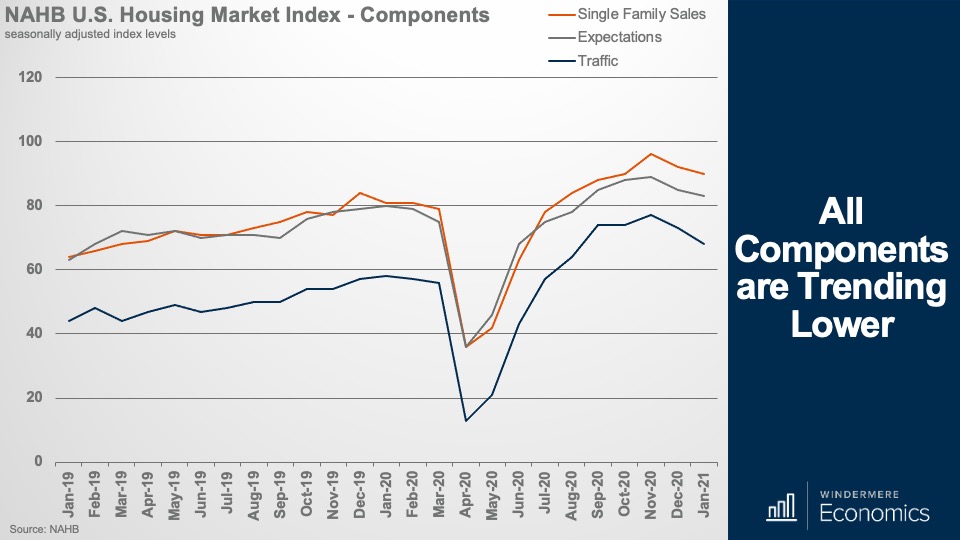
Anyway, all of the component parts of the survey trended lower with the measure of sales expectations in the next six months falling two points to 83, the gauge of current sales conditions also dropping two points to 90, and the prospective buyers index falling by five points to 68.
I am not worried by this as, even at these levels, builders are still pretty bullish about the market, and I say this because of the next dataset I’m going to talk about – the housing permit and starts report.
Even if builders were suffering from worries regarding costs. Oh! I should add that their biggest issue as far as material costs are concerned are that lumber prices have risen by 52% versus a year ago! Anyway, this increase in cost, as well as the other issues that we have just talked about didn’t translate into slowing activity when it came to permits and starts which both surged in December.
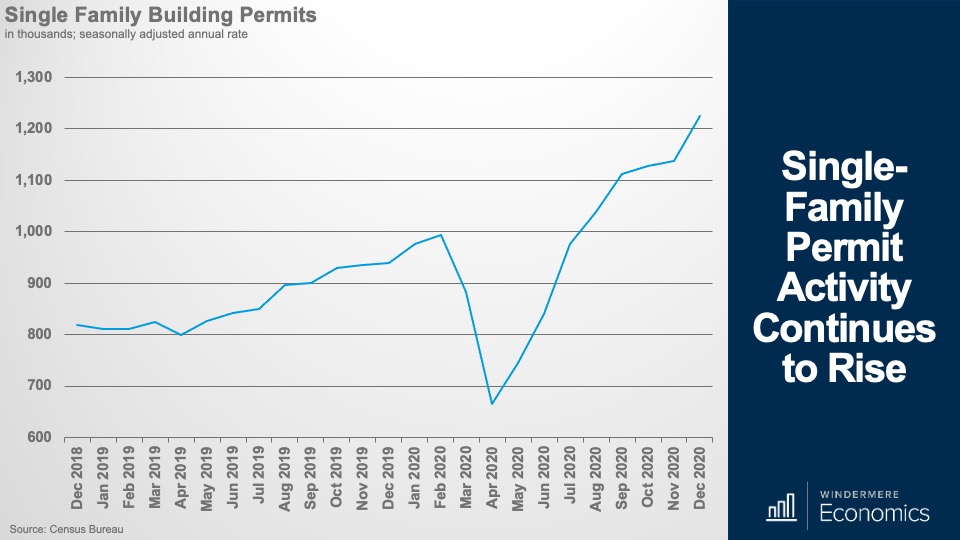
This chart shows the number of single-family permits issued across the country and the figure rose by 7.8% between November and December to an annual rate of 1.226 million units. That’s 30.4% higher than seen a year ago. And the fastest rate seen since 2007.
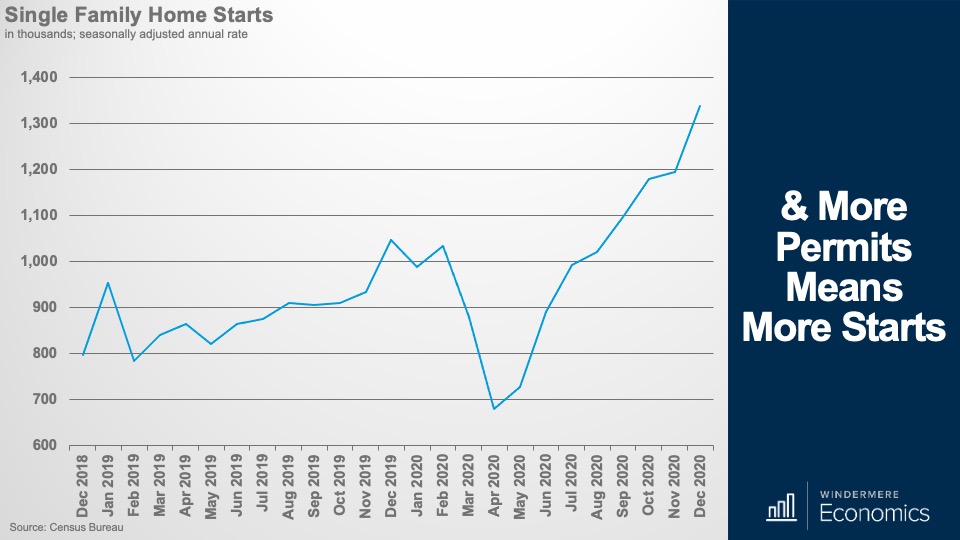
And looking now at housing starts, well they impressed too with a 12% month over month gain to an annual rate of 1.338 million units – and that’s 27.8% higher than a year ago.
I would also note that single-family starts have increased for eight straight months now. And – given the data that we have just looked at – it’s not surprising to see a very significant jump in the number of homes under construction.
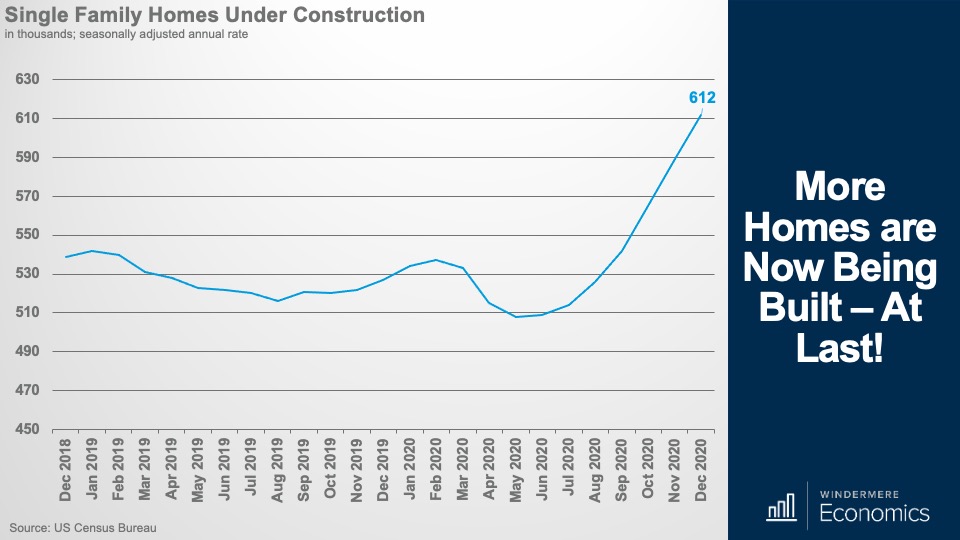
Now, in case you are a little confused by terminology, I should let you know that housing starts don’t actually relate to the number of homes being built. Starts refer to lots where a foundation has been poured, but it doesn’t mean that vertical construction has commenced. For that we need to look at the under-construction data shown here.
And the number is pleasing. In fact, the current level of ground-up construction is at its highest level since 2007.
The bottom line is that I expect to see the number of starts and homes under construction continue to rise, and new supply of homes is likely to take some of the upward price pressures off the resale market.
In fact, my current forecast is for new home sales to rise this year to about 988,000 units.
And talking of the resale market, I know that you have all been waiting for the December existing home sales numbers and they were released last Friday.
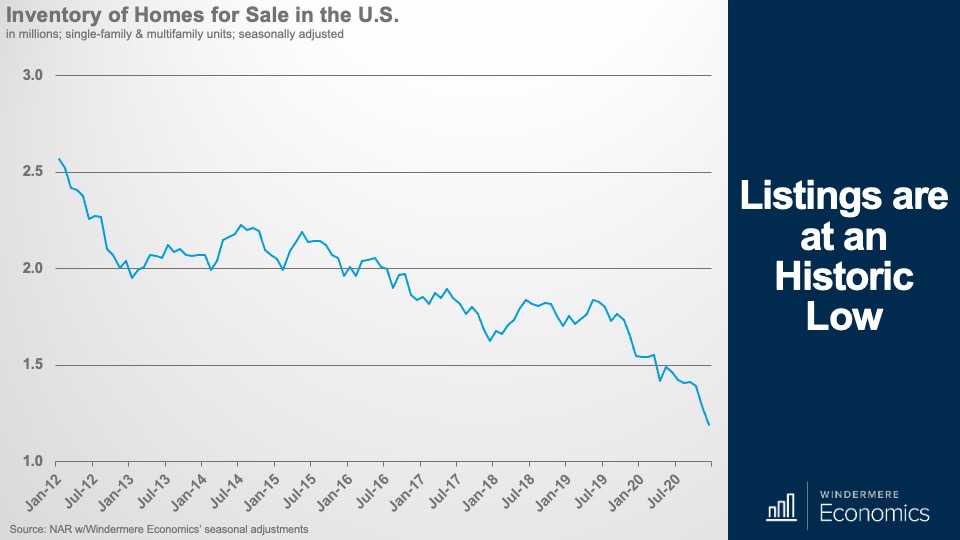
Before we get to the good stuff, I want to start with inventory – or lack of it!
Without seasonal adjustment, the number of homes for sale in December stood at just 1.07 million homes – and that’s down 23% year over year.
For perspective, that is the lowest number of homes on record and, at the current sales place, that represents a 1.9-month supply and that’s the lowest number seen since the National Association of Realtors began tracking this metric back in 1982.
So – we know that there is nothing to buy, but what’s happening to sales?
Look at this! Pandemic-driven demand for housing sent total 2020 home sales to the highest level since 2006.
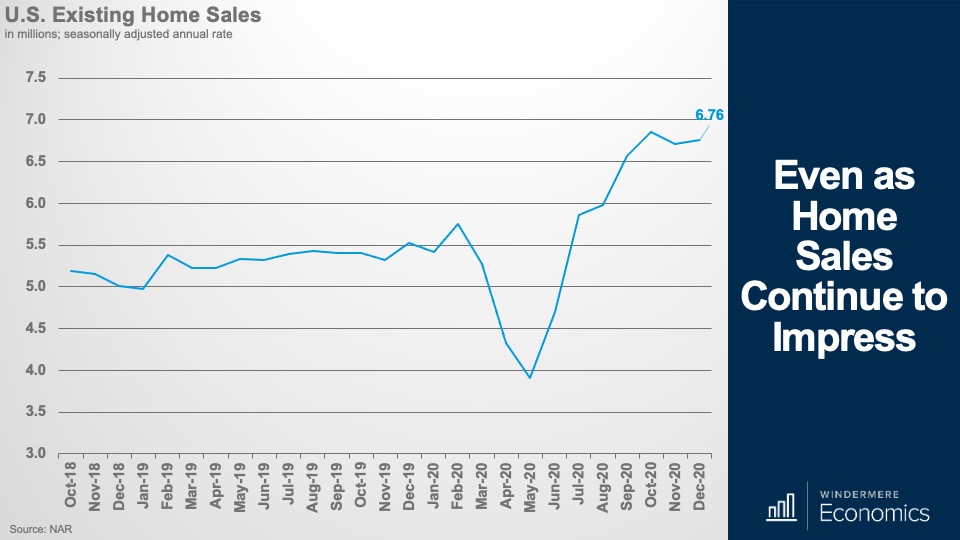
Closed sales of existing homes in December increased just 0.7% from November to a seasonally adjusted annualized rate of 6.76 million units and sales were 22% higher than seen in December of 2019.
As unexpected as a global pandemic was, so too was the reaction of homebuyers. After plummeting in March and April, sales suddenly began to climb.
Total year-end sales volume ended at 5.64 million units, and that was a number far higher than I – or anyone – was predicting before the pandemic started.
COVID-19 drove buyers desire for larger, suburban homes with dedicated spaces not just for working but for schooling as well.
And I will tell you that, in my opinion, sales could have been even higher if there were just more homes to buy! I wouldn’t have been surprised, again, if we had no inventory constraints – to have seen over 7 million sales occurring last year and that would have matched the all-time high seen in 2005.
But of course, there is a price to pay when you have so much demand, and so little supply.
That’s right. Prices go up!
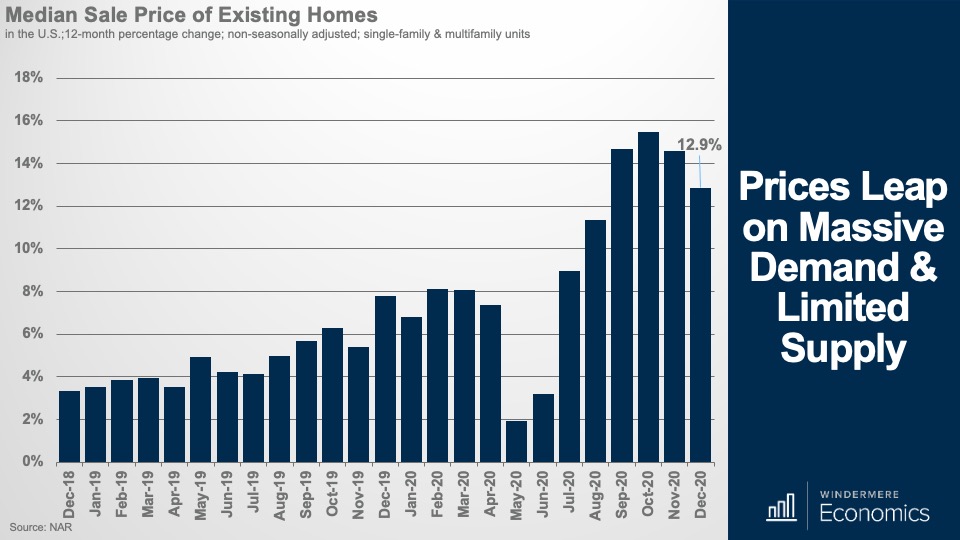
Low supply and very strong demand continued to heat home prices with the median price of an existing home sold in December coming in at $309,800, that’s a 12.9% increase when compared with December 2019 and the highest December median price on record. I would also add that this price is only marginally below the all-time high that was seen last October.
The surge in prices really has been quite remarkable, but I am not too surprised. Yes, demand has risen significantly, and supply has not, but much of the growth was driven by mortgage rates that have dropped precipitously since the pandemic started and are over a full percentage point lower now than they were a year ago.
I would add that part of the reason we say such a sharp increase in price is that home sales were actually very strong at the high end of the market, where there are more homes for sale.
Sales of homes in the US priced below $100,000 were down 15% annually in December, while sales of homes priced between $500,000 and $750,000 were up 65% year over year, and sales of million-dollar-plus homes were up by a whopping 94% from a year ago.
A lot of the growth in the luxury market can also be attributed to mortgage rates with jumbo rates – that spiked with the pandemic – dropping significantly and this has led sales higher.
Breaking out the single-family market from condos, sales leapt in the early summer but leveled off in the fall because of – you guessed it – a lack of homes for sale and not a lack of demand.
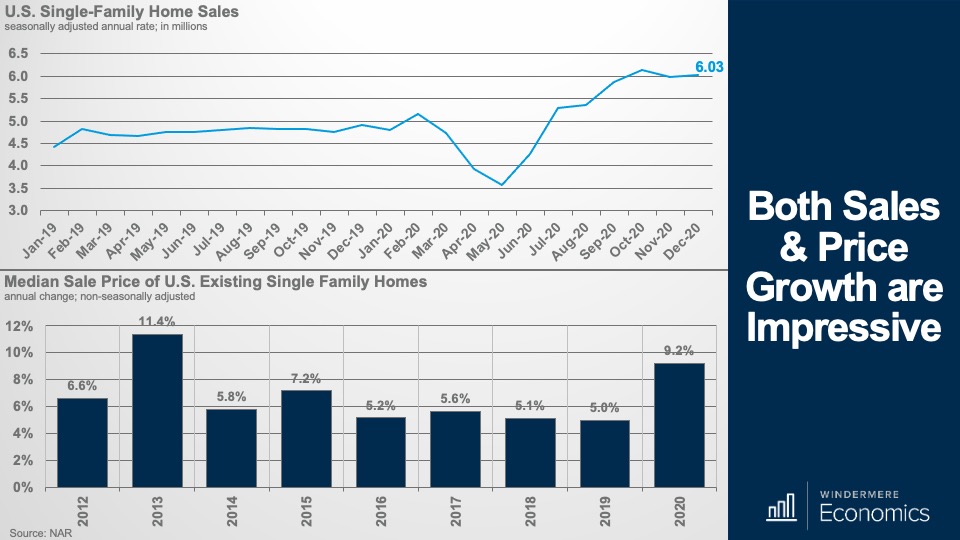
In 2020, sales of single-family homes rose by 6.3% – a massive number that’s even more impressive given the fact that sales only rose by 0.5% in 2019.
And prices were, naturally on the rise too – increasing by 9.2% last year, and that’s the fastest rate we have seen since 2013, and that was when we were starting to recover from the housing bubble that burst causing home prices to collapse value buyers jumped in causing prices to rise significantly.
Looking now at condos, we see a somewhat similar picture with the annual rate of sales coming in at over 700,000 units but, interestingly, 2020 total condo sales were actually 0.3% lower than we saw in 2019.
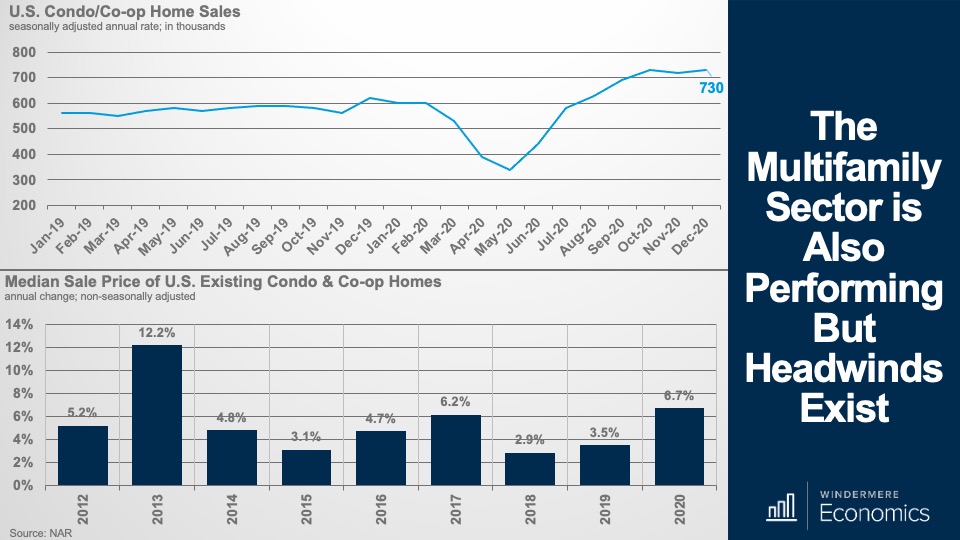
What is happening here is a drop in demand for urban multifamily units with buyers able to work remotely. And this is also reflected by lower price growth than we saw in the single-family market.
As we move forward, I am still positive about the multifamily arena, but we are already seeing softening in demand and price in some market across the nation and here I am directly referring to San Francisco here in the West, and New York and Boston back East.
In as much as we will continuing to see short-term demand and price issues in many urban markets, it doesn’t mean that the overall condo market is going to collapse.
In fact, I think that once we get back to “normal” we may well see demand increase again and, if we see prices start to drop, I expect demand to rise even further as buyers who had previously been priced out of many of these large cities see that they can now afford to buy.
So, there you have it. My take on the January housing related data releases.
As always, if you have any questions or comments about the topics I have discussed today, feel free to reach out – I am only an e-mail away!
In the meantime, thank you for watching, stay safe out there, and I look forward to visiting with you again, next month.
Bye now.
")


