
 Facebook
 X
X
 Pinterest
 Copy Link
Numbers to Know 6/18/26: The Market’s Latest Plot Twist

Hi, I’m Jeff Tucker, principal economist at Windermere Real Estate, and these are the numbers to know, right now.
The first number to know this month: $78.
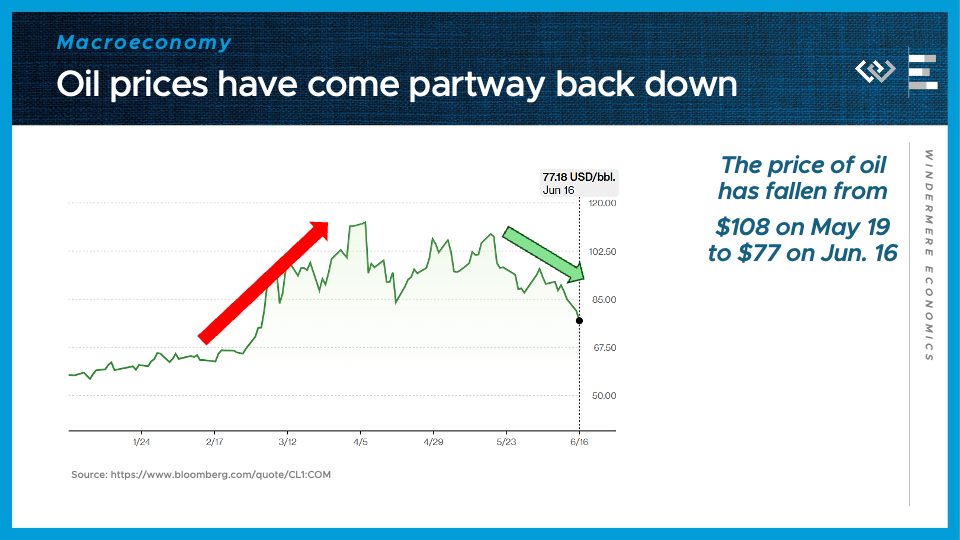
That is the current price of a barrel of oil as of June 16, after falling about $30 in just the last month. Much of that decline follows from the signed memorandum of understanding between the US and Iran, hopefully marking the beginning of the end of the war that has closed the straits of Hormuz.
The second number to know this month: 4.2%.
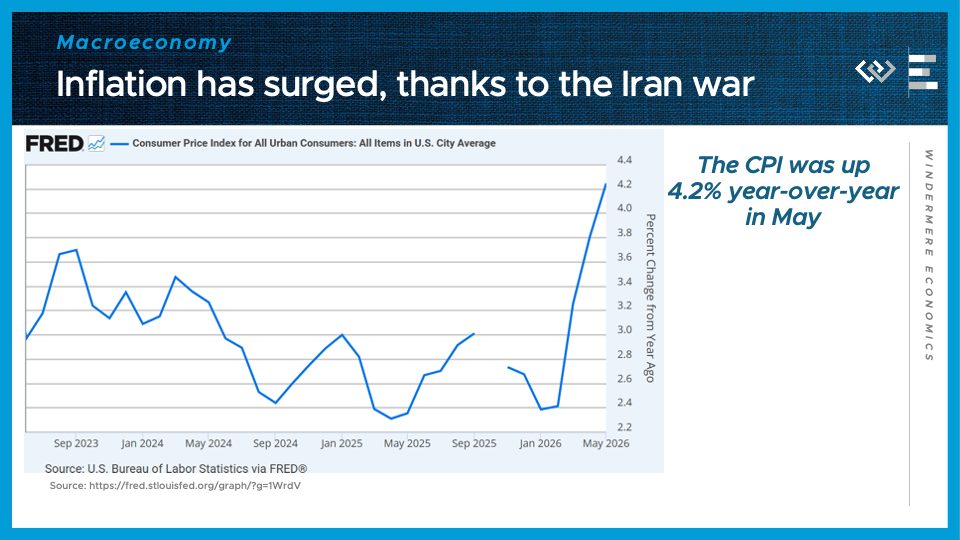
That is the current year-over-year pace of inflation as of May, and it’s the highest annual rate of inflation in over 3 years. It reflects the cost pressures from the Iran War disruptions still rippling out through the economy.
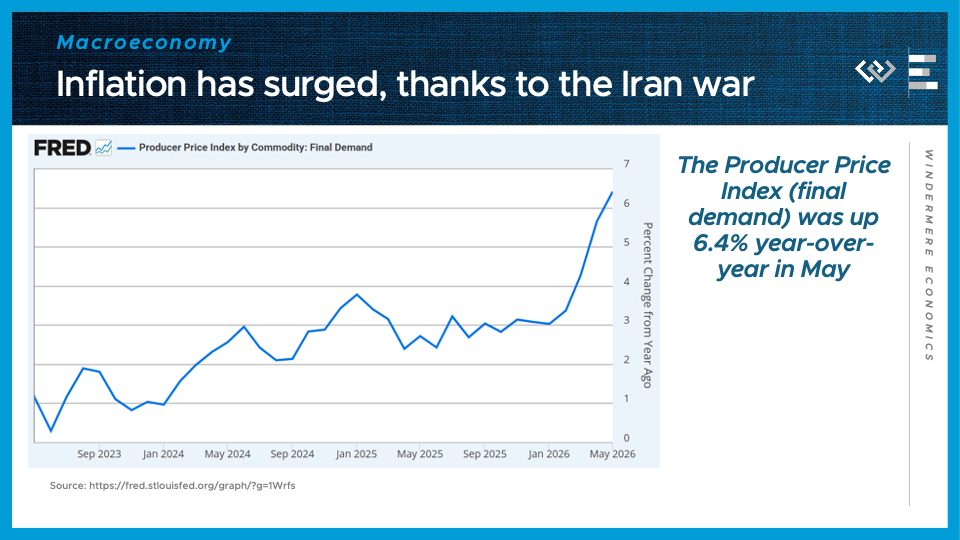
The Producer Price Index, which measures cost pressures further upstream in the supply chain, also continued accelerating in May, to 6.2%. Hopefully, this should begin to decelerate as lower oil prices bring down costs in the economy.
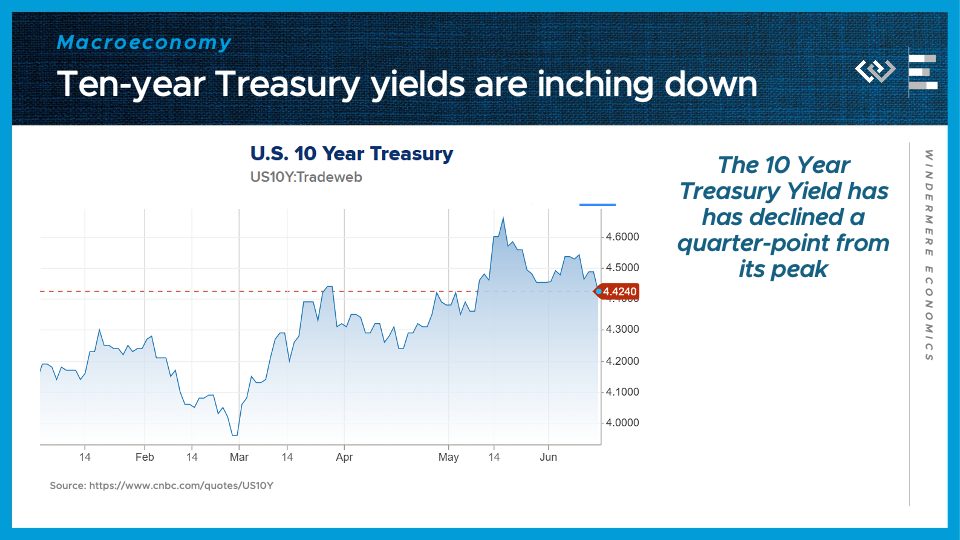
Bond yields are still elevated but they’ve begun to decline – the Ten-year Treasury yield has come back down about a quarter point from its peak in mid-May.
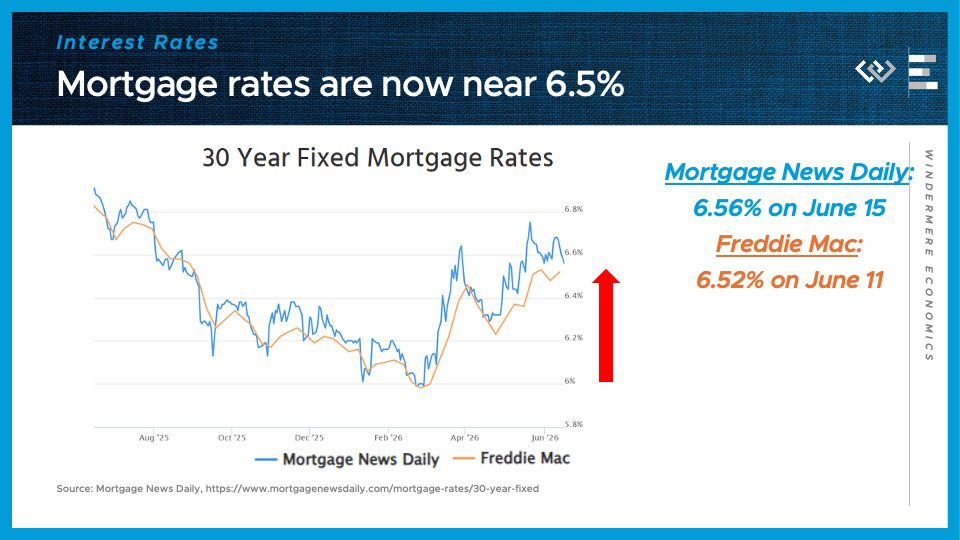
Similarly, 30-year mortgage rates are starting to come back down, but remain much higher than earlier this year: both Mortgage News Daily and Freddie Mac report average mortgage rates slightly above 6 and a half percent.
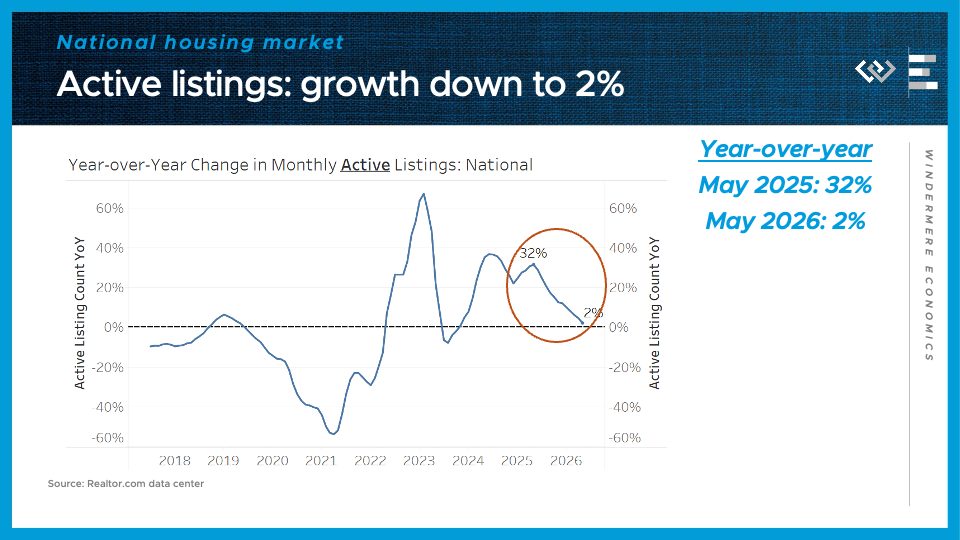
Speaking of the housing market, inventory growth slowed down again in May, which ended with just 2% more active listings than this time last year.
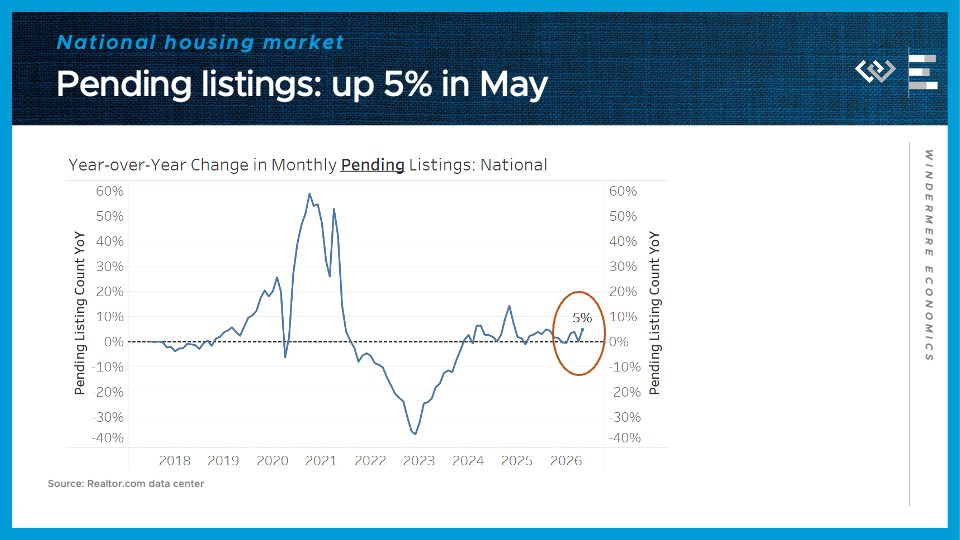
And most surprisingly, pending sales in May were up 5% year-over-year, according to Realtor.com, which marks a belated pickup in demand to close out the spring selling season on a higher note.
If mortgage rates continue to come back down, that strength in sales activity could continue into the summer.
Local Look Western Washington Housing Update 6/4/26

Hi. I’m Jeff Tucker, principal economist at Windermere Real Estate, and this is a Local Look at the May 2026 data from the Northwest MLS.
As we approach the end of the spring selling season, we can now say it was a bit disappointing for sellers. On the flipside, that means this summer will likely provide some bargains for buyers who are in a position to act.
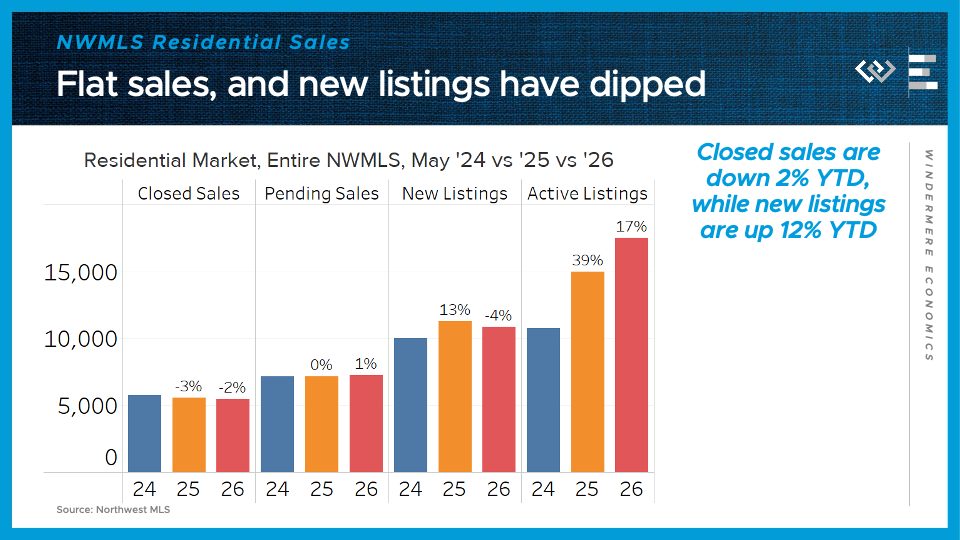
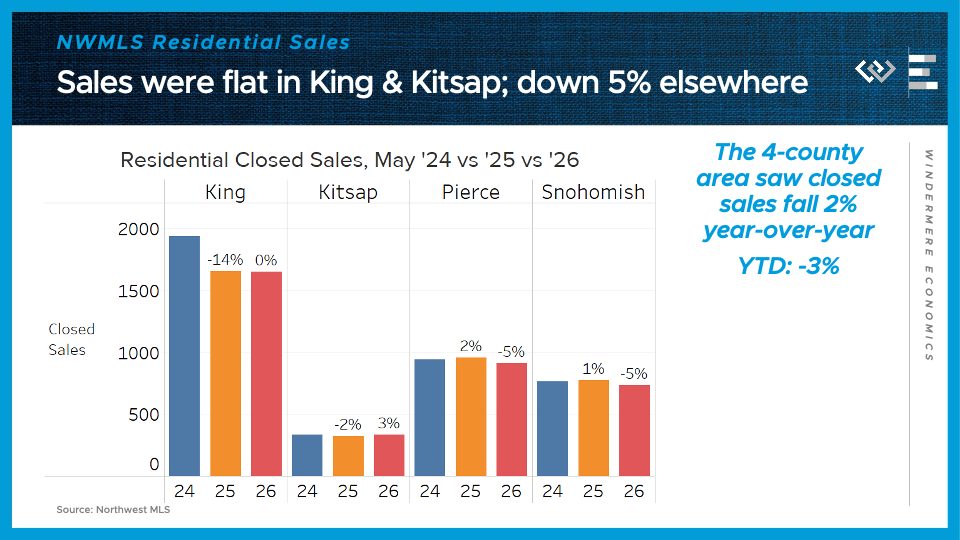
Across the entire Northwest MLS, there were 2% fewer closed sales in May 2026 than in May of last year – the same drop we saw in April. Pending home sales ticked up by 1% from last year.
The big news in this month’s release was on the supply side, where the flow of new listings was 4% less than in May of 2025 – that’s the first slowdown in new listings all year. Finally, the month ended with just over 17,500 active listings around the MLS, or 17% more than last May, after it was up 30% in April. That tells me sellers have picked up on the softer demand signals this spring and they’ve begun to pull back. That’ll be an important trend to track in the months ahead to see if it continues.
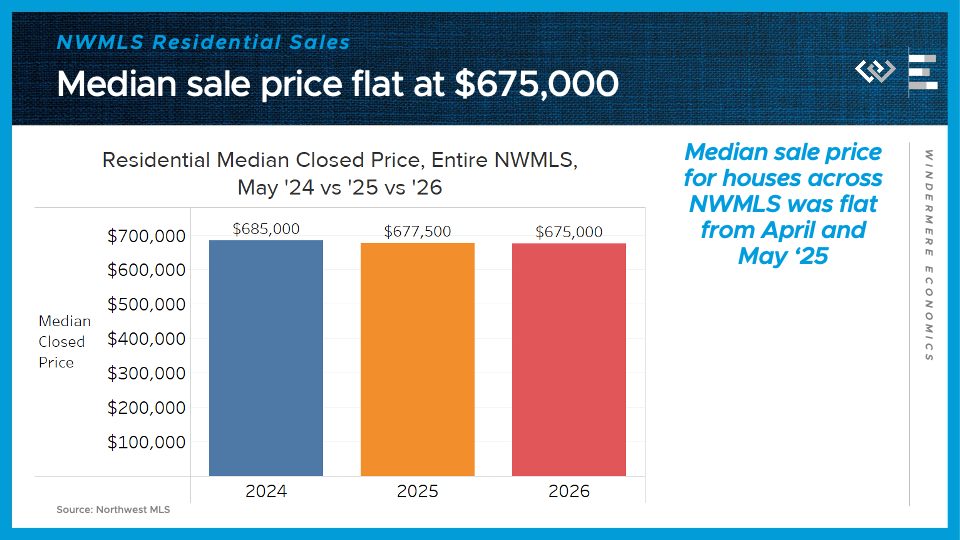
The median sale price ticked down from last May, by just $2500, leaving it basically flat at $675,000.
Now I’ll take a closer look at the four counties encompassing the greater Seattle area.
Closed sales declined by 2%, or about 80 homes, from last May around the region. Snohomish and Pierce Counties led that decline by 5% each, while King County was flat and Kitsap saw sales pick up a bit. Still, that left King County well below 2024’s sales volume.
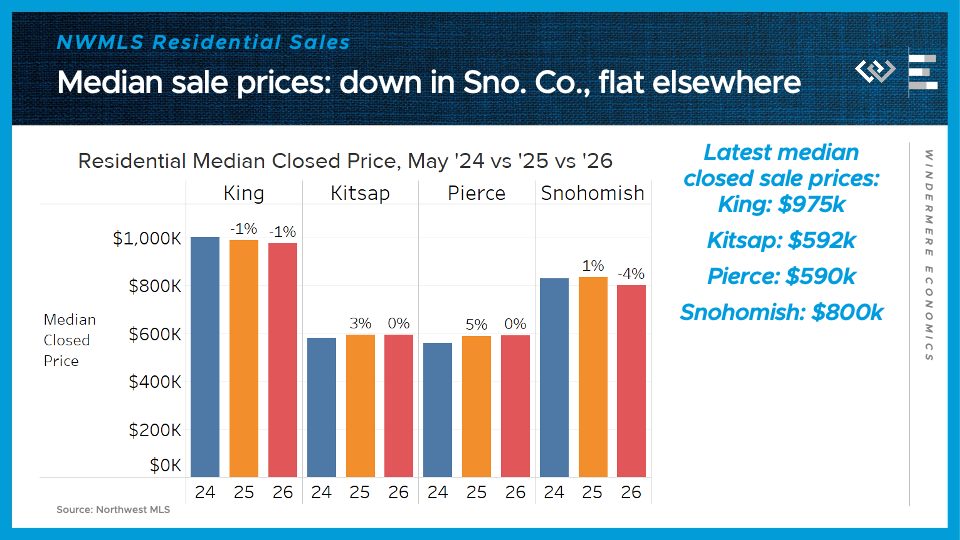
Median sale prices were flat, or down slightly, all around the region – down the most, by 4%, in Snohomish County to $800,000, while they’ve inched down to $975,000 here in King County.
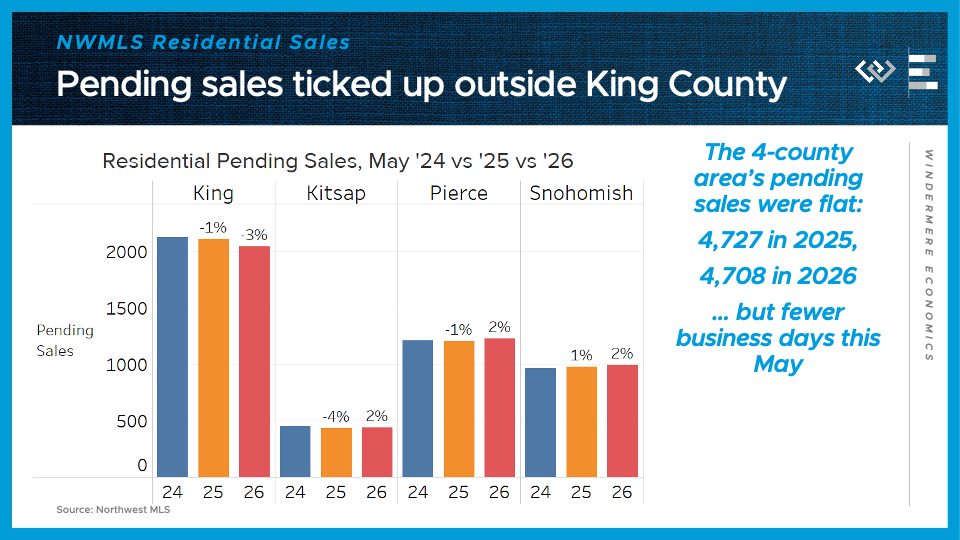
Looking ahead, pending sales were flat around the region, with a drop of 3% in King County. That’s a little ambiguous, though, because this May did end on a Sunday, when pending sales are rarely recorded. For that reason I expect a little pickup in pending sales in June.
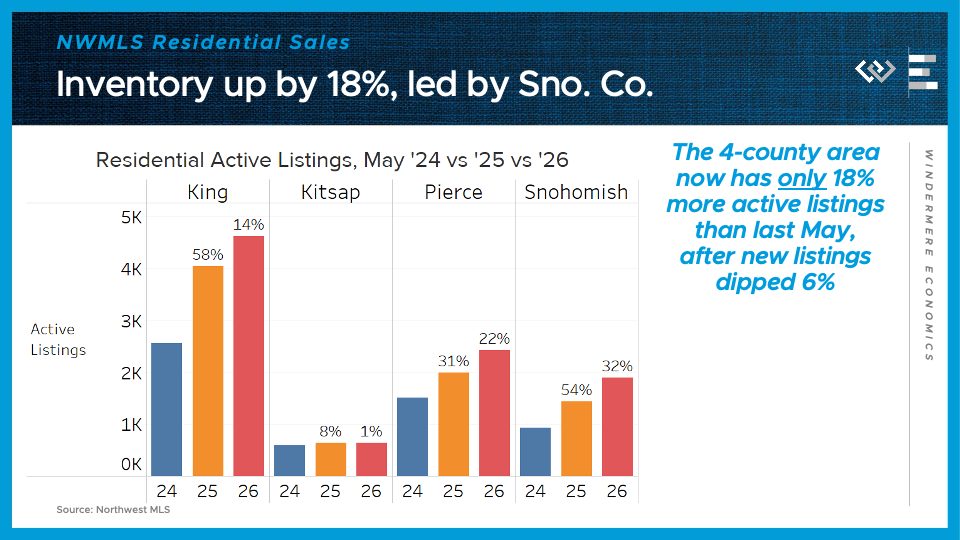
On the supply side, the 4-county greater Seattle area ended the month with only 18% more active listings than last May, a sharp slowdown from the 37% growth in April. Every county saw a sharp slowdown in the growth of active listings, which could mark an inflection point in this cycle.
All in all, the local housing data painted a picture of an unusually buyer-friendly spring selling season this May here in the greater Seattle area, as prices cool down slightly and sales activity falls short of last year’s. Now we are approaching the time of year with peak inventory, and near-peak buying activity, so I still expect plenty of time for more buyers to find the right home, amid a slightly less frenzied setting. If geopolitical news improves and mortgage rates come back down toward 6%, the market could even catch a second wind; but in the meantime, the data suggests that sellers benefit now more than ever from a professional, polished listing when they go to sell their house in this quiet late spring market.
Numbers to Know 5/21/26: The Forces Impacting Today’s Housing Market

Hi, I’m Jeff Tucker, principal economist at Windermere Real Estate, and these are the numbers to know, right now.
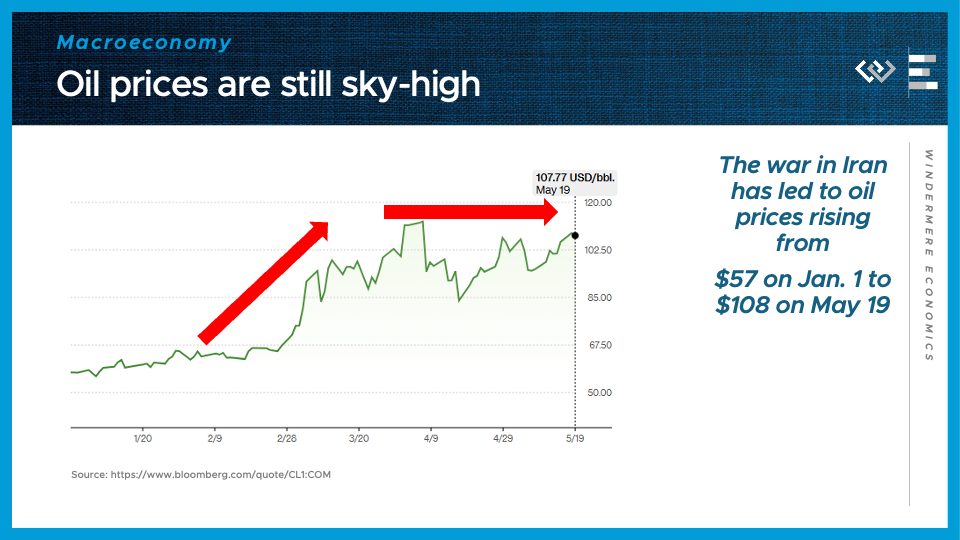
The first number to know this month: $108. That is the current price of a barrel of oil as of May 19, and it is still dramatically elevated from its price range below $60 before the U.S. launched a war on Iran this year. In fact, despite several tantalizing hints of the end of the hostilities tying up the Strait of Hormuz, prices have been over $85 a barrel pretty consistently for over two months now. As long as the flow of oil is constricted, those price pressures will stay elevated.
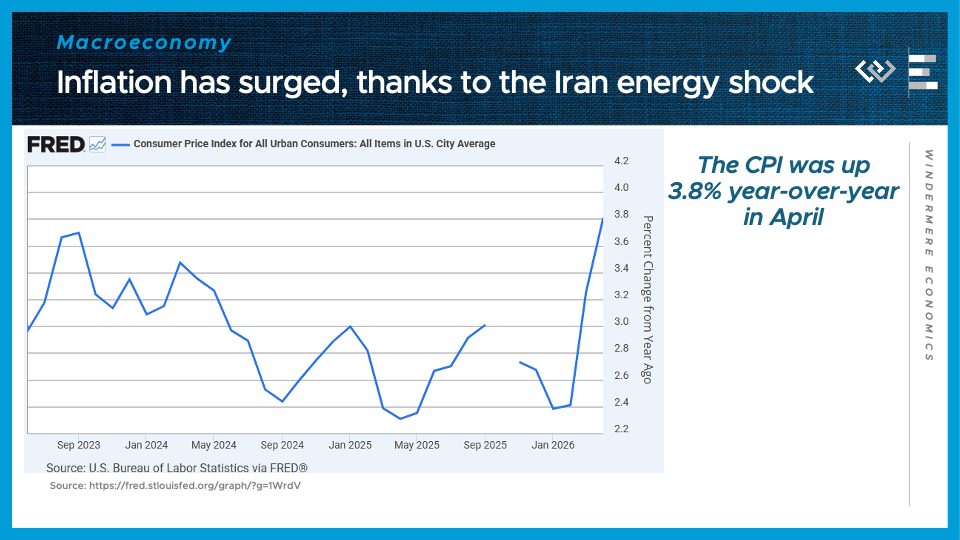
The second number to know this month: 3.8%. That is the year-over-year change in the consumer price index, representing a sharp acceleration of inflation from the 2.4% pace as recently as February. It reflects the higher costs of energy rippling through supply chains, and now inevitably raising prices for consumer products and services.
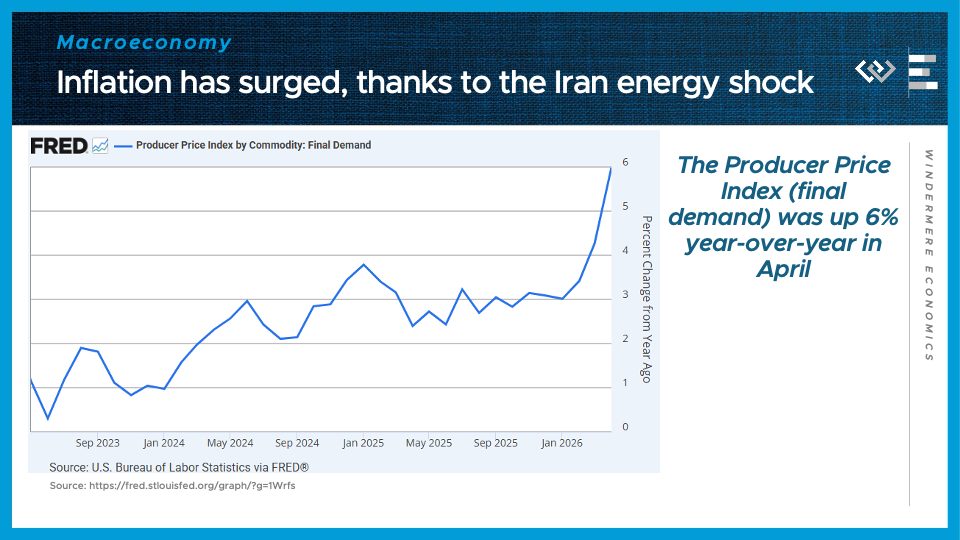
Moreover, the producer price index also just jumped sharply, to a 6% year-over-year gain, well above the consensus forecast, which is a good indicator of even more pain coming for consumers.
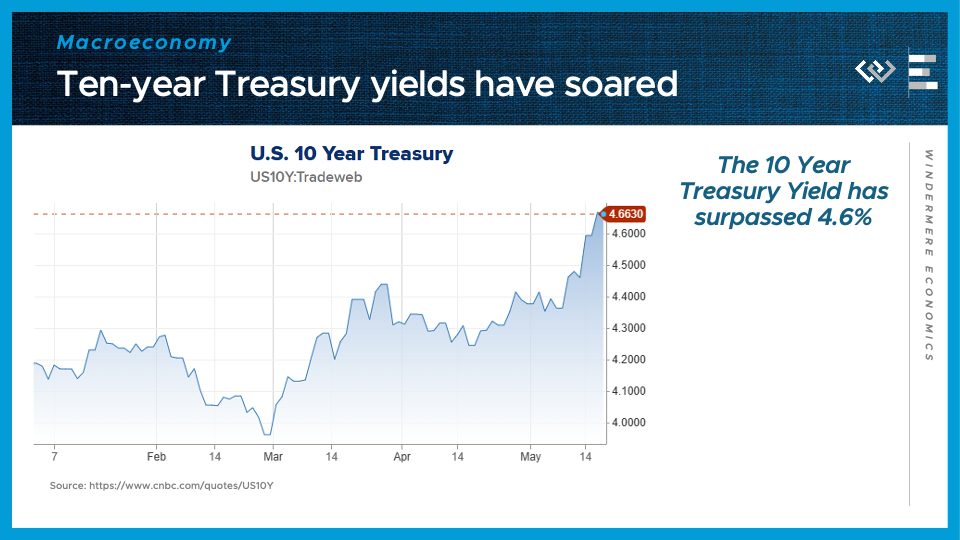
Higher inflation also tends to feed into the interest rates on bonds, and this spring has been no exception: now the ten-year Treasury bond is yielding around 4.6%, after dipping just under 4% on the eve of the Iran war.
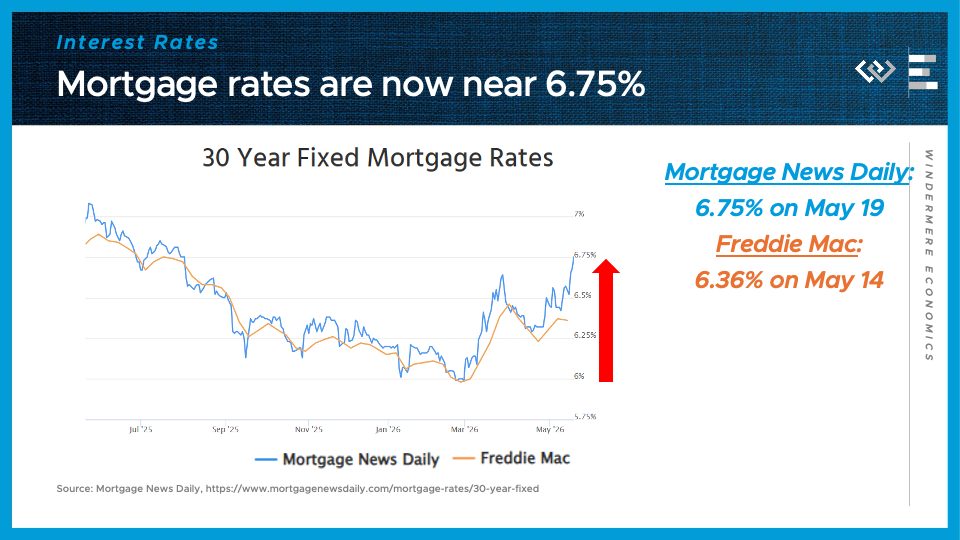
And we know higher Treasury yields usually mean: higher mortgage rates. After some volatility and false starts downward last month, mortgage rates have surged up even further in mid-May, approaching 6 and three quarters percent according to Mortgage News Daily. That will help to dampen homebuyer demand in the spring buying season, which is in full swing.
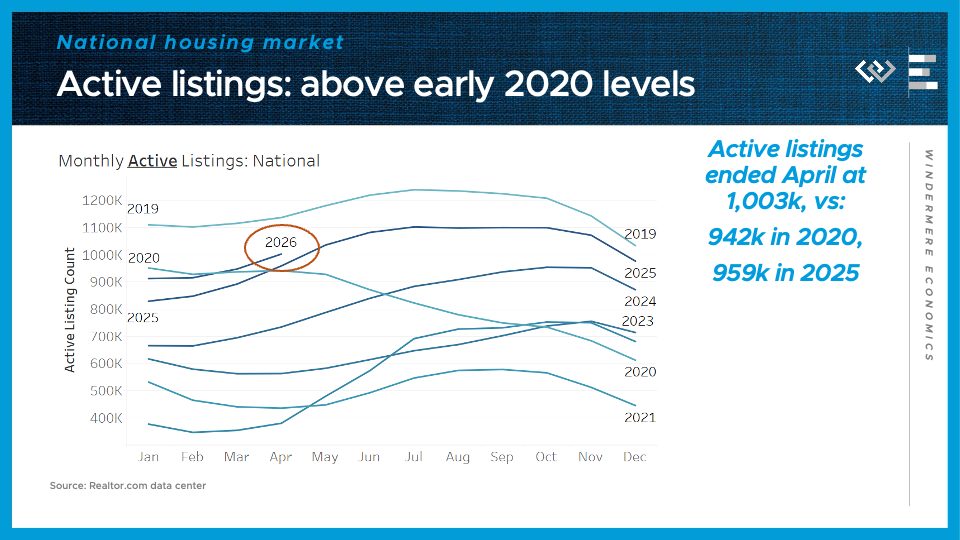
Speaking of the housing market, we saw just over a million active listings at the end of April—about 60 thousand more than this time in 2020, and 40 thousand more than this time last year.
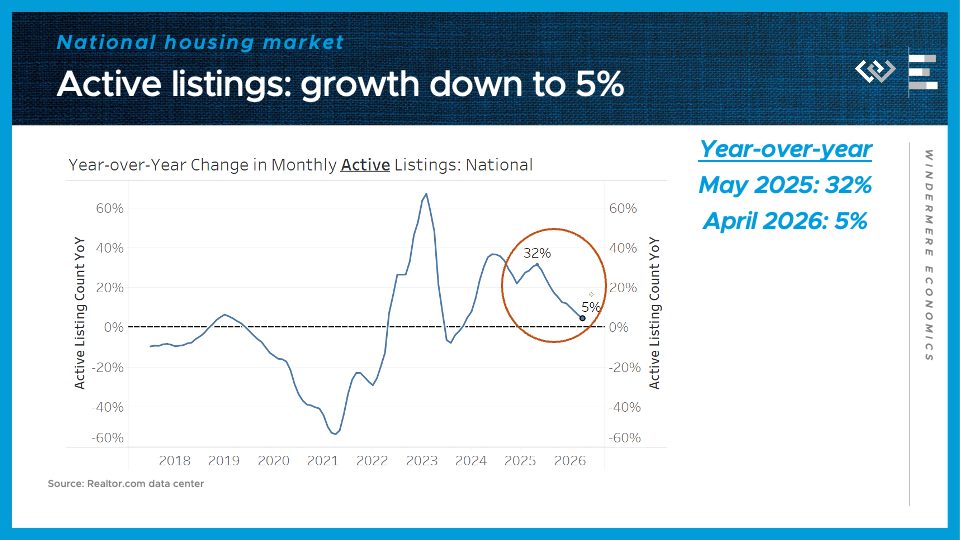
That year-over-year growth rate of just under 5% helps continue a trend of decelerating inventory growth, as the market looks more and more balanced this year – with neither a glut of home listings building up nor a frenzied shortage condition, at least on average across the country. Pending home sales were also basically flat from this time last year, but if mortgage rates stay above 6.5%, I expect the months of May and June will look weaker than the same time last year. Once again, that means the forecast depends on whether durable peace can take hold, and whether oil begins to flow again, in the Middle East.
Local Look Western Washington Housing Update 5/7/26
Hi. I’m Jeff Tucker, principal economist at Windermere Real Estate, and this is a Local Look at the April 2026 data from the Northwest MLS.
We are now in the heart of the spring selling season, and it is shaping up to be a little quieter than last year’s spring.
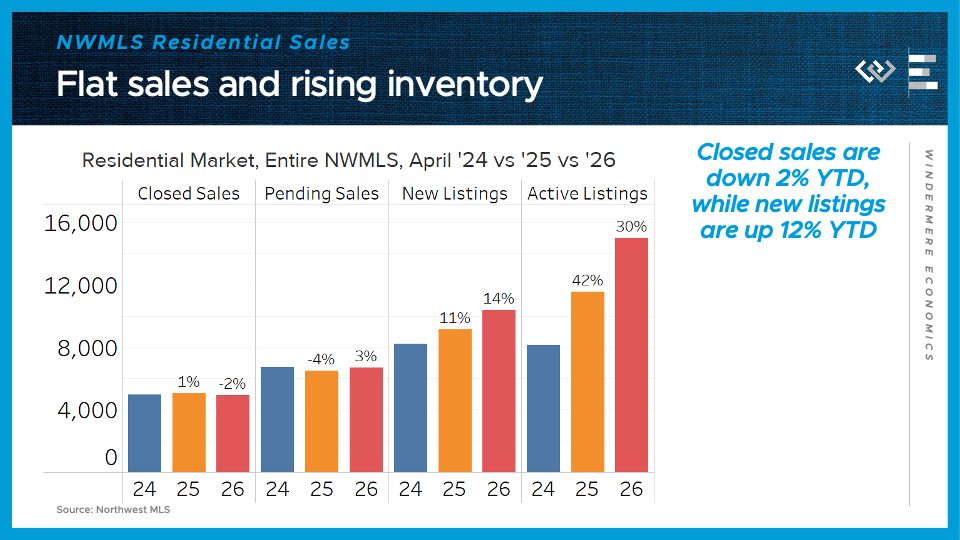
Across the Northwest MLS, there were 2% fewer closed sales in April 2026 than in April of last year. Pending home sales, by contrast, climbed by 3% from last year.
On the supply side, the flow of new listings was up an impressive 14% from last April’s pace, or 12% cumulatively, year-to-date. Finally, the month ended with just over 15,000 active listings around the MLS, or 30% more than last April. That continues the local trend of rising inventory, reflecting more sellers than buyers coming to the market this year.
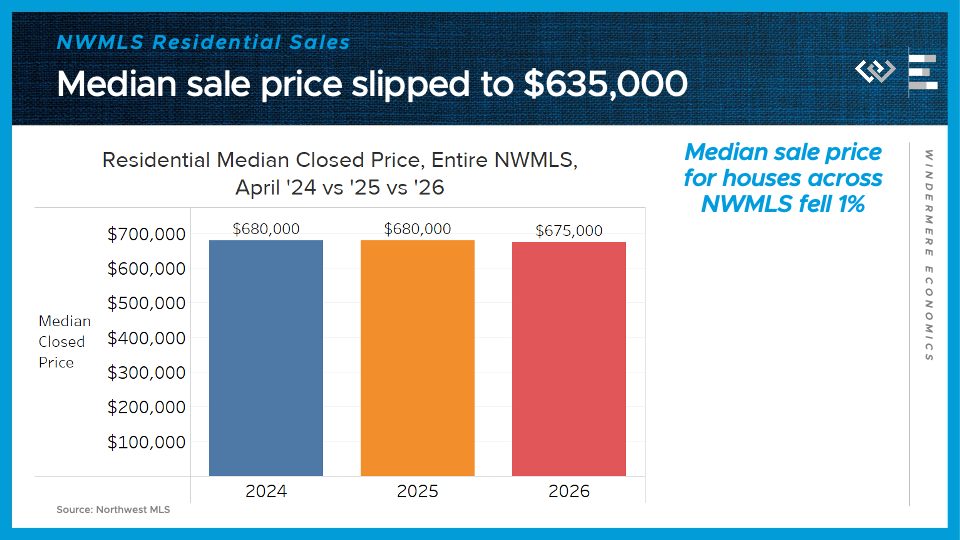
The median sale price ticked down from last April, by just $5,000, or less than 1%.
Now for a closer look at the four counties encompassing the greater Seattle area.
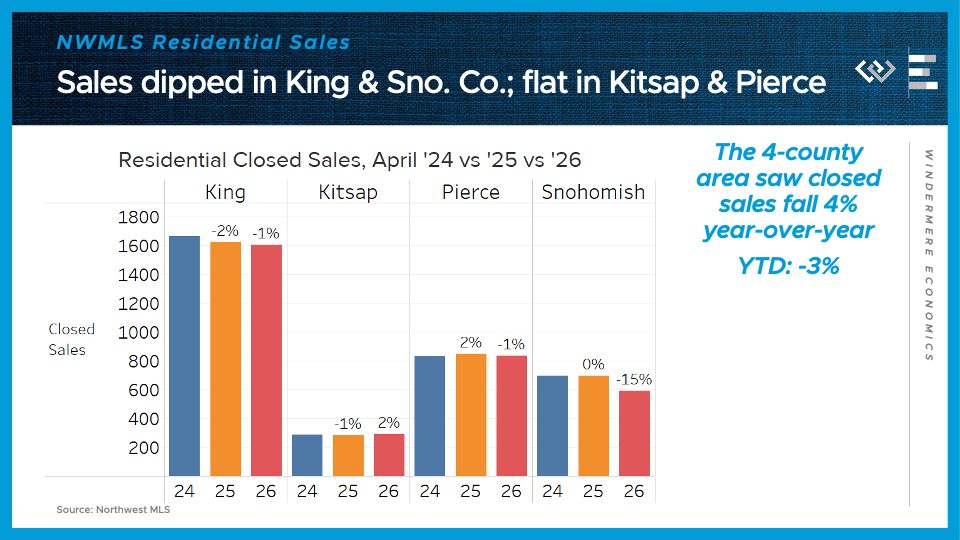
Closed sales declined by 4%, or 130 homes, from last April around the region. Snohomish County alone saw closed sales drop by 104 homes, or 15%, while King, Pierce and Kitsap Counties saw sales within a couple percentage points of last April’s totals.
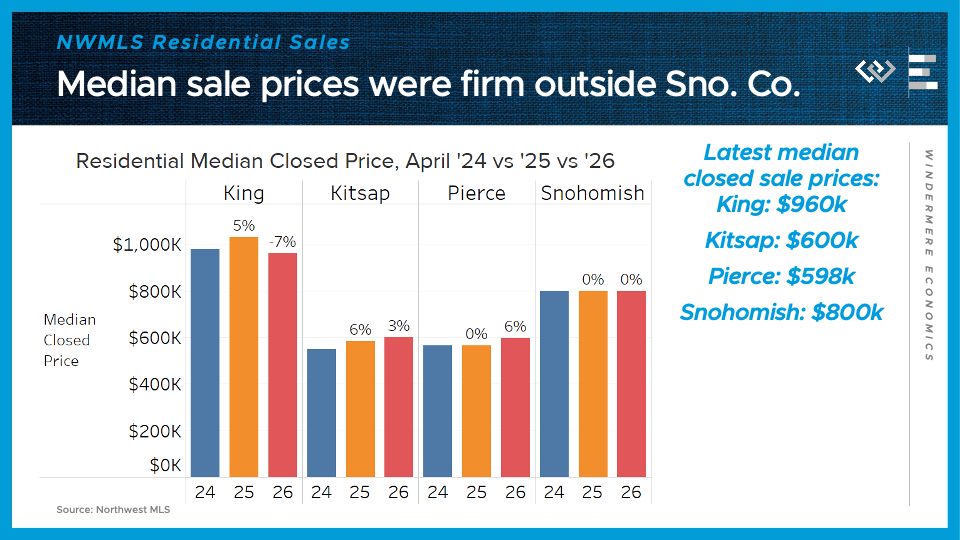
Median sale prices, though, dipped the most here in King County, where they fell 7% short of last April’s $1,030,000 mark. Prices were flat in Snohomish, near $800,000; and up modestly to about $600,000 in both Pierce and Kitsap Counties.
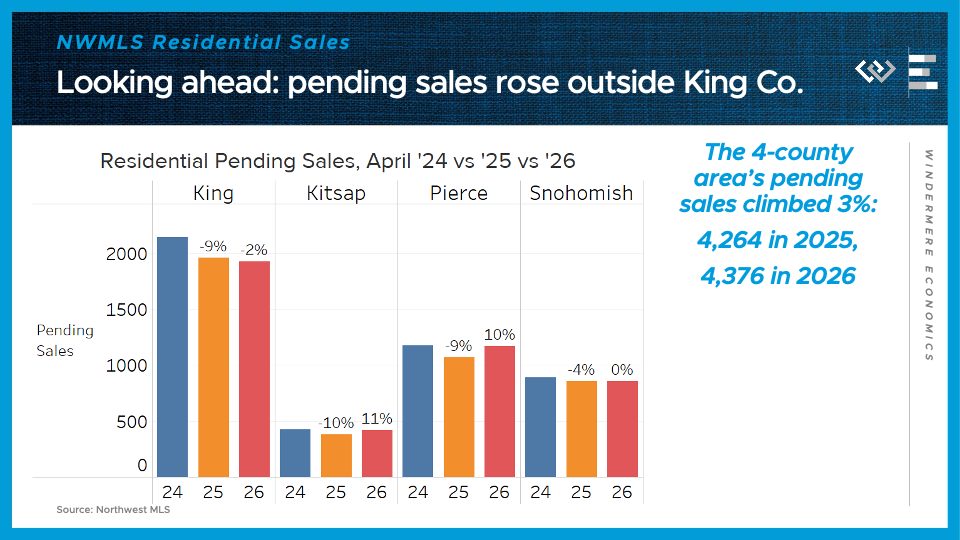
Looking ahead, pending sales actually climbed 3% across the region in April, led by strong growth in Pierce and Kitsap Counties, while only King County saw a modest dip in pending home sales.
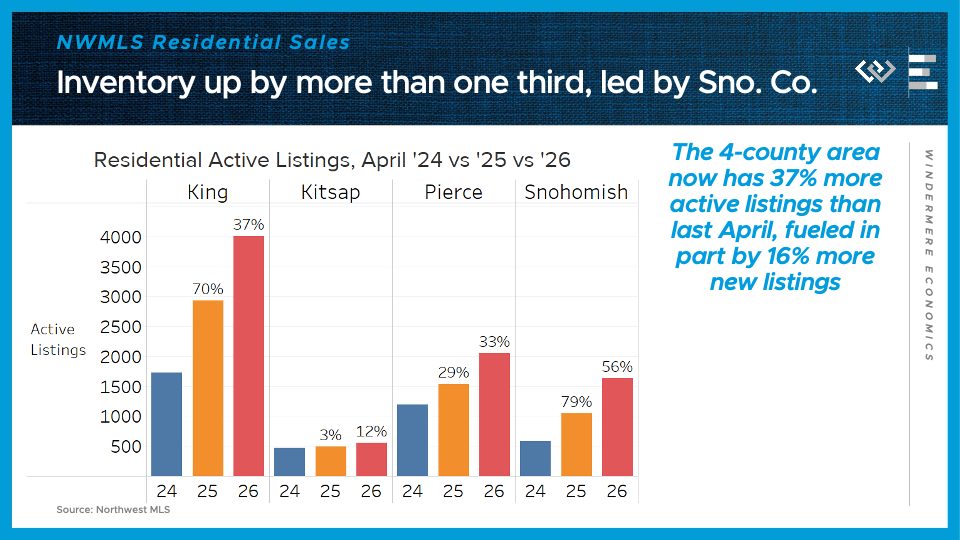
On the supply side, the 4-county greater Seattle area ended the month with 37% more active listings than last April, led by 56% growth in Snohomish County and 37% growth in King County.
Spring remains the best time of year to sell a house, but this spring also looks like an unusually good time to buy a house, thanks to unusually many listings, which are taking a little longer to sell on average, and in some areas selling for a little less than similar houses last year. Well-presented, appropriately-priced homes are still seeing a lot of competition, but plenty of other homes are lingering a little longer on the market, selling at or below list price. It seems that the negative effects of the war in Iran are discouraging some buyers, who may be taking a “wait-and-see” approach, which leaves the market a little more balanced for the many buyers who are still forging ahead this spring. If economic and geopolitical news improves, there’s still plenty of time to see a busy second half of the spring selling season.
2026 First Quarter Regional Real Estate Report

This is a recurring series of blog posts taking a closer look at the U.S. economy and several major regional markets in Windermere’s nine-state footprint. Updates will be released on a quarterly basis.
Economic Overview
At the end of February, the spring housing market appeared poised for a rebound. Mortgage rates dipped below 6% for the first time in over three years, driven by a combination of narrowing mortgage-Treasury spreads, falling Treasury yields, reduced interest rate volatility, and the FHFA’s announcement that Fannie Mae and Freddie Mac would buy substantial amounts of mortgage-backed securities.

Source: Freddie Mac via FRED.
Then the market was thrown for a loop by the sudden onset of the war in Iran. The effects on the economy, interest rates, and the housing market are only just coming into focus, but so far, the signals are negative. Mortgage rates jumped by as much as half a point in the six weeks after the war began, and March saw the highest one-month increase in the gasoline consumer price index in decades.

Source: BLS via FRED.
As the energy shock ripples through the global economy, it is likely to slow economic growth while pushing prices higher. The magnitude of those effects will depend on how quickly the Strait of Hormuz reopens to tanker traffic, as well as how long it takes to restart oil production and other industrial activity across the Gulf states.
Against that backdrop, local housing market data for the first quarter of 2026 largely reflect conditions before the impacts of the war began to take hold. By the second quarter, we should have a clearer picture of those effects.
The following is a detailed overview of housing trends across six regional markets within Windermere’s footprint during the first quarter of 2026. They include:
- Greater Seattle Area
- Greater Portland Area
- Greater Sacramento Area
- Northwest Washington State
- Spokane, WA and Coeur d’Alene, ID
- Salt Lake County, UT
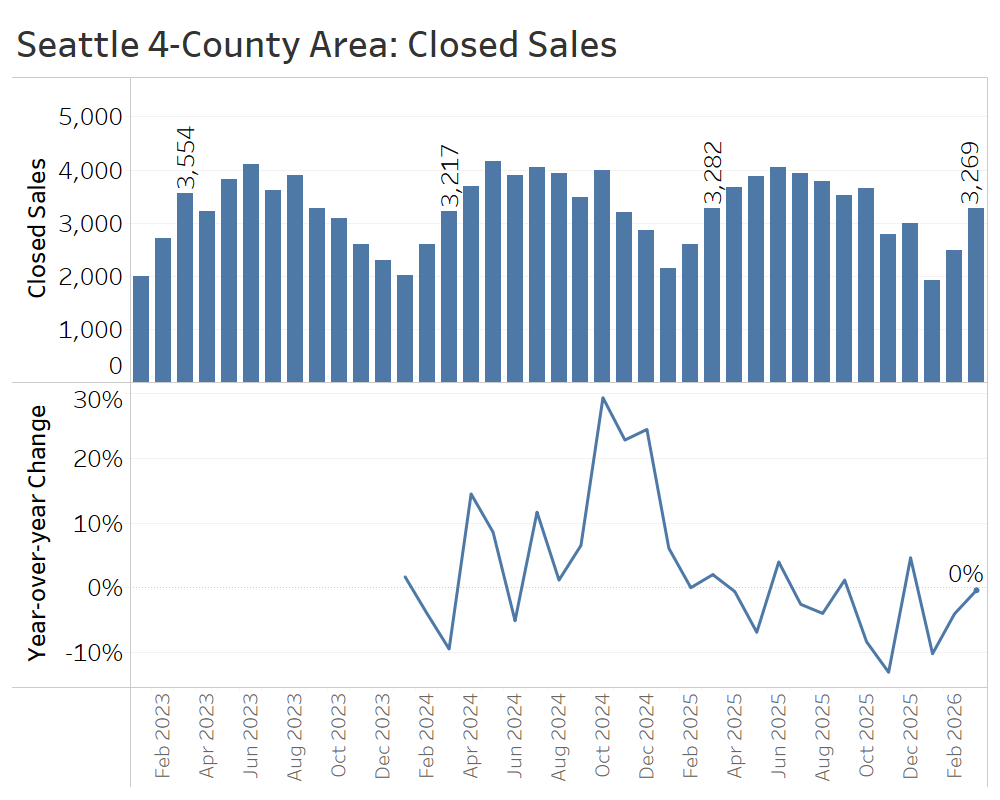
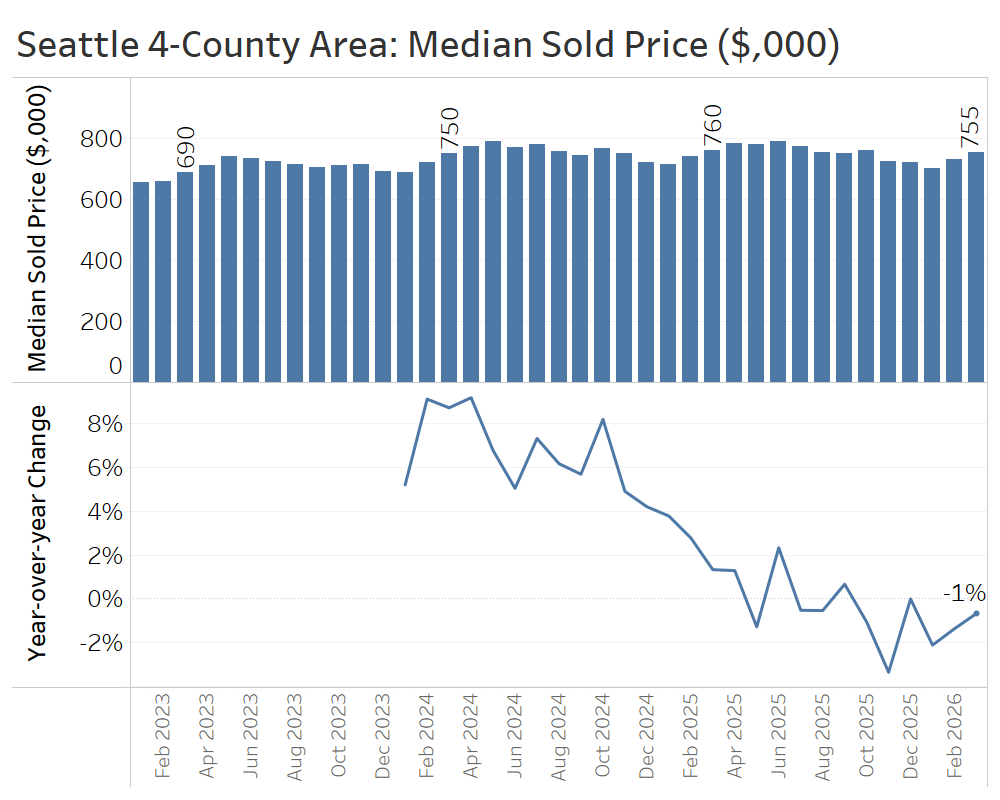
Greater Seattle Area (King, Snohomish, Pierce, and Kitsap Counties)
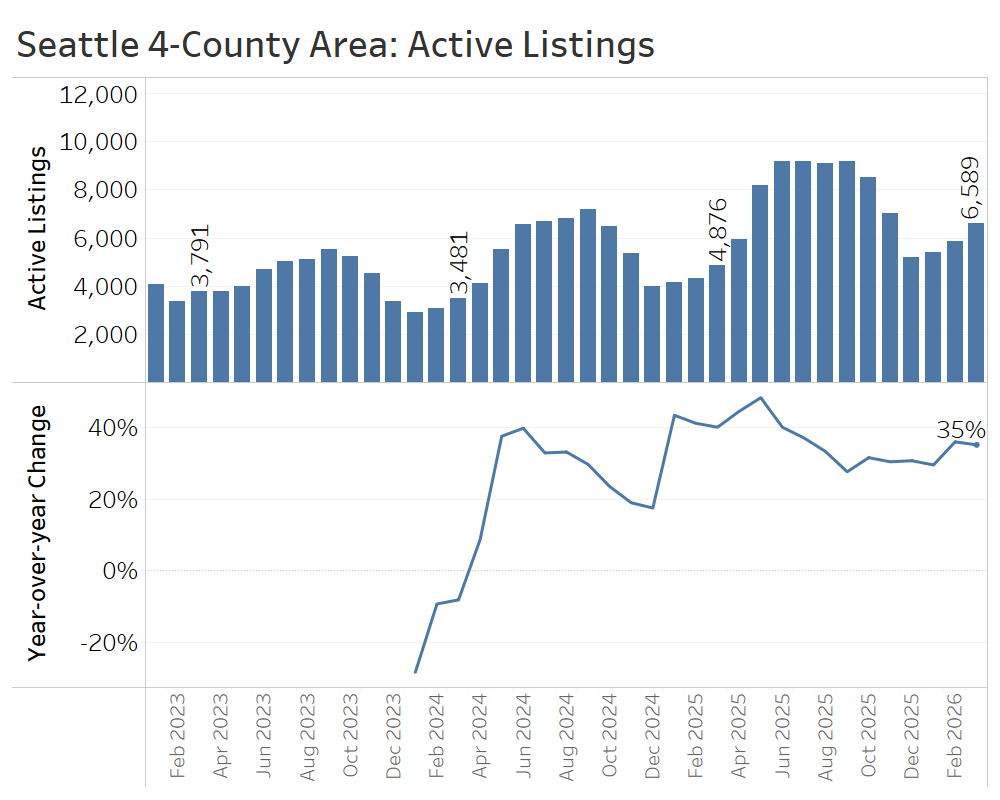
While the spring selling season is typically the strongest time of year for sellers, conditions this year in the greater Seattle area look closer to a balanced market, as abundant listings are meeting only modest demand. Active listings at the end of March were 35% higher than the same time in 2025, a substantial increase and an acceleration from the pace of growth observed in late 2025.
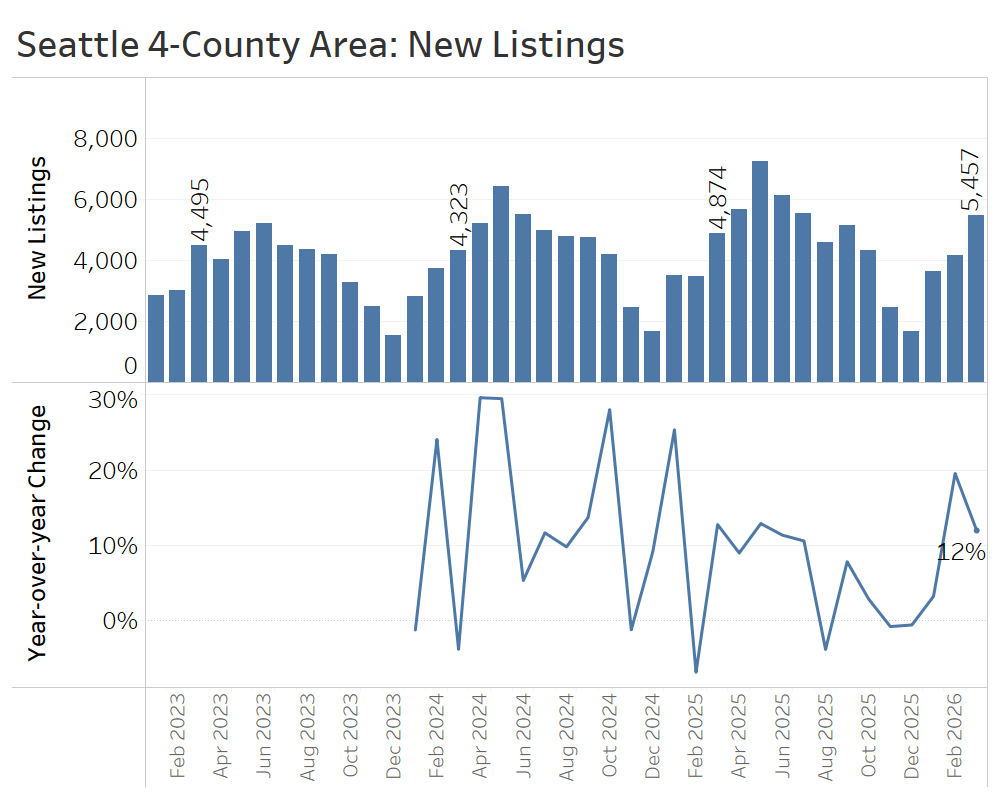
Some of that growth in active listings stemmed from the growth of new listings. More than 13,000 homes hit the market in the first quarter, or about 12% more than in the first quarter of 2025. The flow of new listings may have been particularly strong this spring with the return of patient sellers who held off, or de-listed, late last year.
The usual seasonal acceleration in time-on-market took hold this spring, but the median home still took 35 days to sell in March, up from 31 days a year earlier.
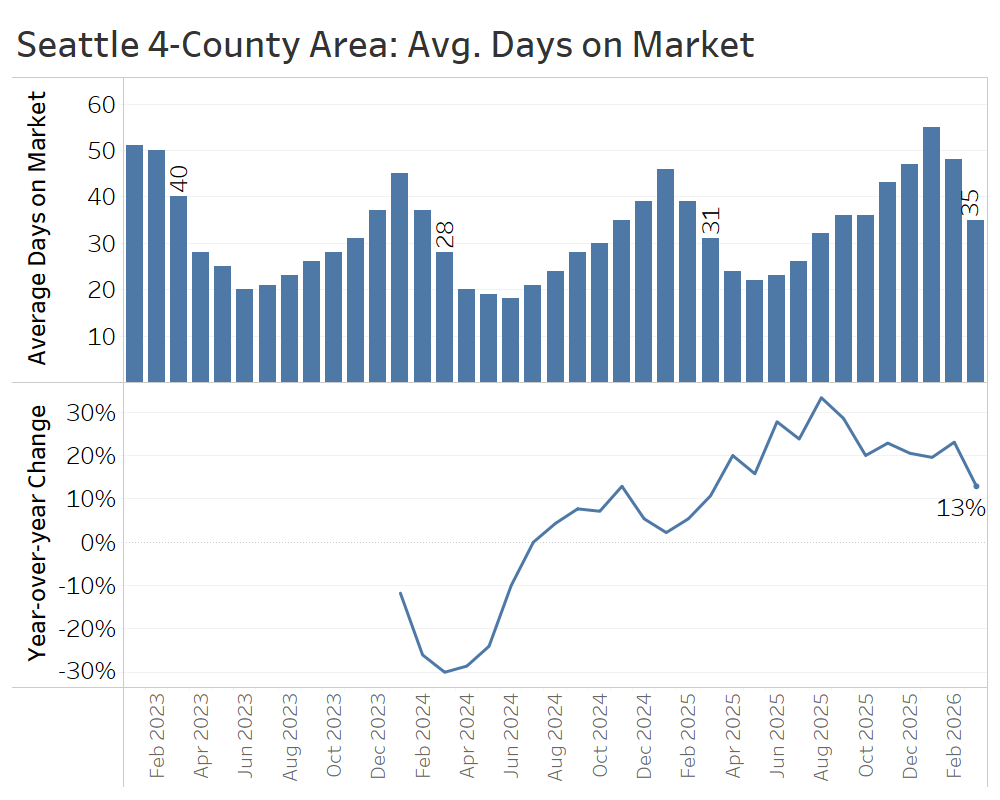
Closed sales in March fell just short of their level one year ago, and for the quarter as a whole, 4% fewer closed sales were recorded than throughout the first quarter of 2025. This is a clear indication of softer demand this year.
Cooler demand this quarter showed up in prices, too. Median home sale prices hovered 1%-2% below year-ago levels throughout the first quarter.
The first quarter of 2026 brought a seasonal bump in demand, as usual, but it was smaller and more selective than the increase observed in the first quarter of last year. In this environment, sellers need to put their best foot forward and enter the market with realistic expectations, given the competition from other homes.
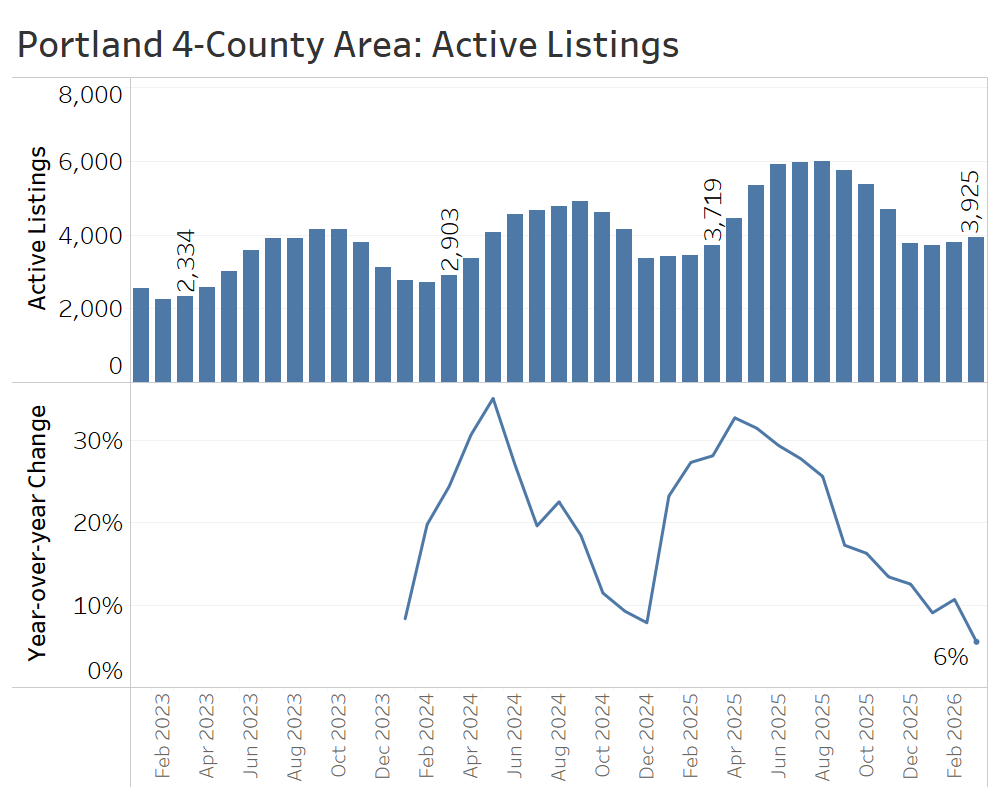
Greater Portland Area (Multnomah, Washington, Clackamas, and Clark Counties)
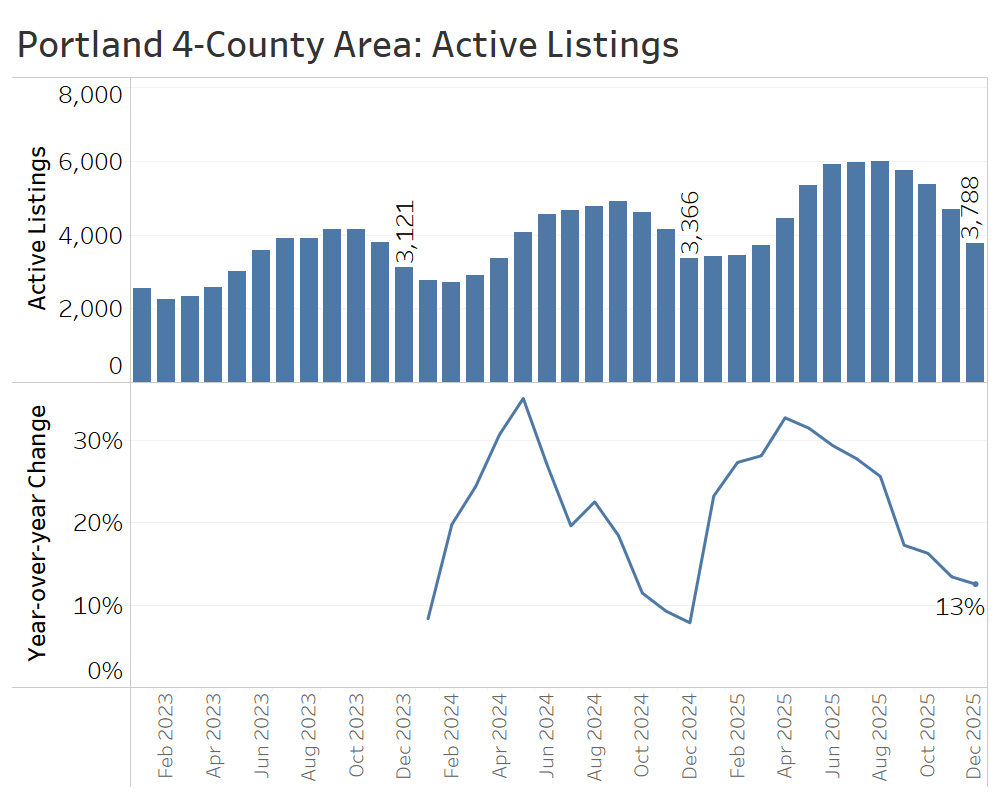
The greater Portland Area edged toward a balanced—or even a buyer’s— market in the first quarter of 2026, as inventory growth slowed to near zero, leaving active listings up only slightly from last year at this time, and sales rebounded modestly.
There were 3,925 active listings at the end of the quarter, which was 6% higher than one year earlier. That continues a trend of decelerating inventory growth since May of 2025.
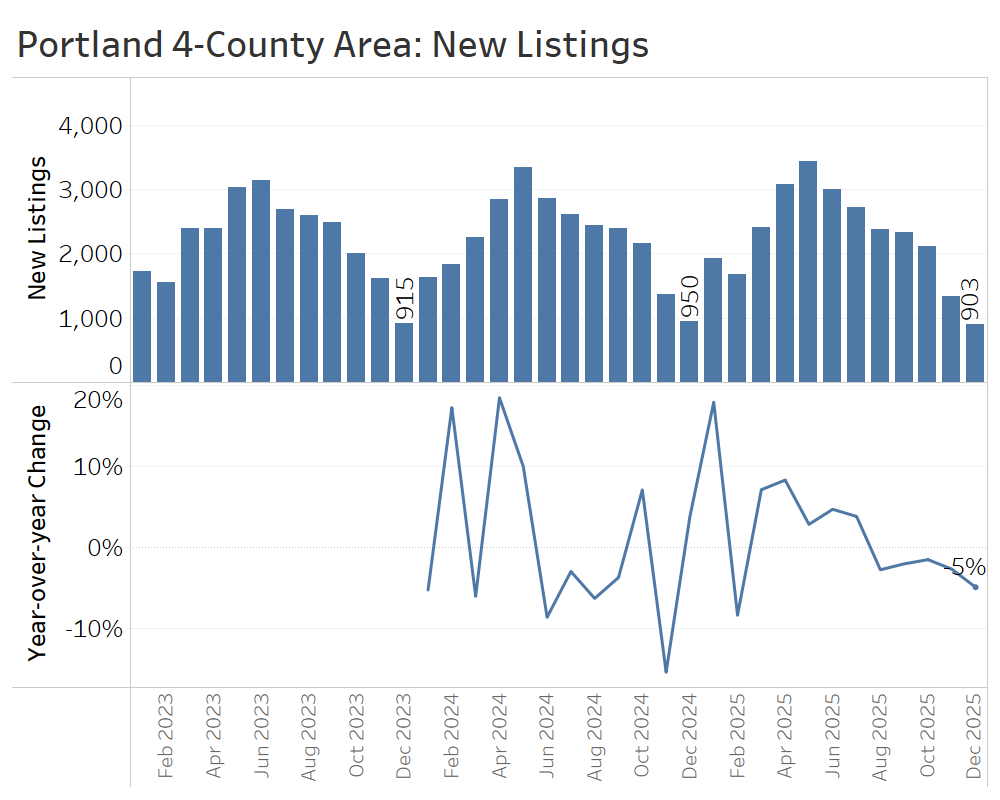
New listings in the first quarter jumped for the first time in several months, with a total of 8% more new listings in the quarter than in the first quarter of 2025.
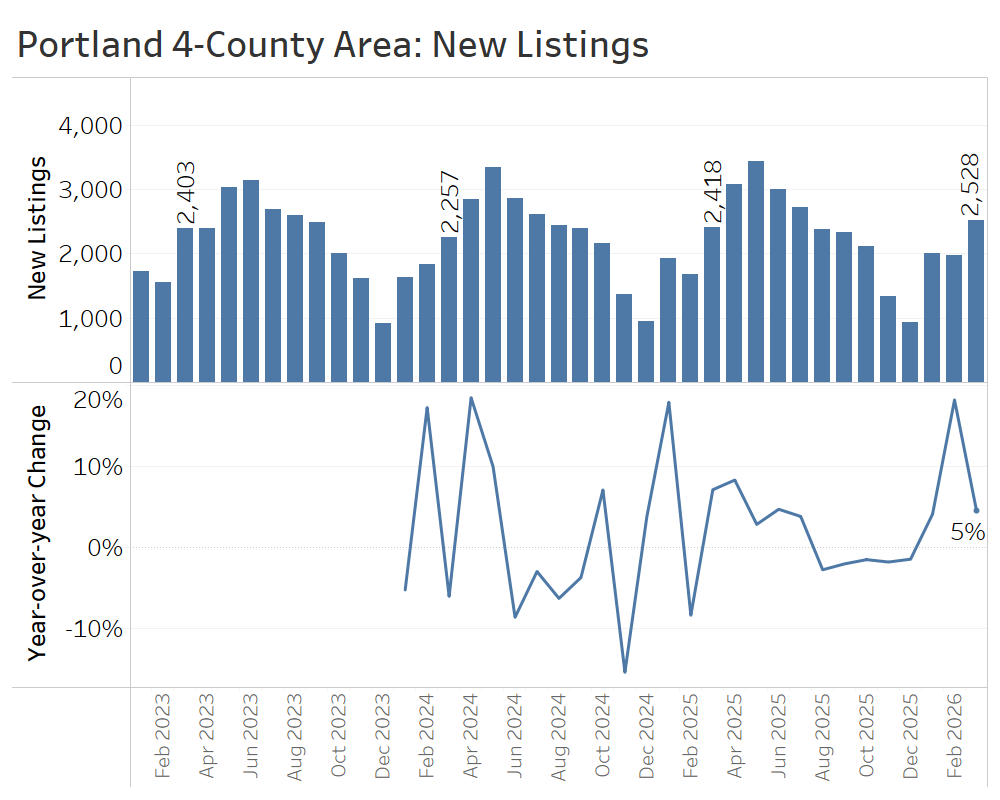
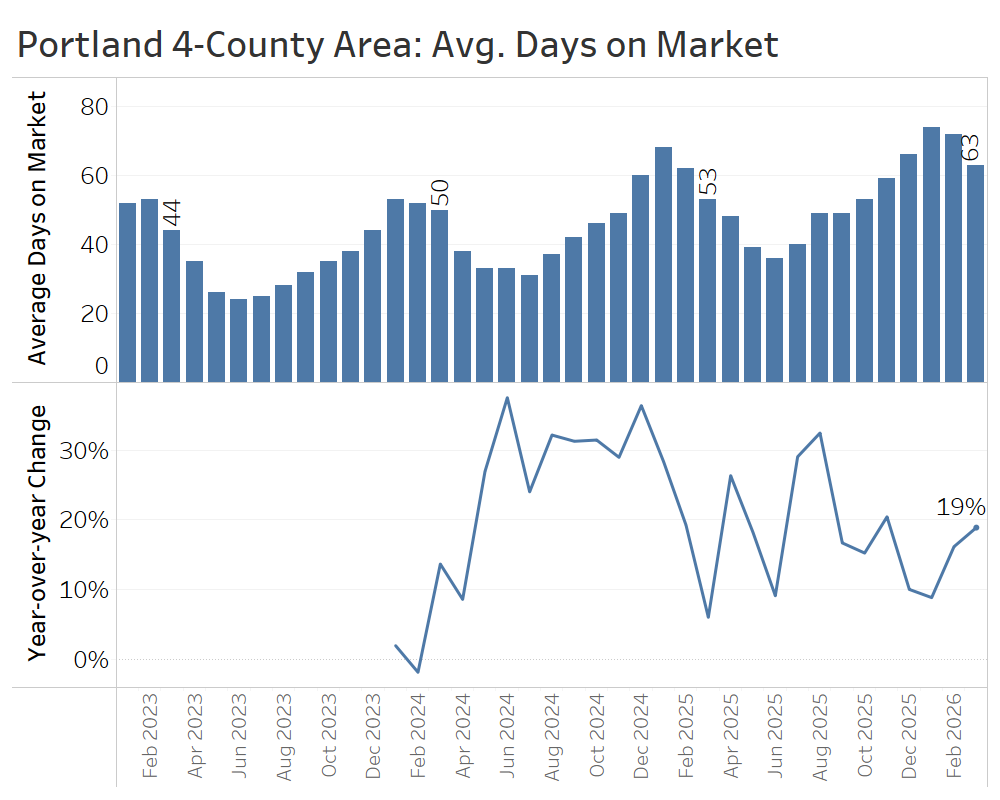
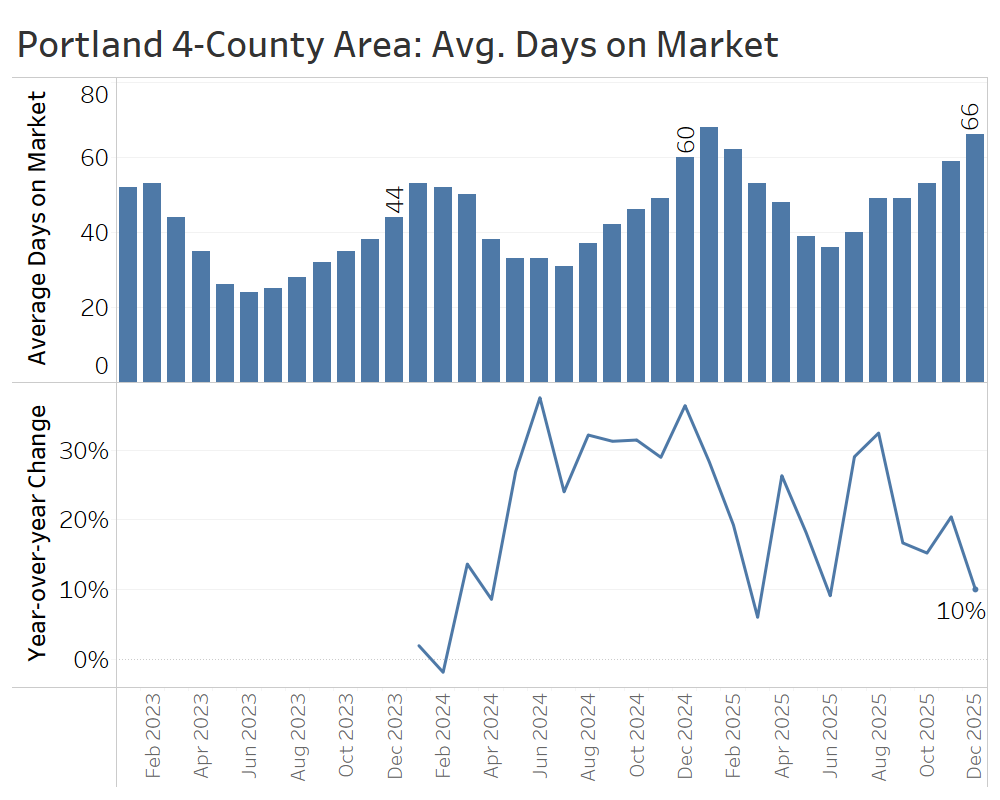
The average home sold after 63 days on the market—about 10 days longer than in March 2025. Nonetheless, that represents an acceleration from the seasonal trough for selling speed in January, when time on market topped out at 74 days.
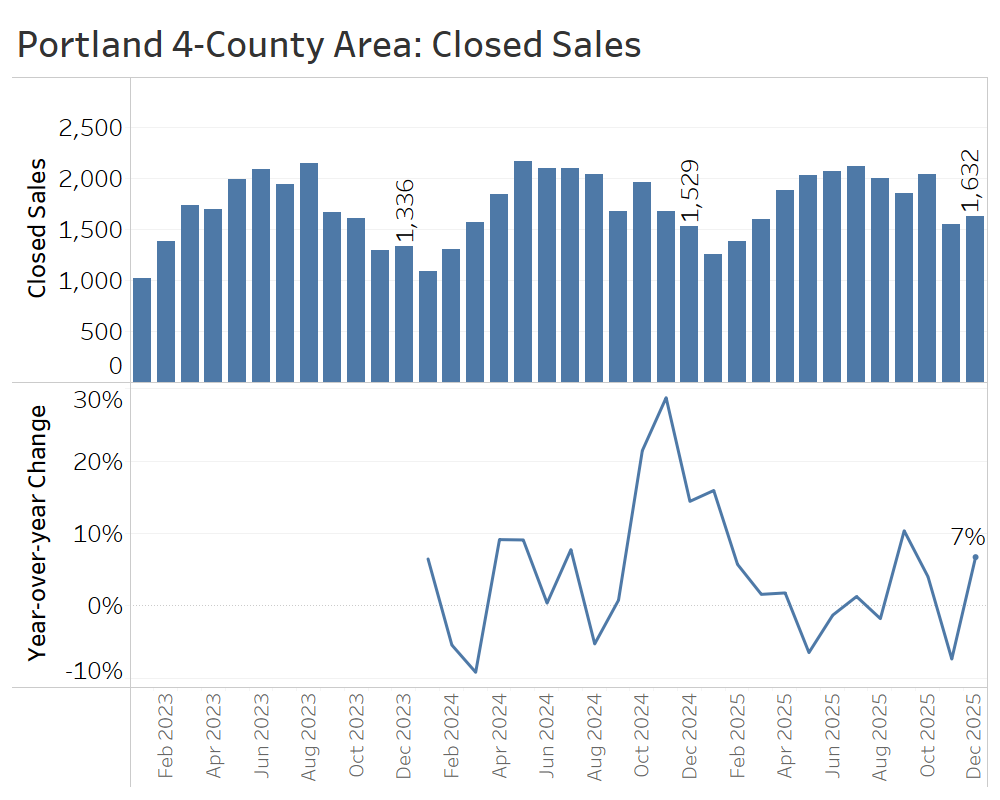
Closed sales of single-family homes jumped 10% year over year in March, offsetting a decline in January and bringing total first-quarter sales to 2% above the same period in 2025.

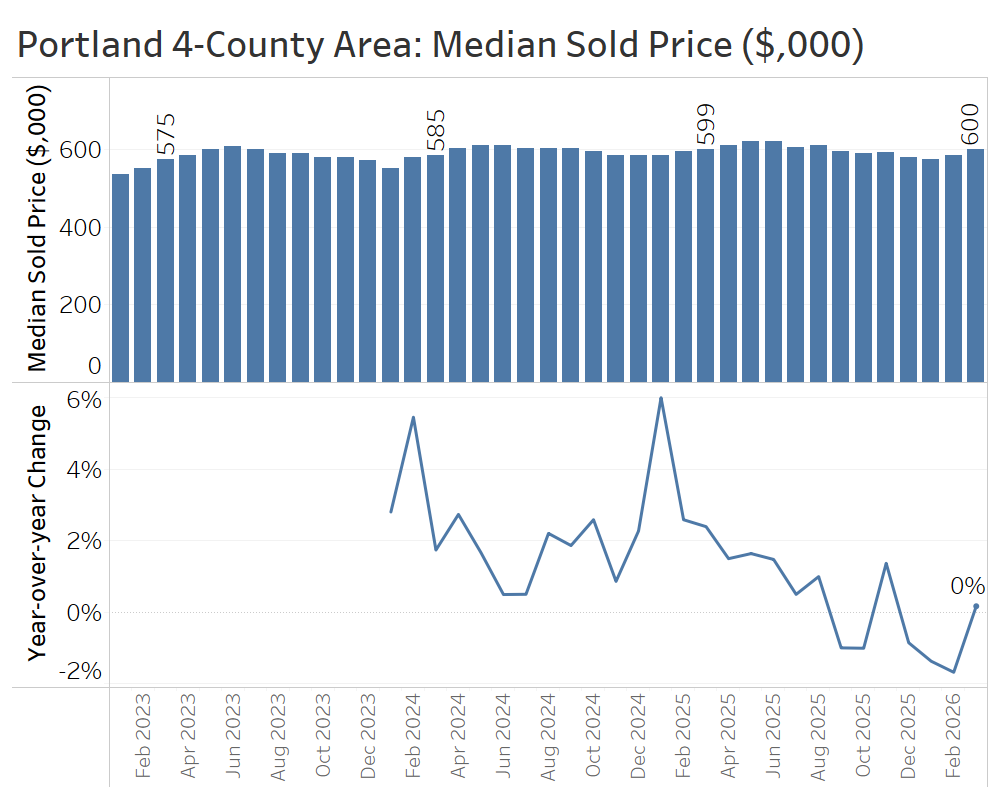
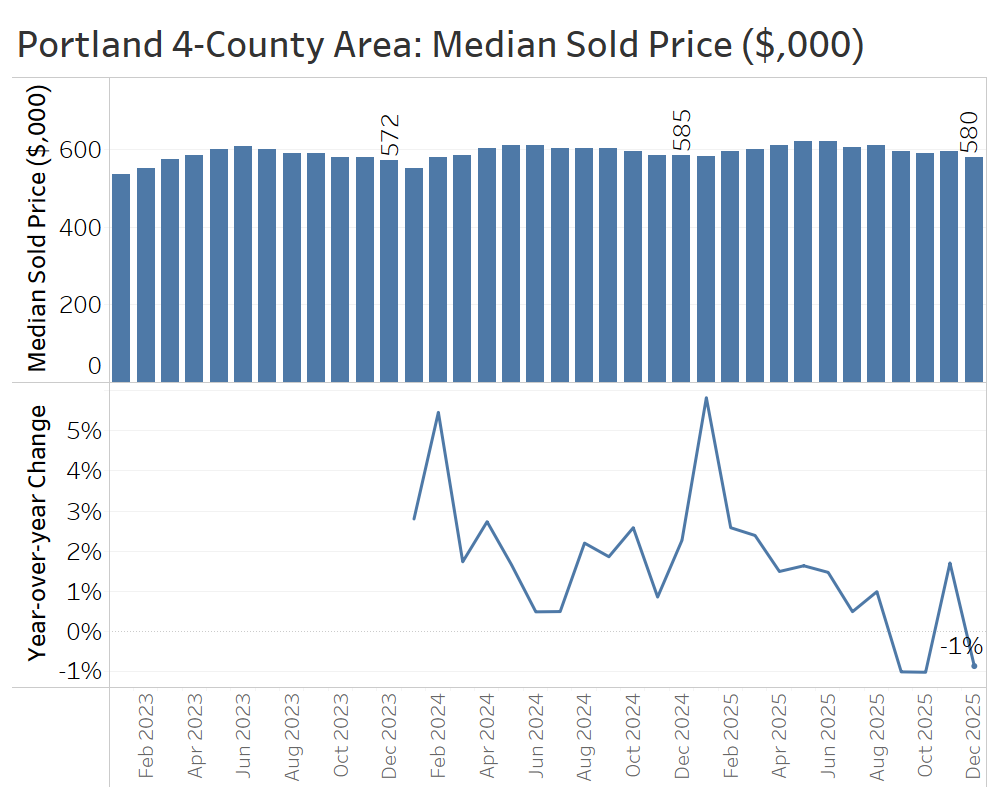
Median home sale prices in the Portland area were flat year over year at $600,000 in March, following slight declines of 1%-2% in January and February. While demand may be starting to pick back up, it is not yet translating into price appreciation given the high inventory levels.
Portland’s first-quarter market looked balanced this year, with flat pricing, modest sales growth, and renewed activity from sellers jumping into the market.
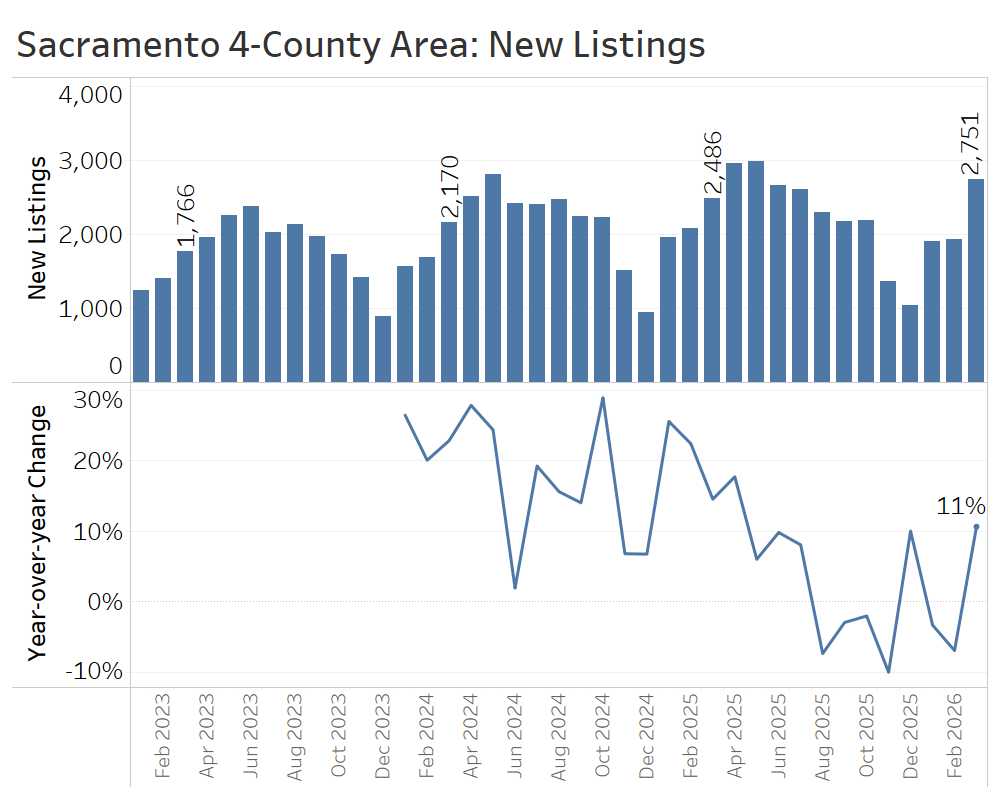
Greater Sacramento Area (Sacramento, Yolo, El Dorado, and Placer Counties)
The greater Sacramento area appears to be at a possible inflection point after swinging in buyers’ favor in 2025.
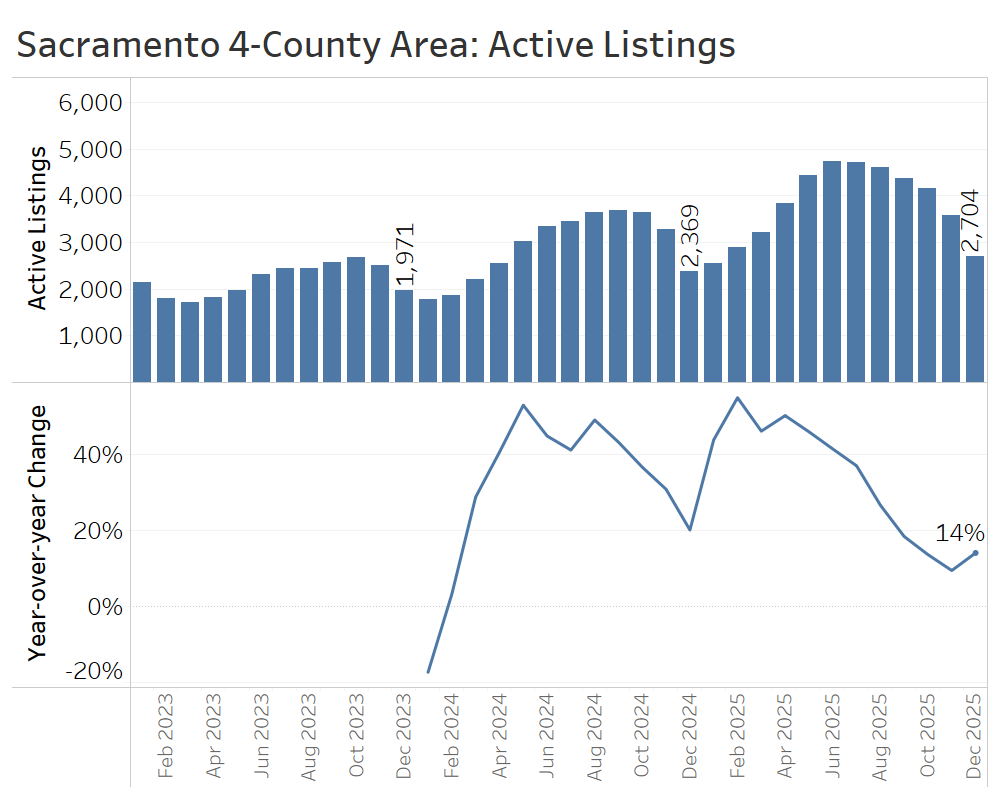
At the end of March, there were about 3,300 active listings—an increase of just 3% compared to March 2025—continuing a trend of decelerating inventory growth over the past year.
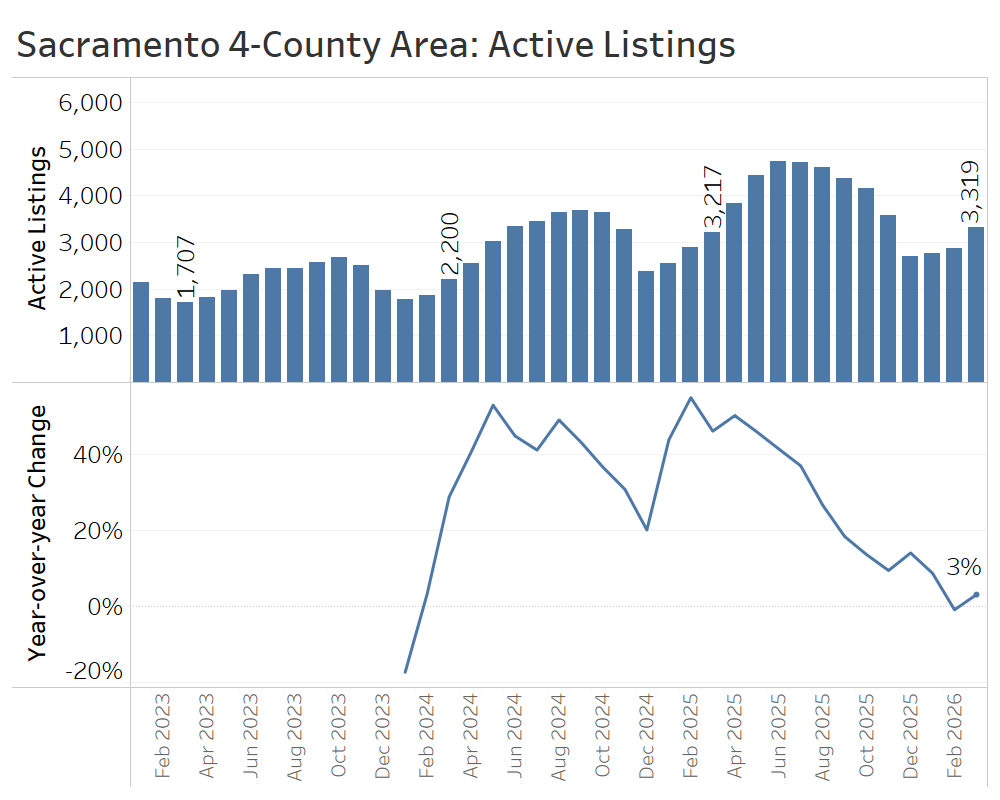
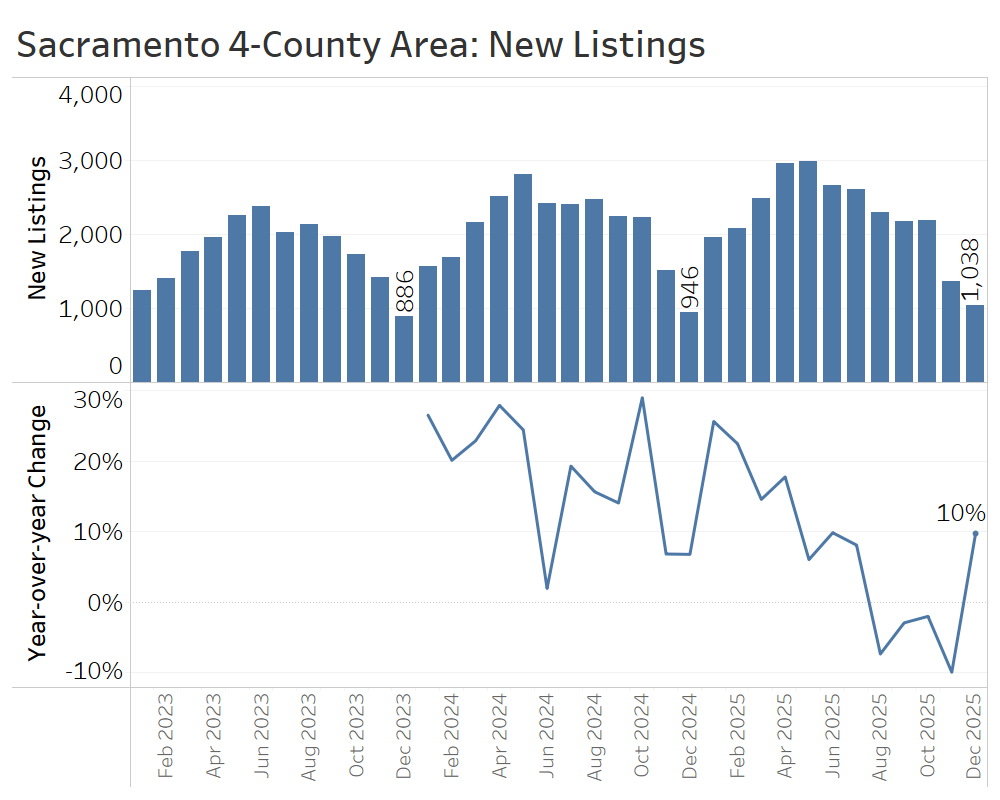
On a monthly basis, the new listings data has been volatile, with small declines in January and February followed by an 11% year-over-year jump in March. Overall, the quarter saw just 1% more new listings than that of the prior year.
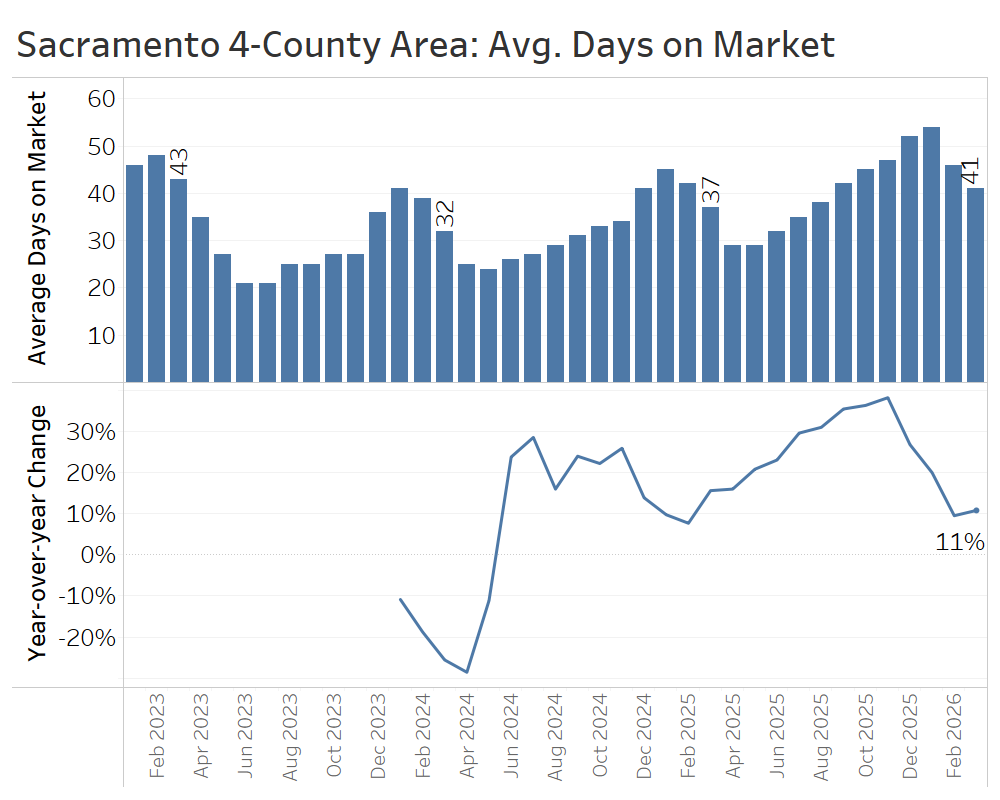
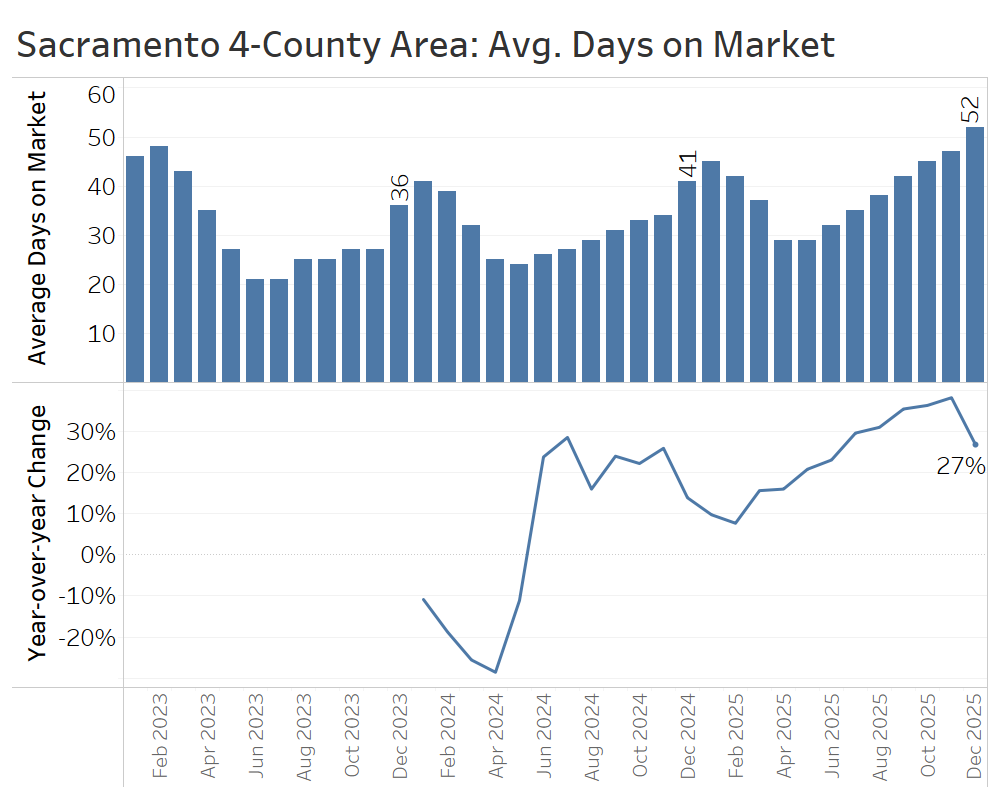
Average days on market rose by about four days compared to March 2025, reaching 41 days. That is a much more modest increase than the larger gains in days on market seen in late 2025.
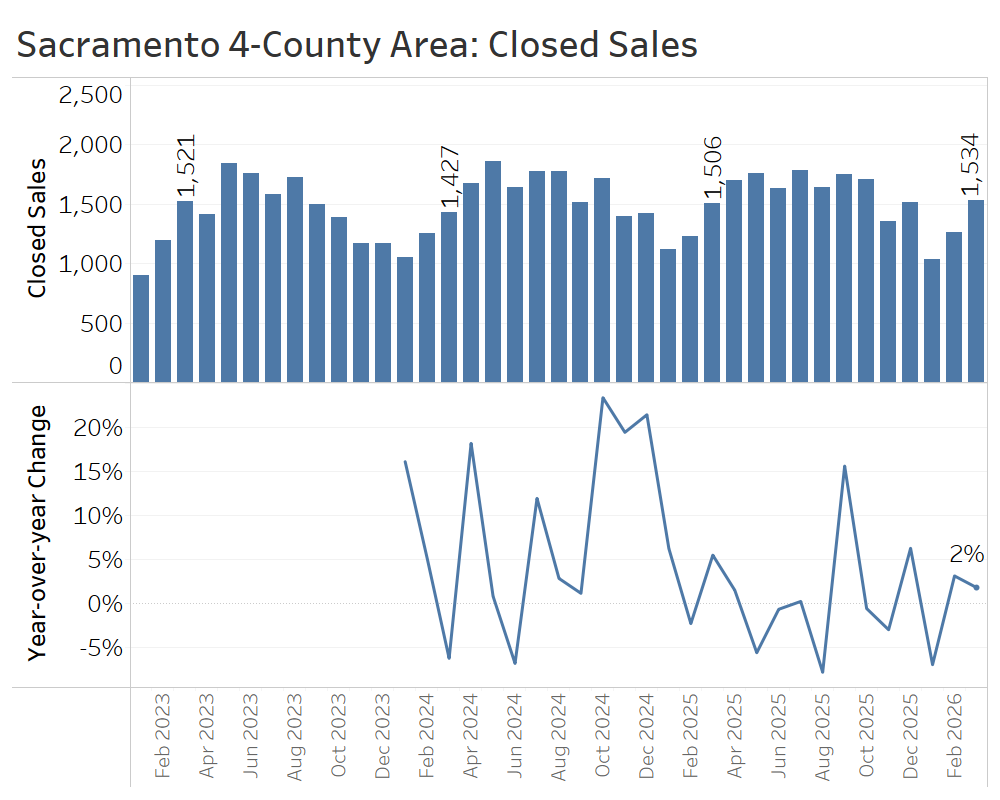
Much like in the fourth quarter, total closed sales for the first quarter were almost identical to the prior year: about 3,840 so far this year compared to roughly 3,850 in the first quarter of 2025.
The median sale price of $605,000 in March was higher than the seasonal winter lows, but still 1% below the March 2025 median.
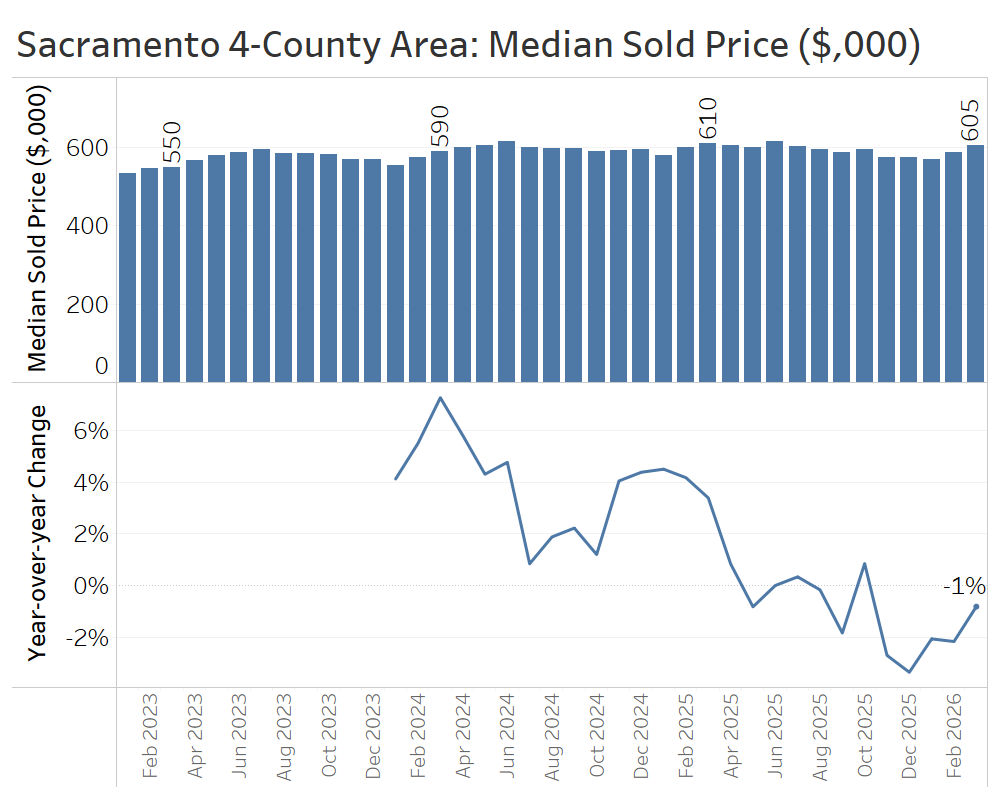
Overall, last year’s inventory growth around the Sacramento region led to a cooldown in pricing over the winter and into spring. Looking ahead, more modest inventory gains suggest that the pendulum won’t swing much further in favor of buyers.
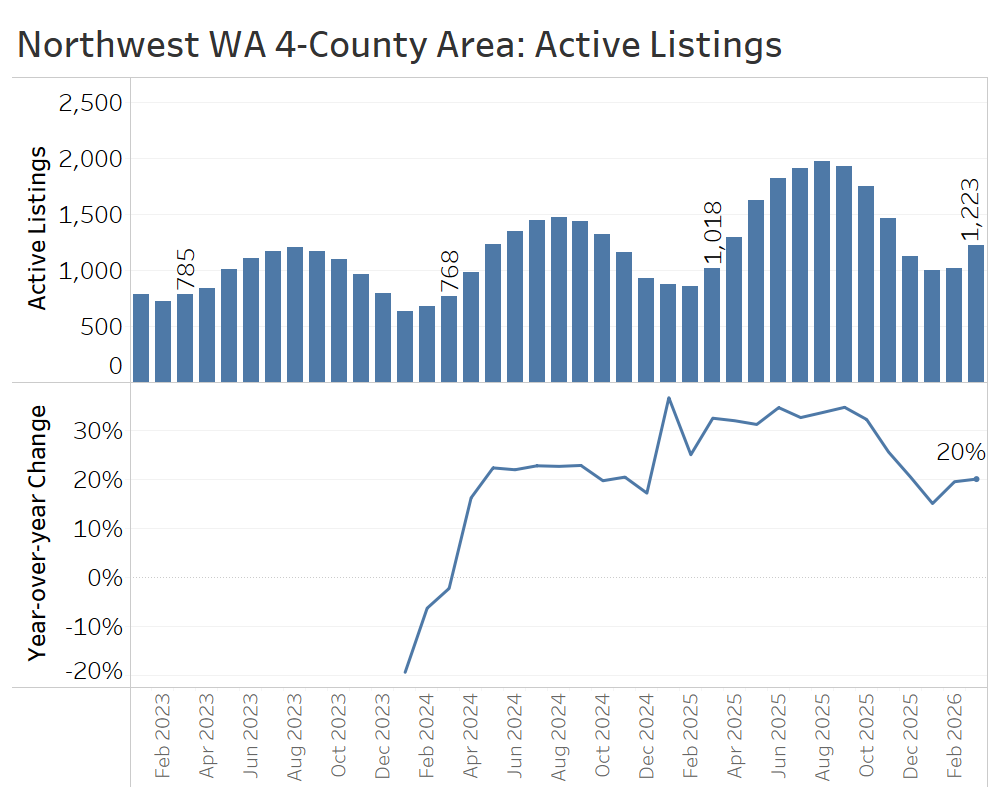
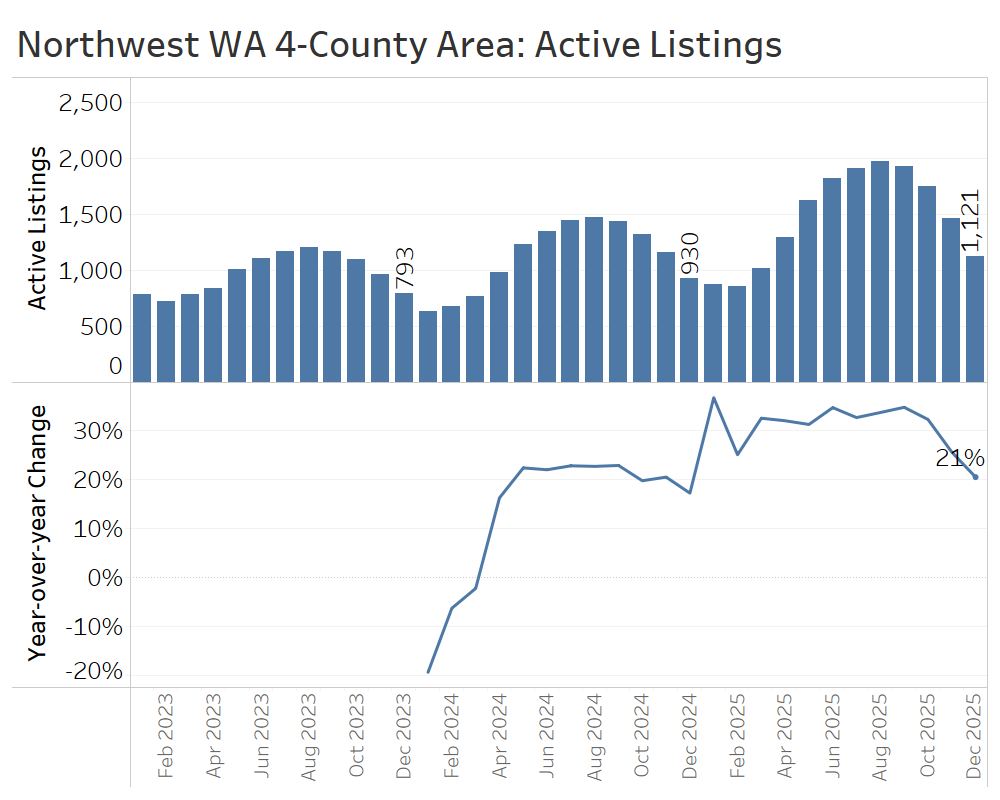
Northwest Washington (Skagit, Whatcom, San Juan, and Island Counties)
The market conditions in the four northernmost counties of Western Washington are still shifting toward buyers.
At the end of March, there were 1,223 active listings, up 20% from a year earlier. While that is slower than last summer’s inventory growth of 30% or more, it’s also no longer clearly decelerating.
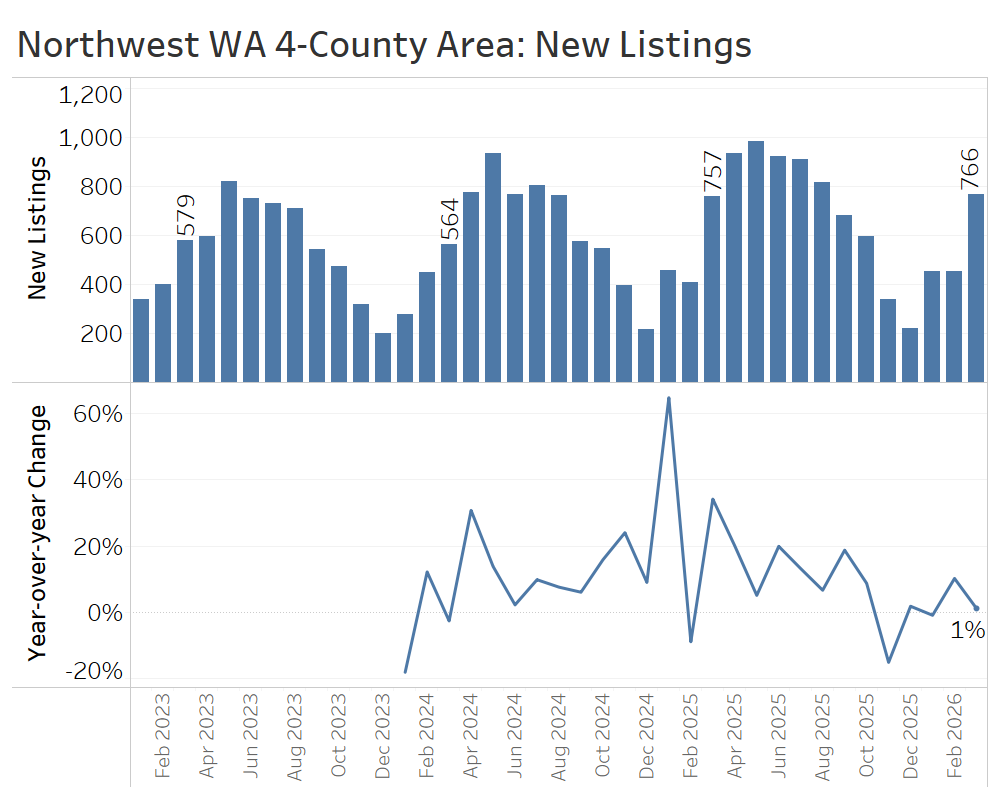
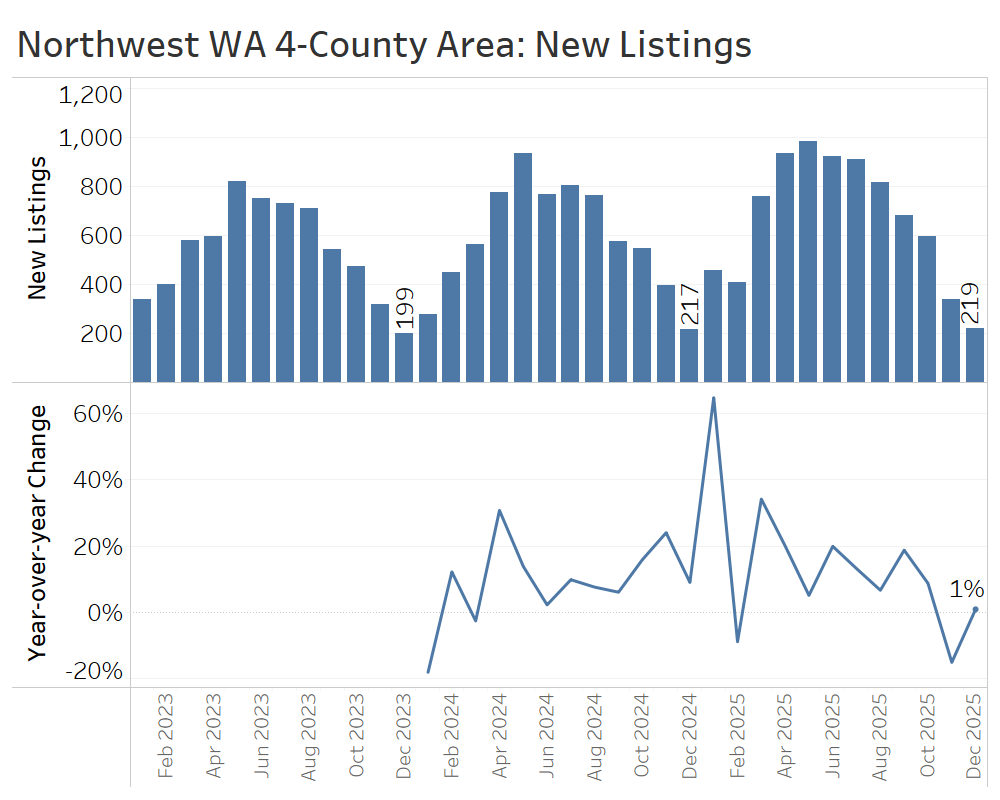
The flow of new listings slightly exceeded the first quarter of 2025, with a total of 1,669 new listings in the quarter, up 3% from last year’s 1,622. That is far from a flood of listings and likely reflects some discretionary sellers waiting until spring to list.
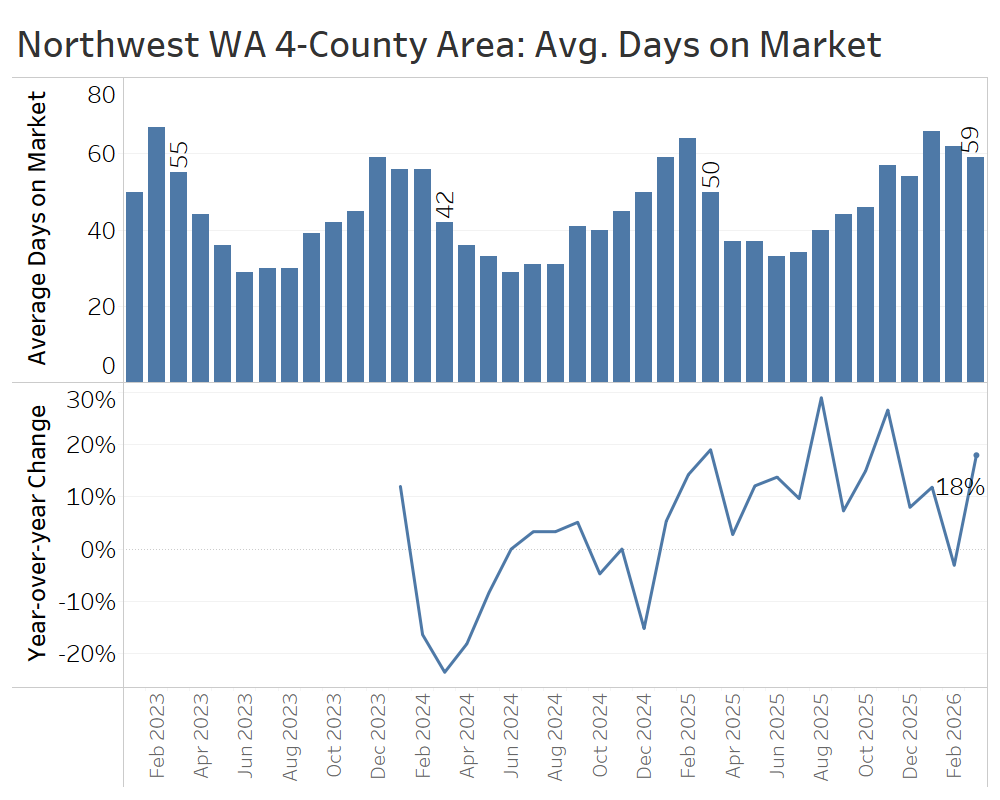
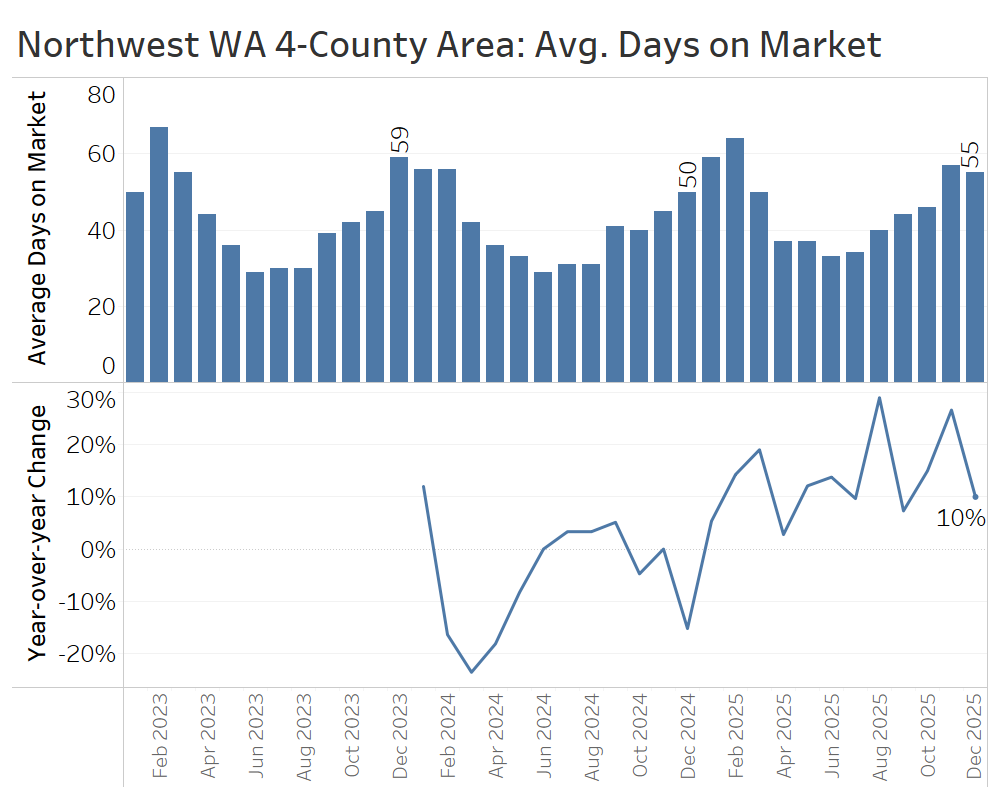
Days on market continued to climb compared to a year earlier, with homes in March taking nine days longer to sell than in March 2025.
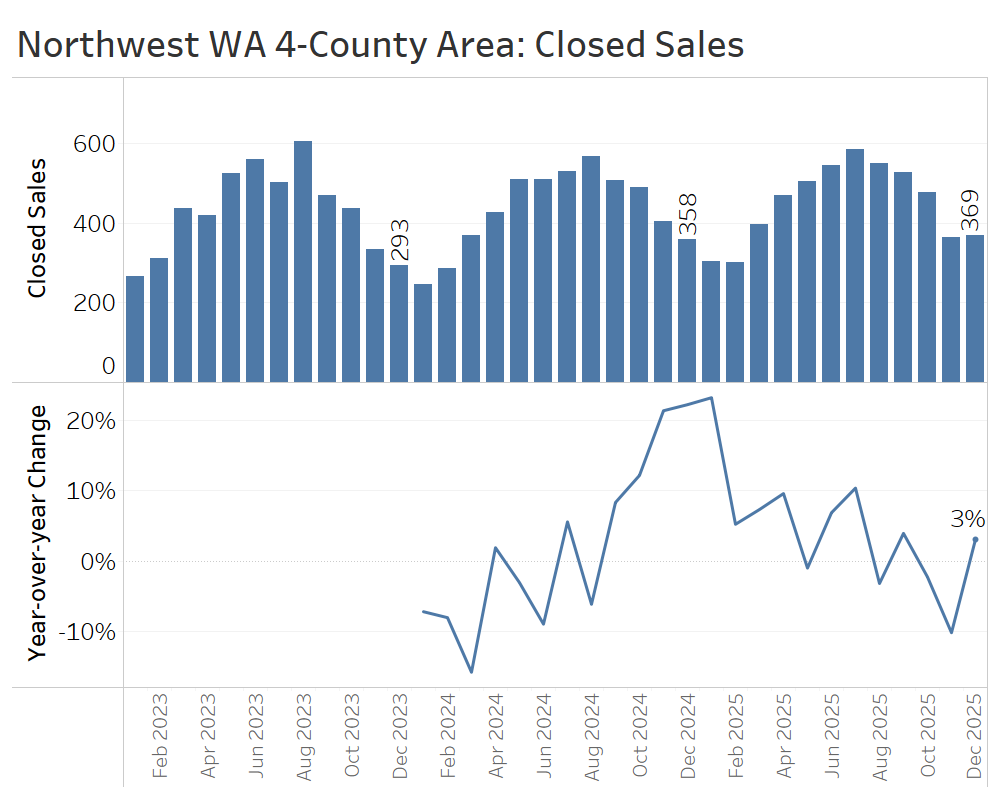
Closed home sales in the first quarter generally trailed first-quarter 2025 levels, except for a bump in February. In total, the 981 closed sales for the quarter fell 2% short of the 1,001 homes sold in the first quarter of 2025, but as the quietest quarter of the year, that statistic is prone to random variation.
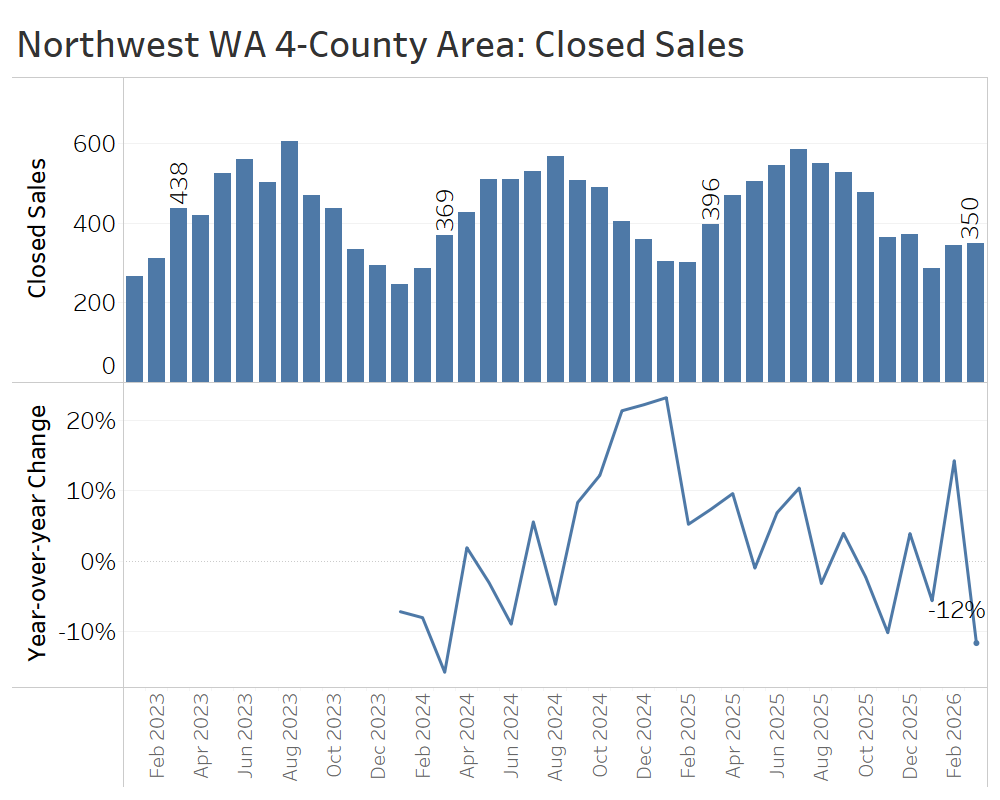
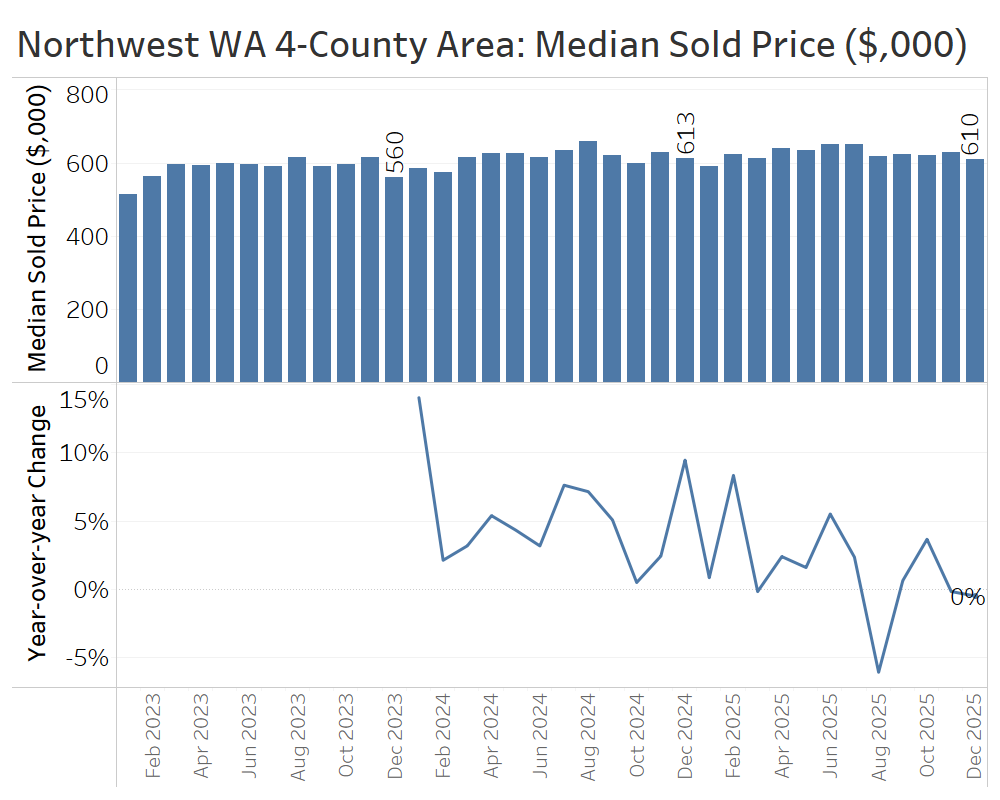
Median sale prices actually ticked up in January and March, reaching a recent high of $652,000 in March. That likely doesn’t reflect true price appreciation, given the lack of growth in sales volume, but rather reflects a shift in the composition of sales toward higher-end segments.
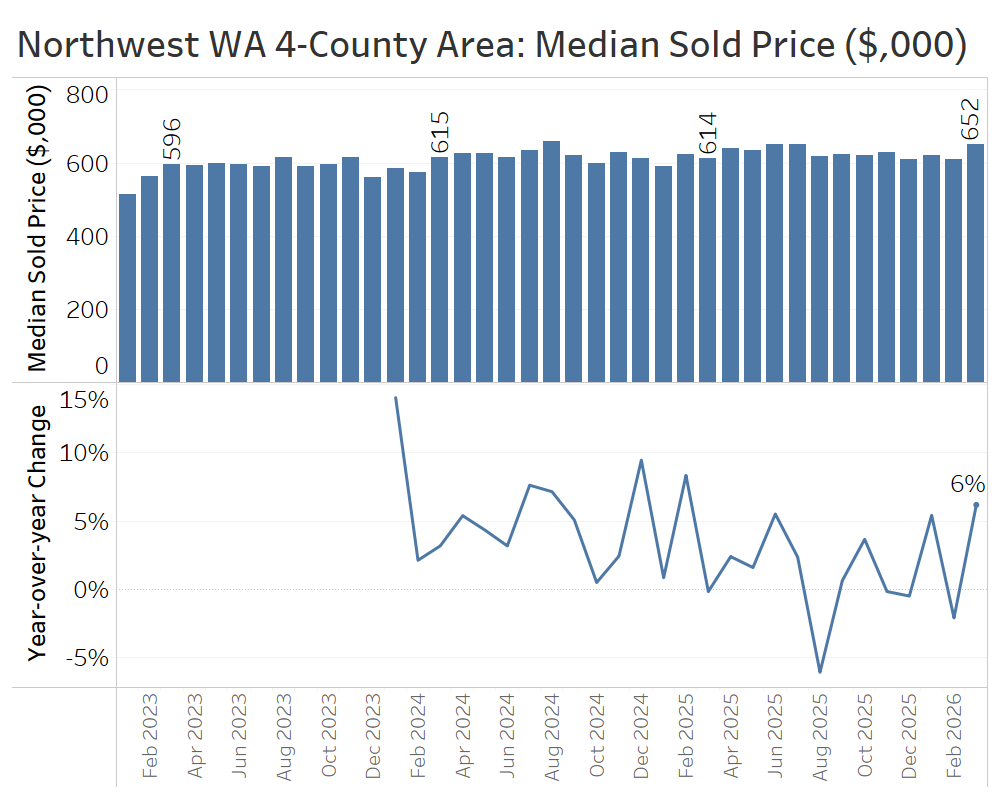
Overall, the first-quarter data has shown that the Northwest Washington housing market is off to a sluggish start this year.
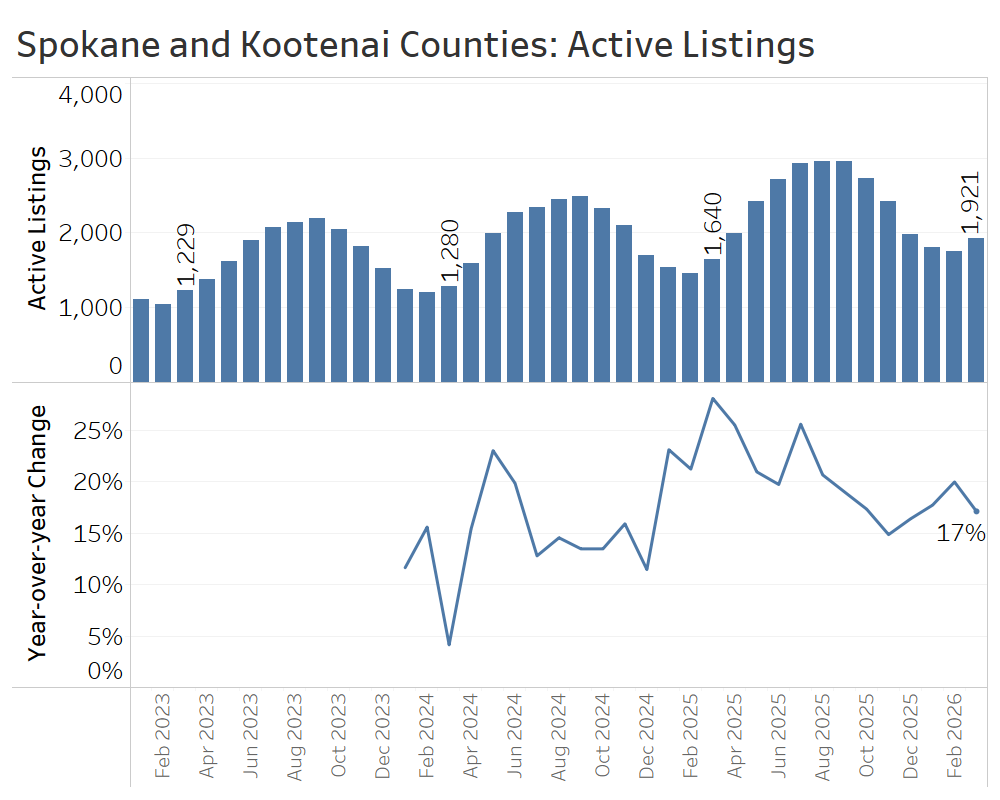
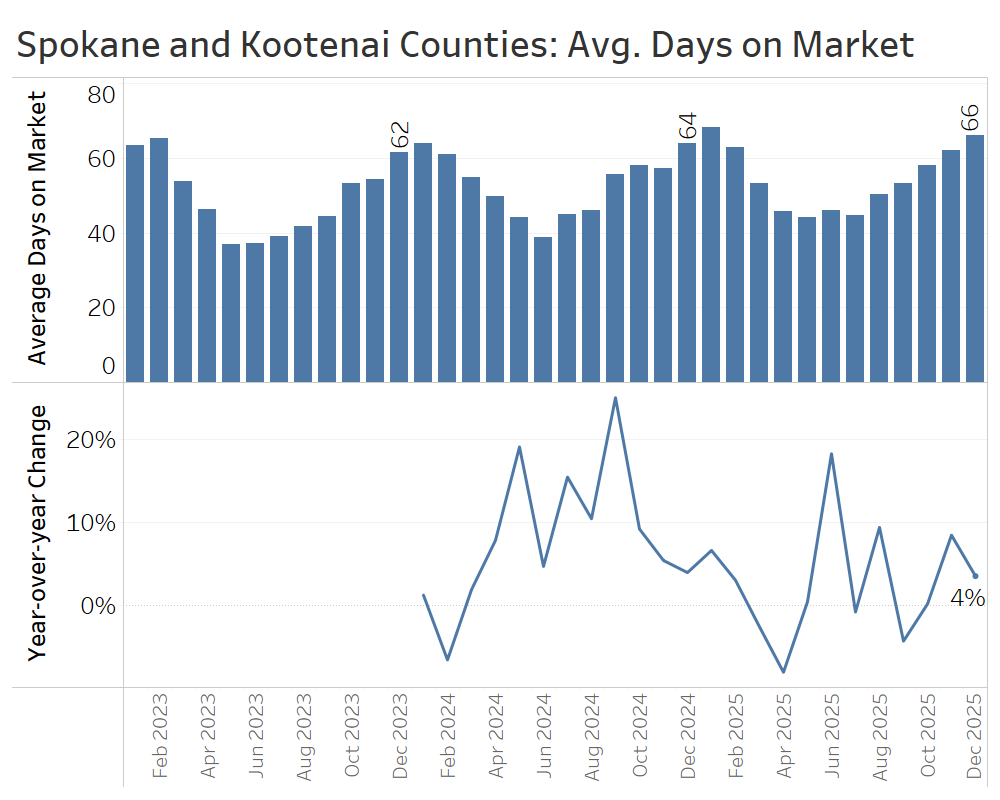
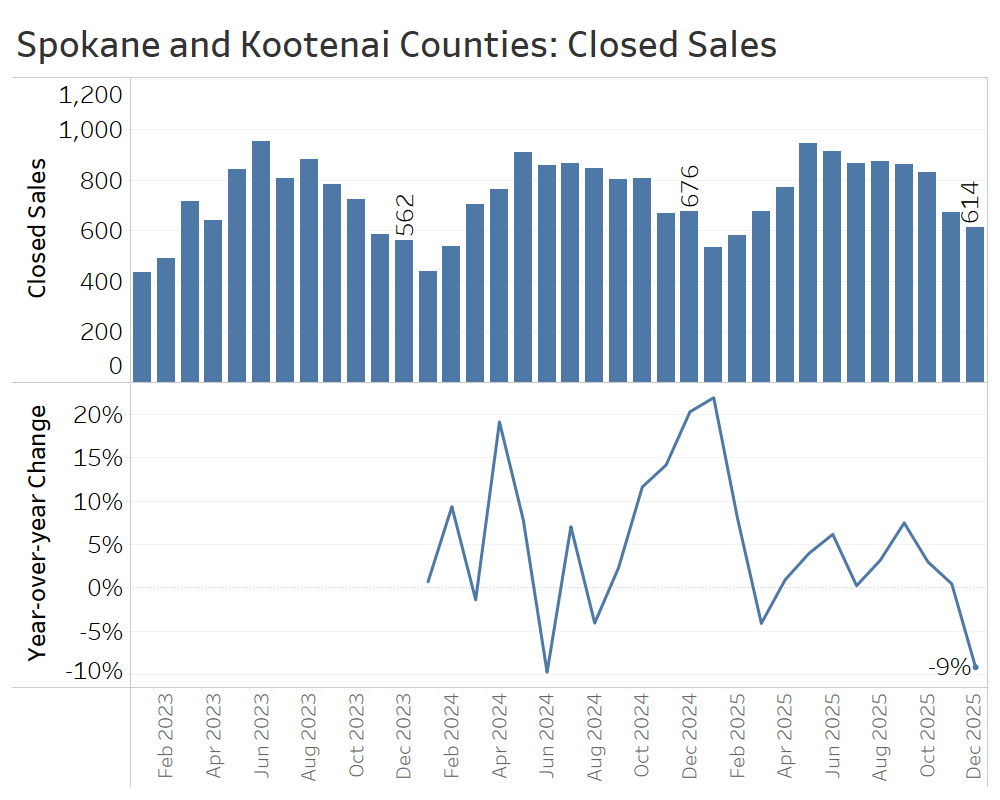
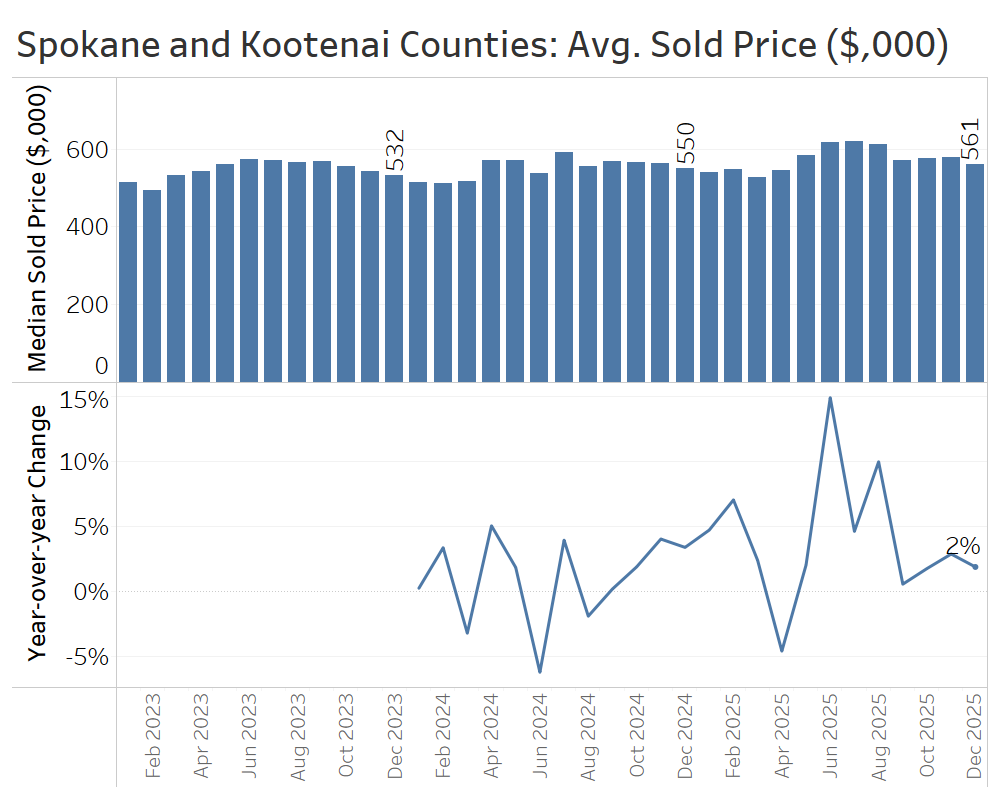
Spokane, WA and Coeur d’Alene, ID Area (Spokane and Kootenai Counties)
The greater Spokane-Coeur d’Alene region, spanning the Washington-Idaho border, is experiencing many of the same market trends seen in Western Washington, including higher inventory, softer buyer demand, and flattening home prices.
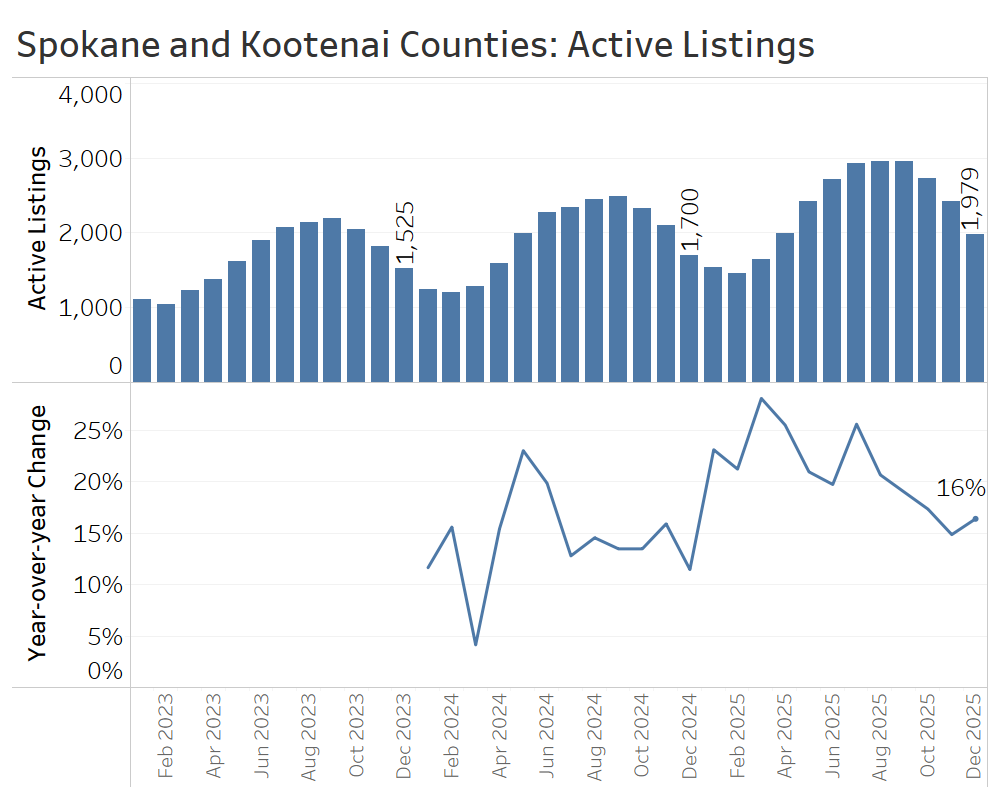
At the end of March, there were 1,921 active listings, up 17% from March 2025.
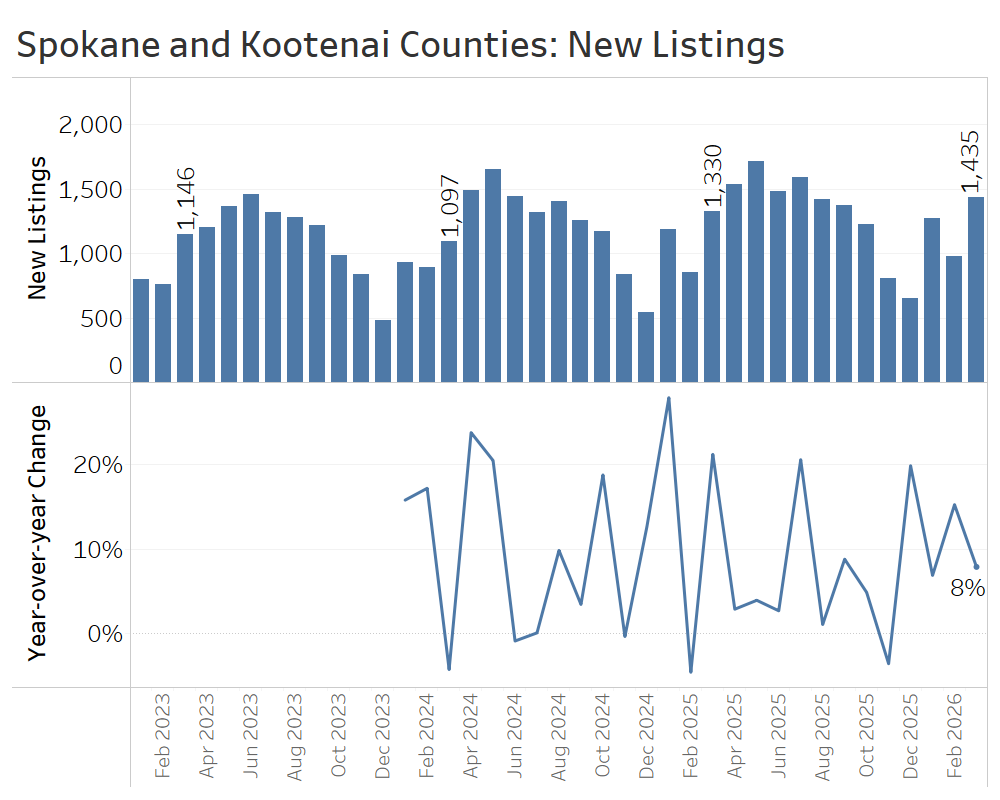
The greater Spokane area has seen strong growth in new listings since December. During the first quarter, there were 3,688 new listings, up 9% from the first quarter of 2025.
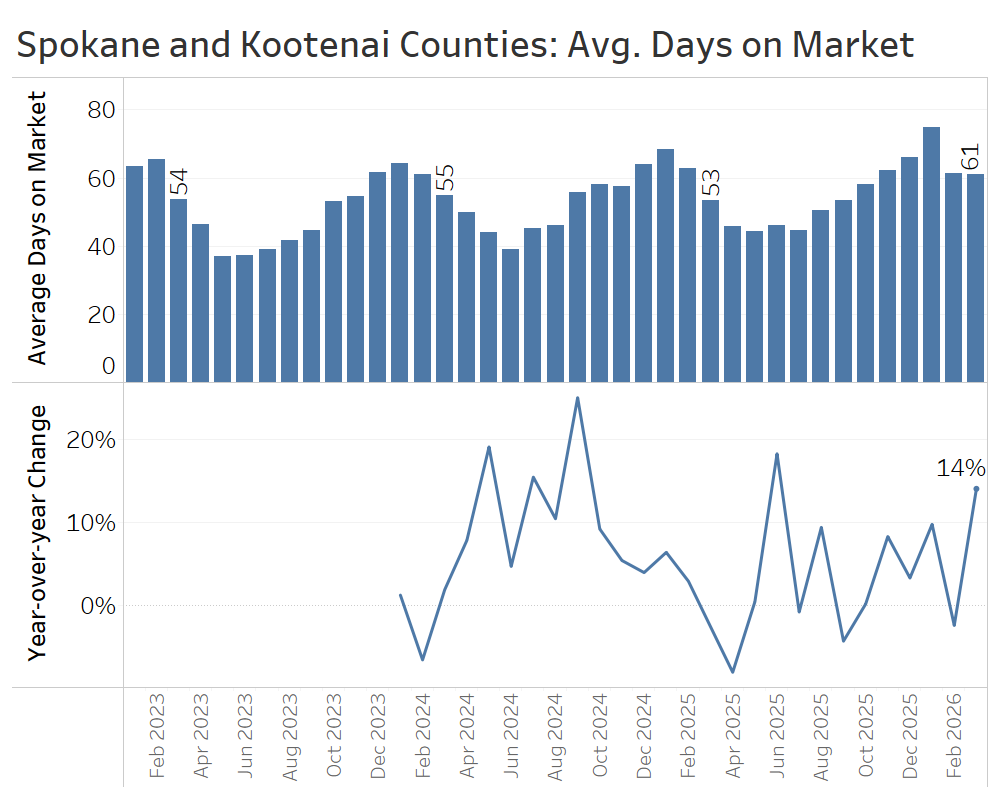
Days on market fell from its seasonal winter high to 61 days in March, though that is still 8 days slower than in March of 2025. That average also masks a wide gap across the state border, between 94 average days on market in Kootenai County compared to roughly half that—46 days—in Spokane County.
Closed sales were up 5% in March, helping to offset a weak January so that first-quarter closed sales totaled 1,817, about 1% more than first quarter of 2025.
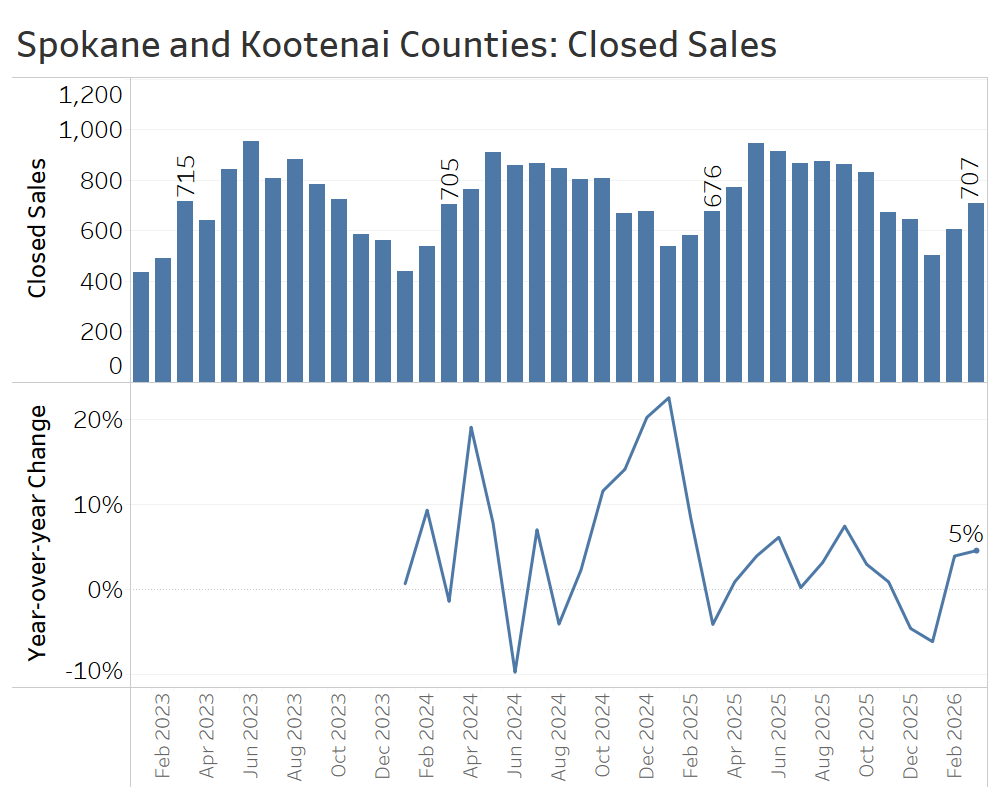
Compared with March 2025, the average sale price in March rose about 6%, from $528,000 to $559,000. For the quarter as a whole, prices increased 2%, rising from $537,000 in the first quarter of 2025 to $550,000 in the first quarter of this year.
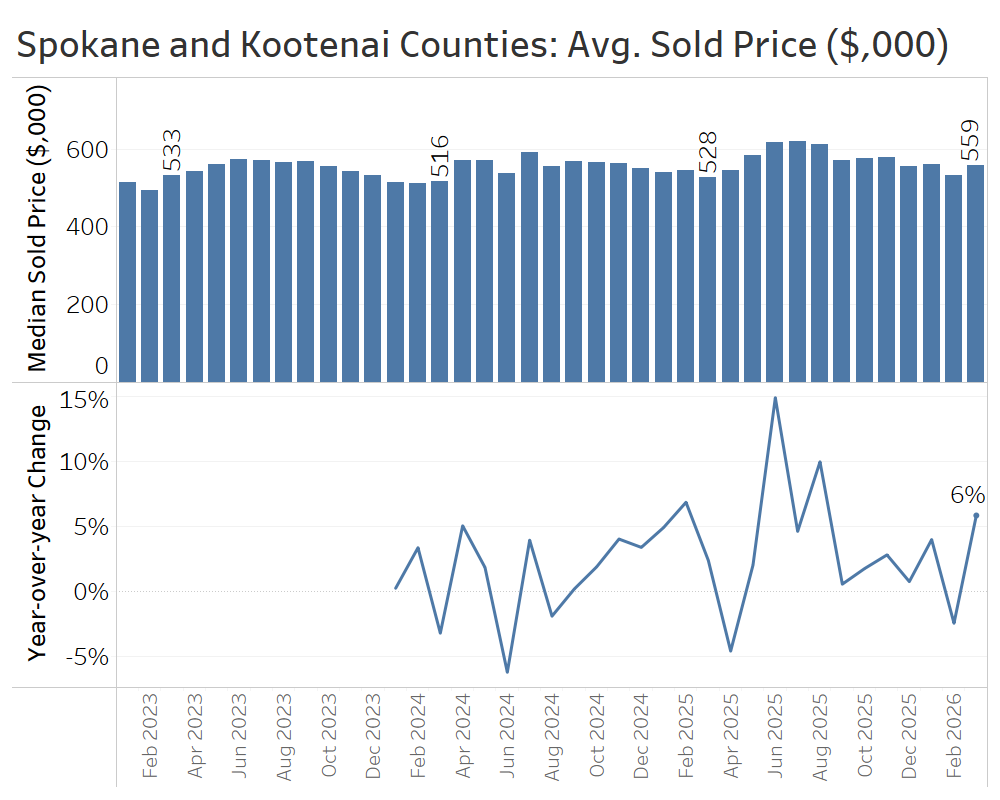
Altogether, the greater Spokane-Coeur d’Alene area has looked like a balanced market so far this spring, with modest year-over-year gains in both sales (1%) and average sale prices (2%).
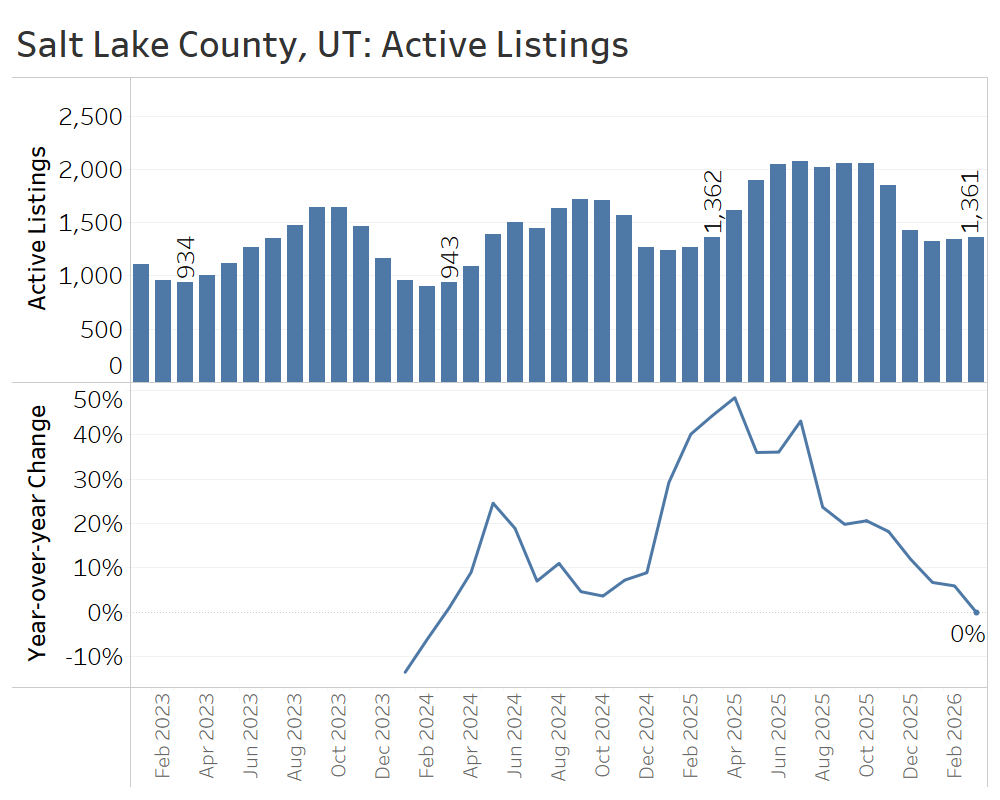
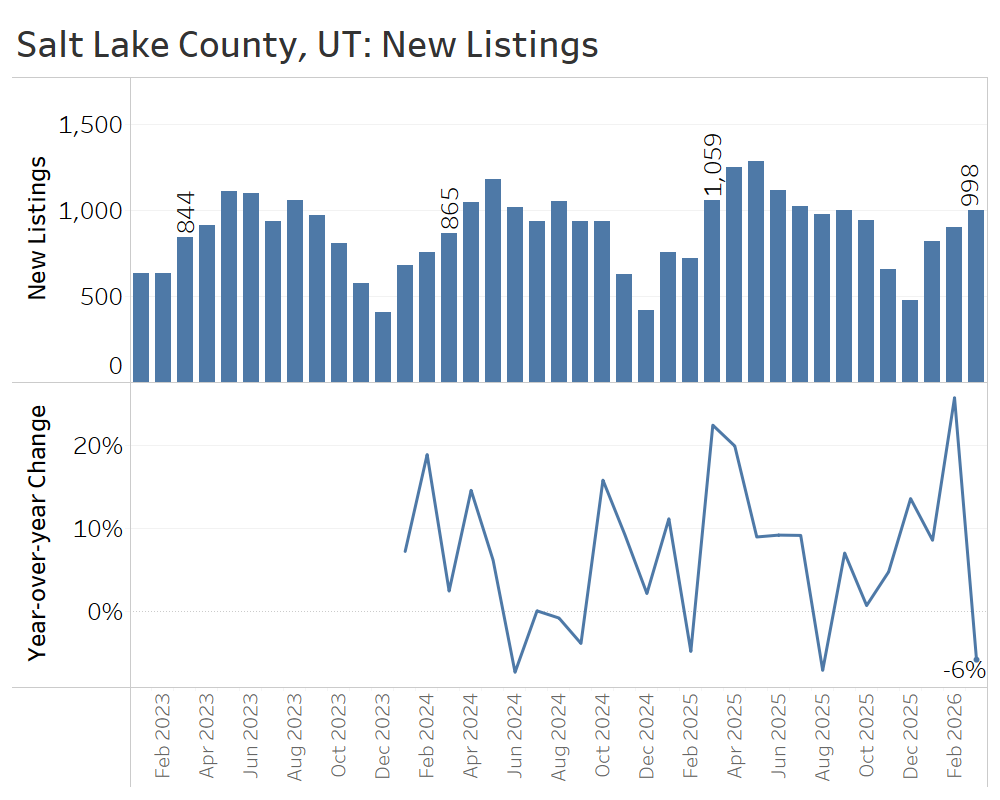
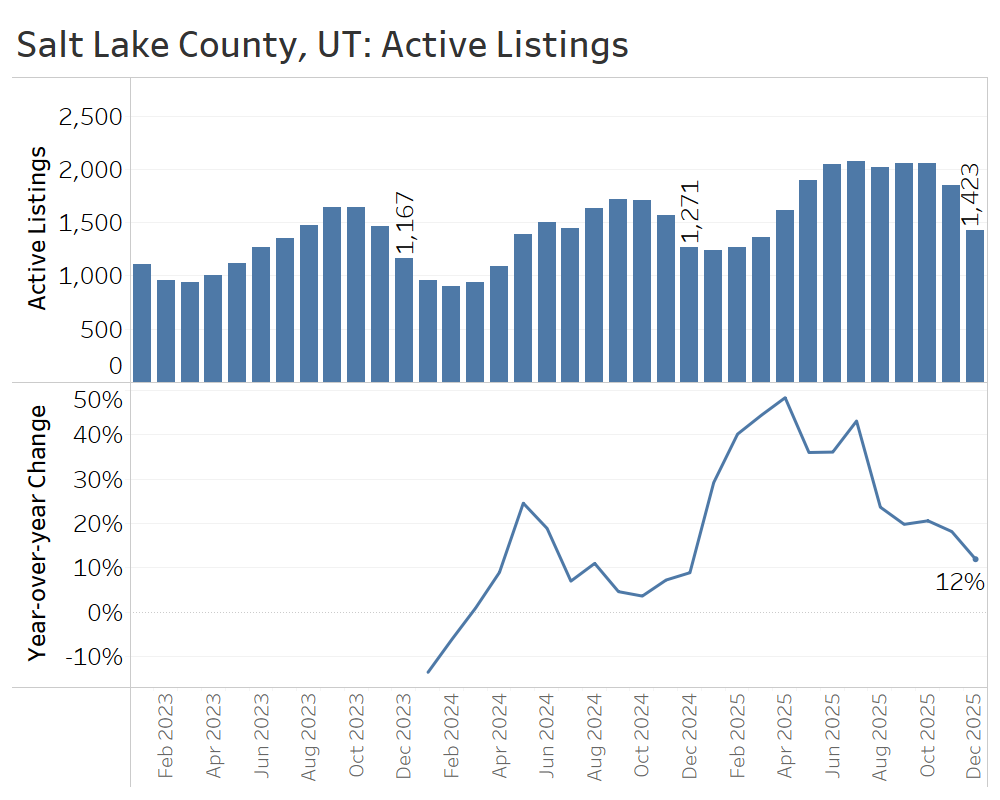
Salt Lake County, Utah
In the first quarter of 2026, the Salt Lake County market saw strong sales activity and the clearing of an inventory overhang. That continues a broader shift in Utah’s largest market, from conditions favoring buyers in early 2025 to a more balanced market—and in some segments, even a seller’s market—by spring 2026.
Active listings at the end of March stood at 1,361 homes, virtually identical to a year earlier. That completes a round trip from rapid inventory buildup last spring to slowing year-over-year growth last fall, suggesting that supply and demand have returned to a more balanced state in the Salt Lake market.
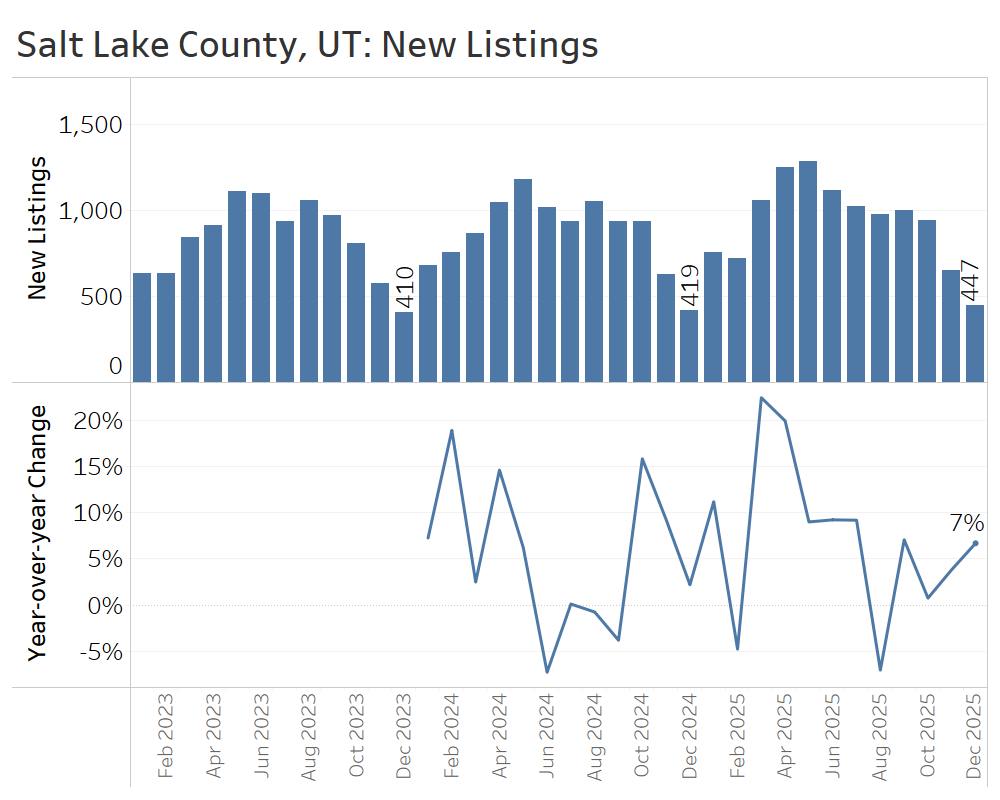
New listings dipped 6% year over year in March, but strong growth in January and February meant the flow of new listings still rose 7% in the first quarter compared to the year prior.
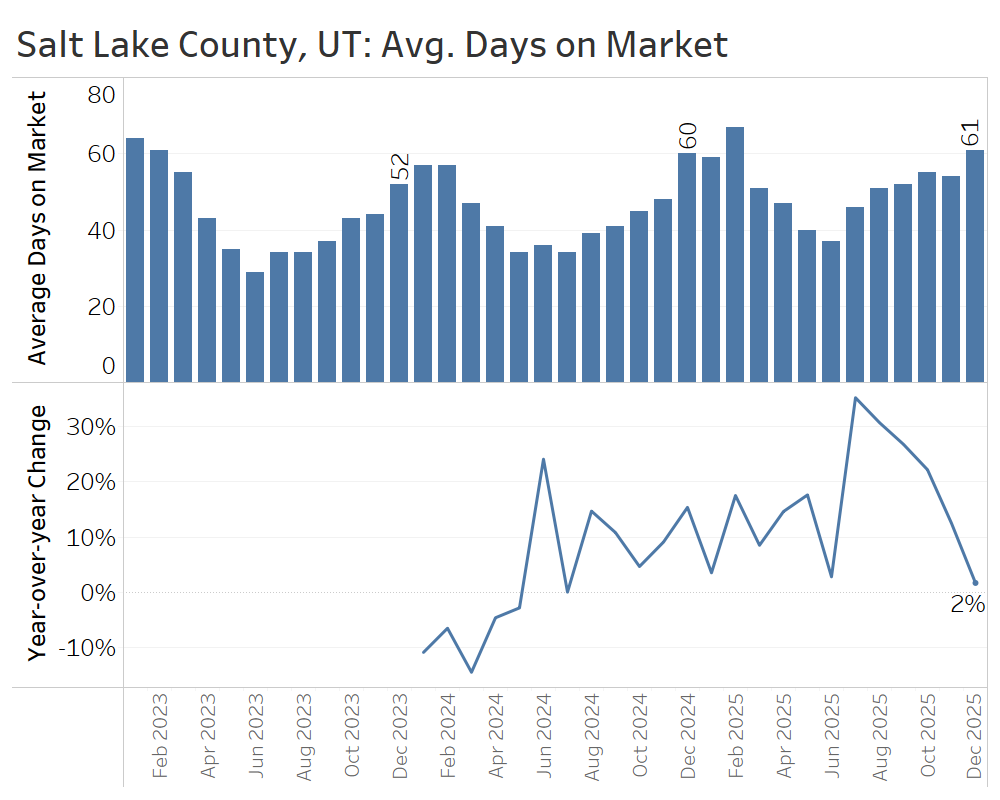
The average number of days it took to sell a home in Salt Lake County ended the first quarter at 56 days, up from 51 days a year earlier. This reflects the typical seasonal pattern of declining days on market in spring, but the year-over-year increase suggests the market has not yet shifted into a decisive seller’s market.
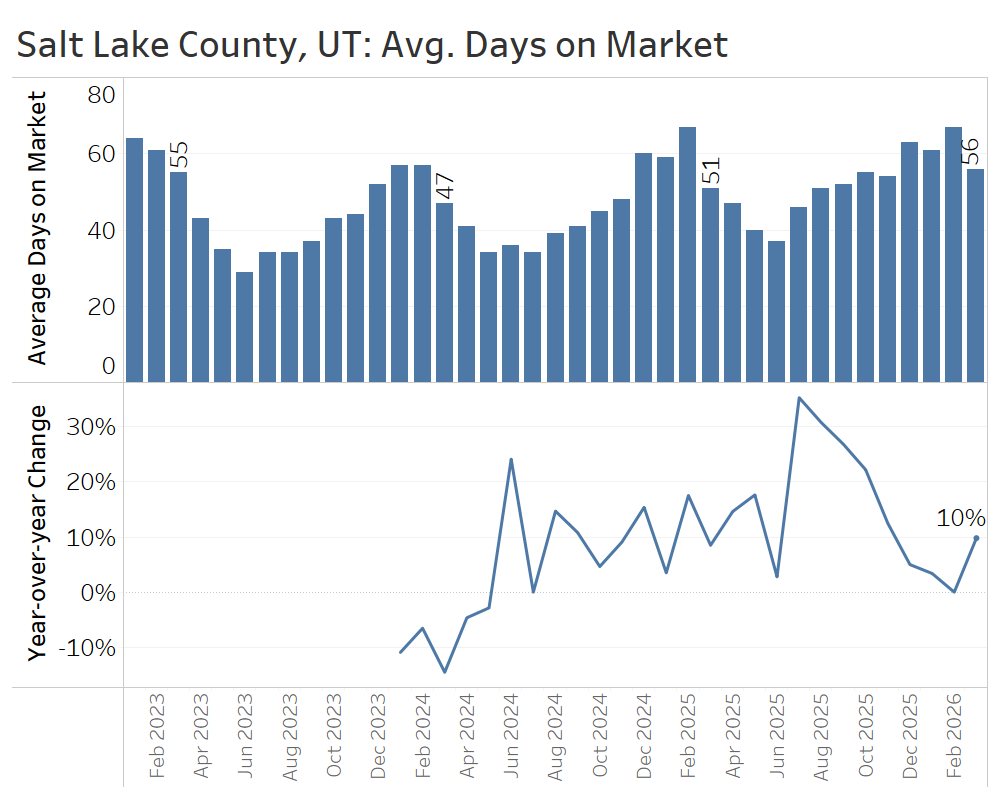
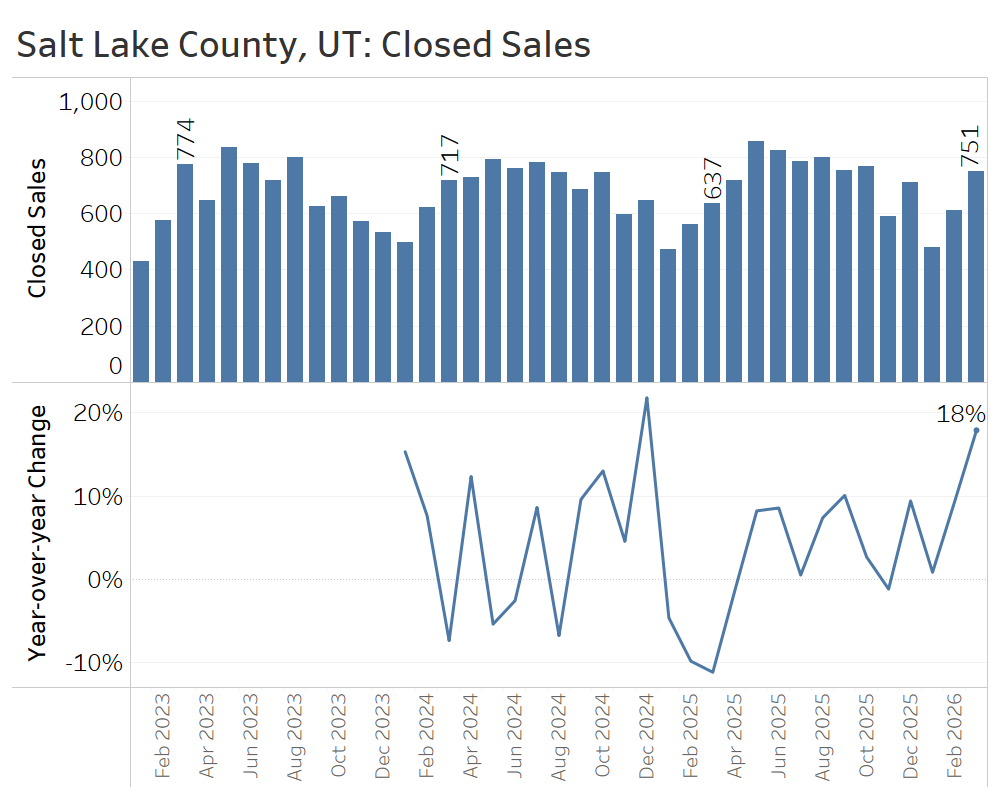
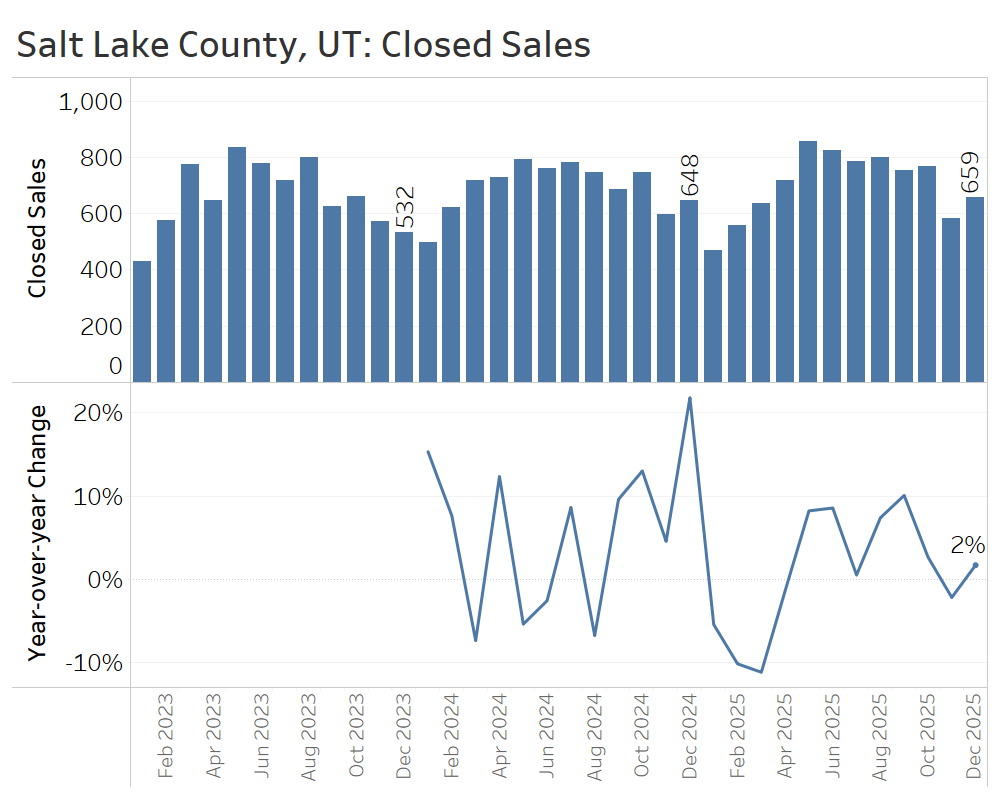
Closed home sales in March 2026 rose 18% compared to March 2025, capping a strong first quarter with about 10% more closed sales in total than in the weak first quarter of 2025.
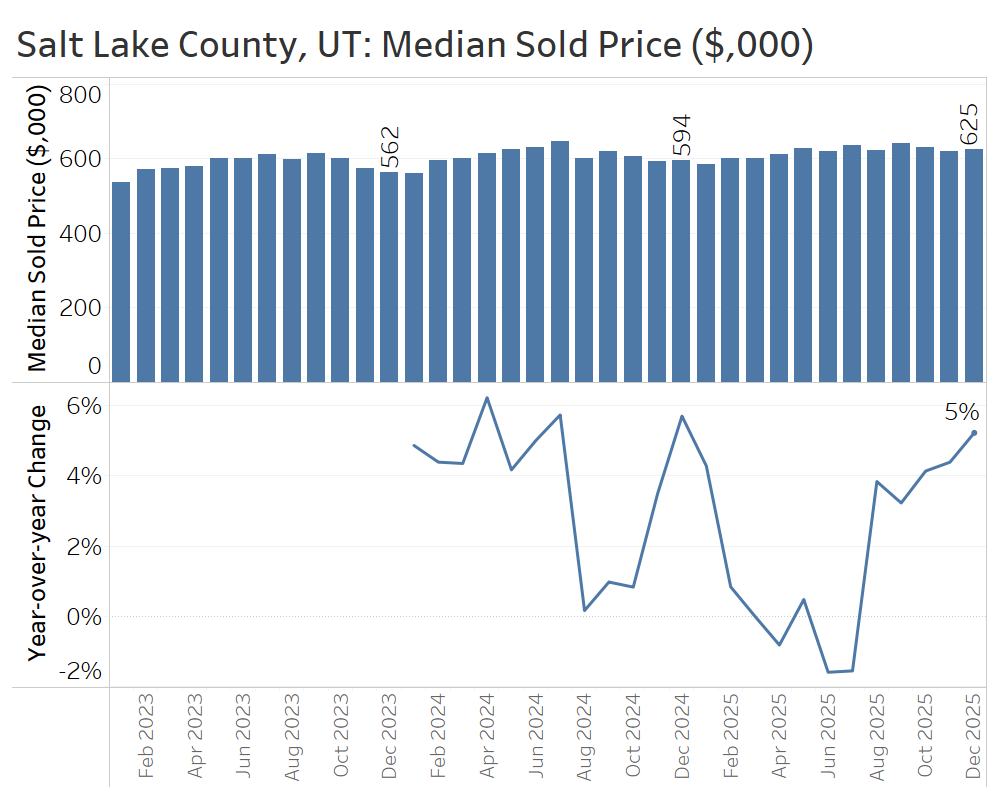
In March, the median sale price in Salt Lake County rose 2% year over year—from $600,000 to $610,000. That marked the eighth straight month of price gains but reflected a slowdown in the pace of price gains from late 2025.
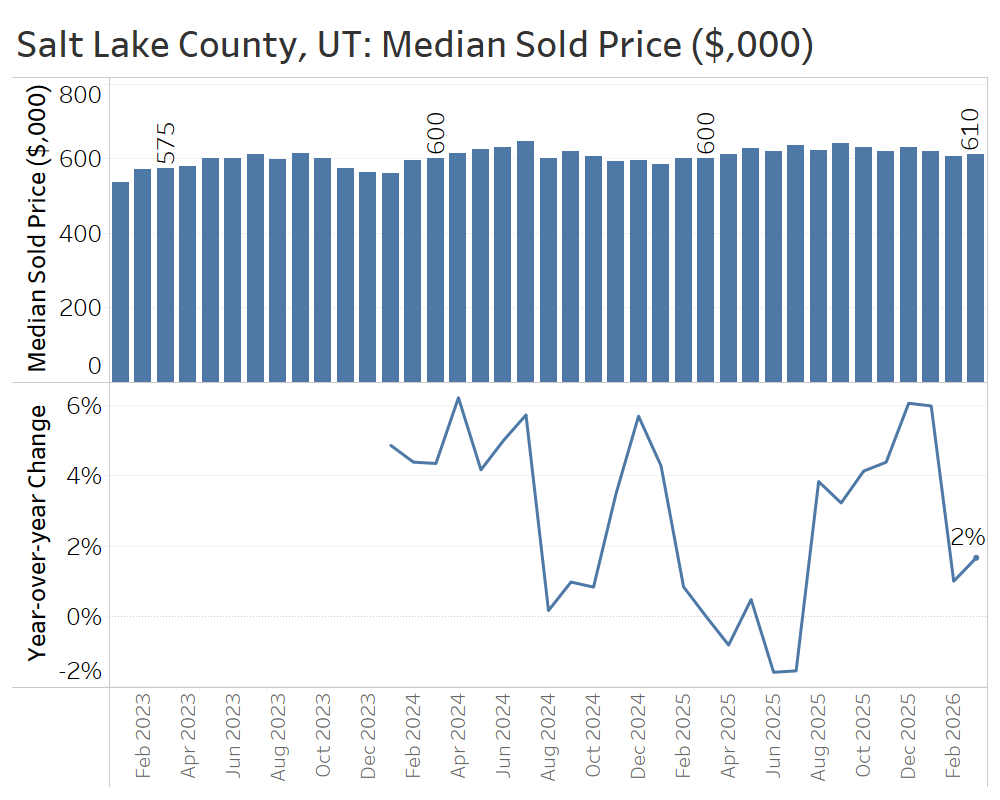
Salt Lake County’s strong start to the spring selling season was driven by growth in unit sales, not big price gains, suggesting a broad-based growth in activity as buyers return while having plenty of inventory to choose from. The lack of inventory growth year over year suggests Salt Lake County has completed its transition from a buyer’s market early in 2025 to more balanced conditions today.
Conclusion:
The housing market is cyclical, with predictable seasonal swings in demand alongside less predictable longer-term shifts. At the end of the first quarter of 2026, many of the markets highlighted here are in a somewhat unusual balance, where the seasonally strongest period of demand—the spring selling season—is meeting a broader market cooldown marked by higher inventory, longer time on market, and slower price appreciation.
That combination makes for a more difficult market to navigate than usual. Buyers may feel whiplash, moving from being outbid by a dozen offers on one home to getting a below-list offer accepted on another down the street that just needs a fresh coat of paint. Sellers, meanwhile, may decide to list their home at an aggressive price after hearing about nearby homes selling far above list price, only to wonder why they’re not receiving any offers.
In a market like this, it pays to work with a skilled real estate professional who can cut through the noise of local data to determine a home’s fair price, while also understanding the nuances of which homes are selling quickly and which are selling at a discount in this unusual spring selling season.
Sources: TrendGraphix analysis of NWMLS, RMLS, Spokane MLS, Coeur d’Alene MLS, MetroList MLS, and Wasatch Front MLS data.
Numbers to Know 4/13/26: Global Tensions Drive Rates & Market Shifts

This is the latest in a series of videos with Windermere Principal Economist Jeff Tucker, where he delivers the key economic numbers to follow to keep you well-informed about what’s going on in the real estate market.
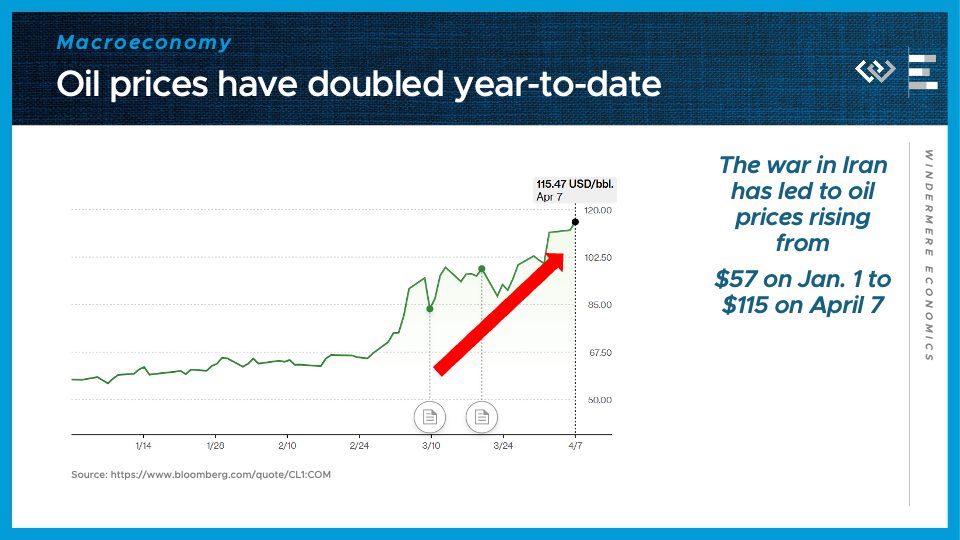
The first number to know this month: $115. That was the level that price of a barrel of oil reached on April 7, and it happens to be exactly double the price of oil at the start of 2026. The war in Iran has dragged on into its second month now, and it’s continuing to cause an energy crisis that’s rippling out through the global economy. An energy shock like this raises the costs of making and transporting almost everything, so the longer this goes on, the more inflationary pain it will inflict this year.
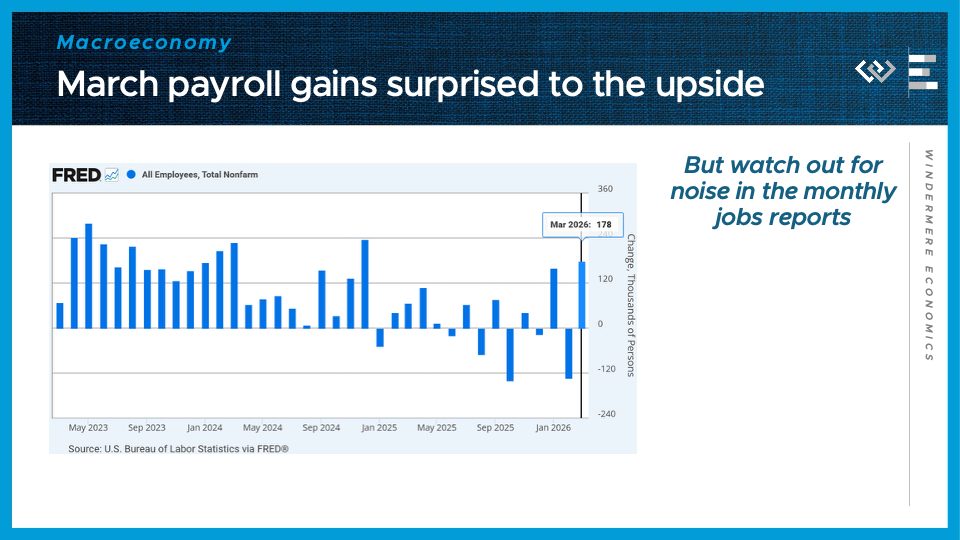
The second number to know this month 178,000. That was the number of jobs added in the economy in March, which would make it the single best month for job gains since late 2024, if it survives the usual rounds of revisions. If we look at the trend of the last 15 months, though, it’s pointing both toward a slowdown in job gains, and a increasing month-to-month volatility, as we’ve now swung between job gains and job losses for 11 months in a row. One upshot of this strong jobs report is that it provides further cover for the Federal Reserve to keep interest rate cuts on hold for now – if the labor market isn’t looking too distressed, they don’t need to be rushing to the rescue.
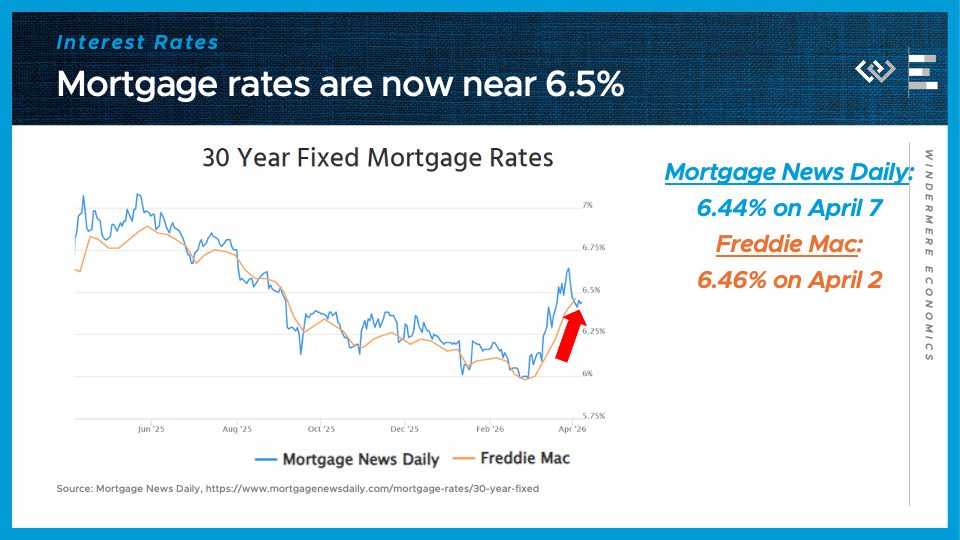
The third number to know this month: 6 and a half percent. That’s the ballpark of where 30-year mortgage rates are now bouncing around, after jumping almost half a point from multi-year lows they reached just back in late February. The combination of higher inflation and tighter monetary policy triggered by the war in Iran has set interest rates back up to where they were last summer, and frankly into the range of where they stood last spring. This is undermining homebuyer demand in what should be the busy spring buying season, leading instead to more balanced conditions in the housing market.
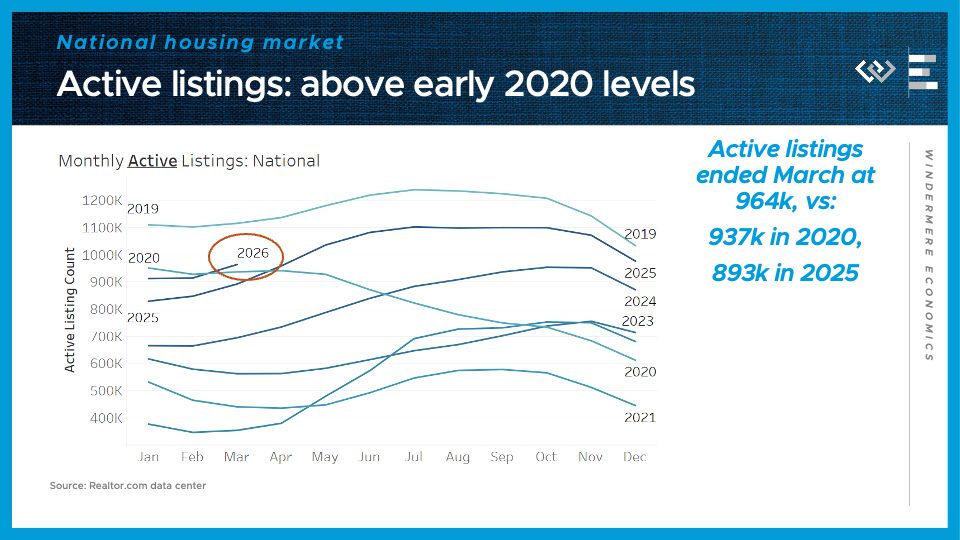
Finally, turning to the housing market, we saw 964 thousand active listings at the end of March—somewhat more than at this time in 2020, and about 8% more than last year.

That 8% year-over-year gain basically matches what I reported in February, bringing an end to a trend of decelerating inventory growth since last May. It’s a little early to call this a turning point, but it may be an indication that inventory gains are picking back up. If that continues, buyers could really see a plethora of options on the market this summer. In the meantime, sellers should be aware that buyers are comparison-shopping, so it still pays to put your best foot forward, listing with an agent you trust, even in the busy spring selling season right now.
Local Look Western Washington Housing Update 3/11/26
Hi. I’m Jeff Tucker, principal economist at Windermere Real Estate, and this is a Local Look at the February 2026 data from the Northwest MLS.
We are now on the cusp of the busy spring selling season, and the data so far in 2026 point to a market that’s relatively balanced for buyers … for this time of year.
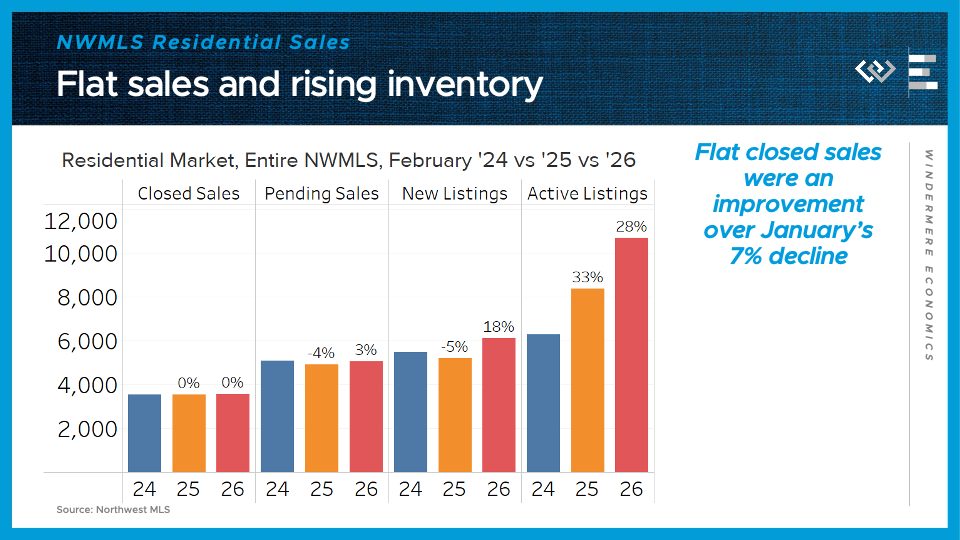
Across the Northwest MLS, there were almost exactly the same number of closed home sales as in February 2025, or the prior February for that matter. And pending home sales ticked up by 3%.
On the supply side, the flow of new listings was up a whopping 18% from last February’s pace. Finally, the month ended with 28% more active listings than last February. That’s a major uptick in inventory, and even the pace of that growth has now accelerated.
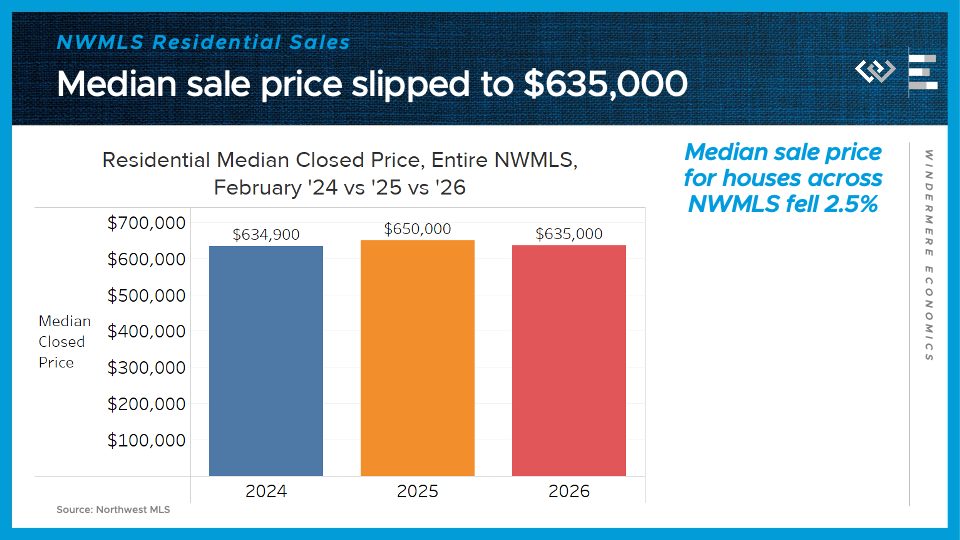
More negotiating leverage for buyers translated into lower home prices in February: down 2 and a half percent from last year, or basically back to 2024’s level.
Now for a closer look at the four counties encompassing the greater Seattle area.
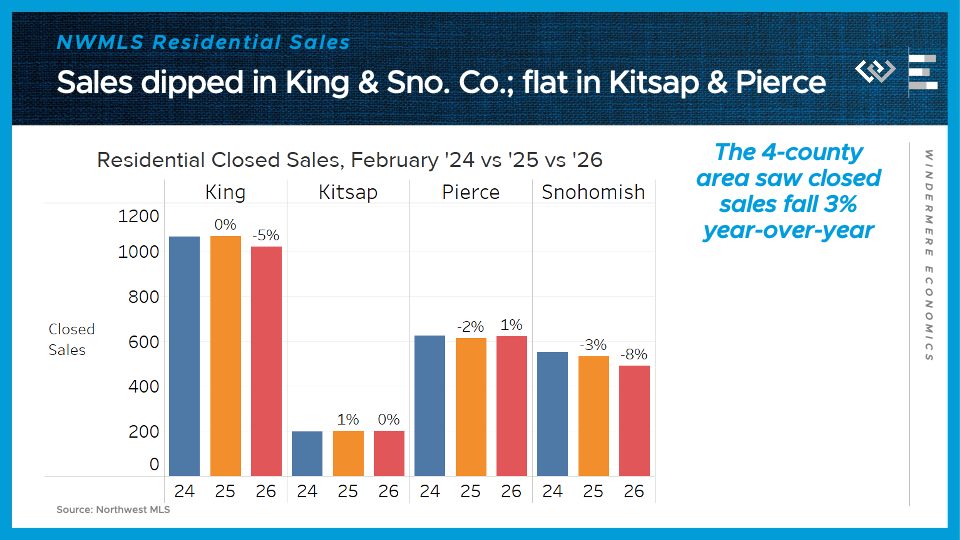
Closed sales dropped by 3% from last February around the region, which looked like a modest dip compared to January’s 9% decline. Once again Snohomish County had the biggest decline, followed by King County, while Kitsap and Pierce Counties’ sales volumes have held steady.
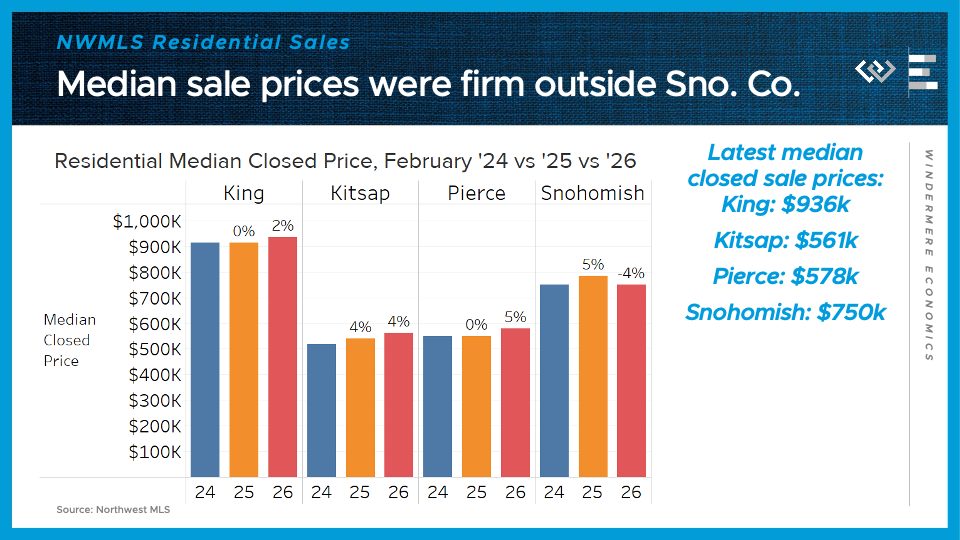
Median sale prices were mostly firm around the region, combing 2% in King, 4% in Kitsap, and 5% in Pierce County. Snohomish County, though, saw prices step back down to 2024 levels.
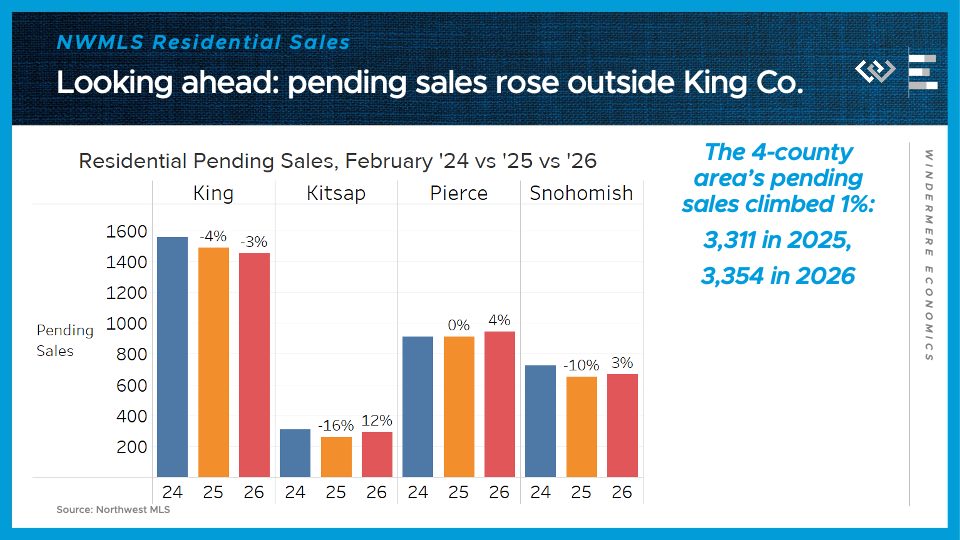
Looking ahead, pending sales climbed 1% across the region in February, buoyed by a big bounce back in Kitsap, and modest growth in Pierce and Snohomish Counties. Only King County saw a modest dip in pending home sales.
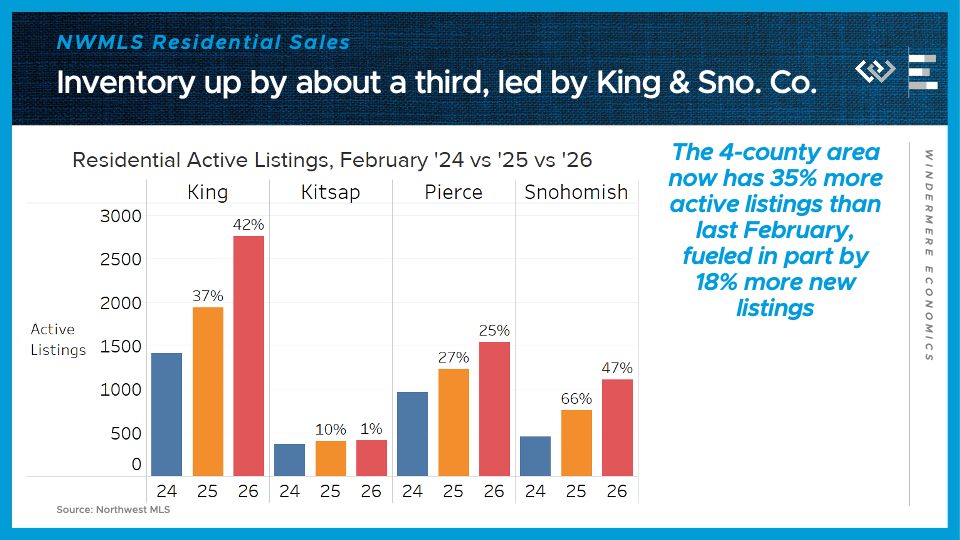
On the supply side, the 4-county greater Seattle area ended the month with 35% more active listings than last February, led by 47% growth in Snohomish County and 42% growth in King County. I think in those two core, higher-cost counties, buyers will see an unusually favorable spring buying season, thanks in part to a boost in listings from homeowners who de-listed last year and are now returning to the market.
Looking ahead to March and April, I think the big question is whether buyers feel emboldened by higher inventory and lower mortgage rates, or spooked by geopolitical turmoil and rising gas prices. As it stands, they will have more homes on the market to choose from than any spring in recent memory.
Numbers to Know 2/18/26: The Latest Economic & Housing Update

This is the latest in a series of videos with Windermere Principal Economist Jeff Tucker, where he delivers the key economic numbers to follow to keep you well-informed about what’s going on in the real estate market.
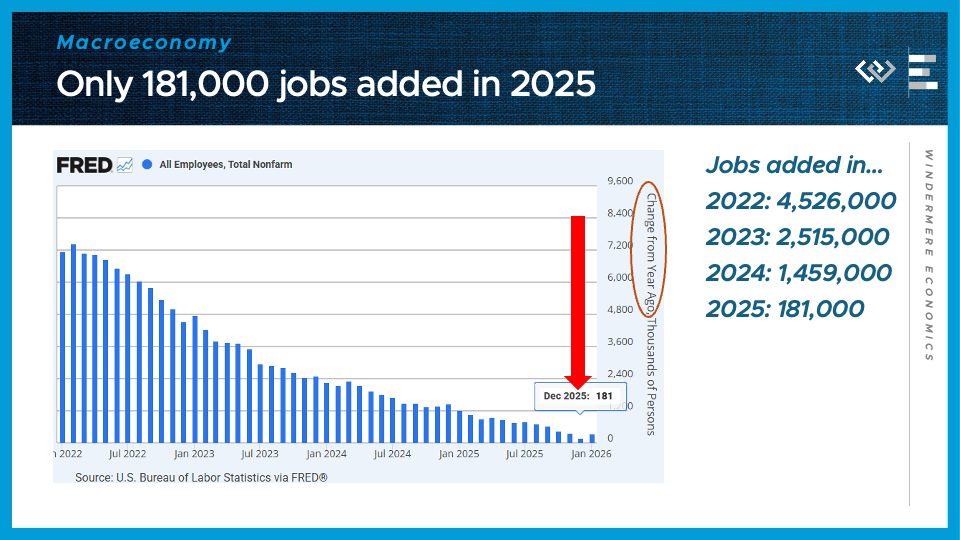
I’ll start with some bad news and some good news from the latest jobs report. The first number to know this week is the bad news: 181,000. That’s the total number of jobs added in the entire year of 2025, according to the latest data from the Bureau of Labor Statistics, which follow a standard annual revision updating their models to match more accurate but less timely data sources. These revisions drove home the conclusion that job growth basically stalled out in 2025, and was much worse than even the weak monthly payrolls reports were showing us. That total job growth compares to previous annual totals in the millions, although the trend of slowing growth has been clear for quite some time.
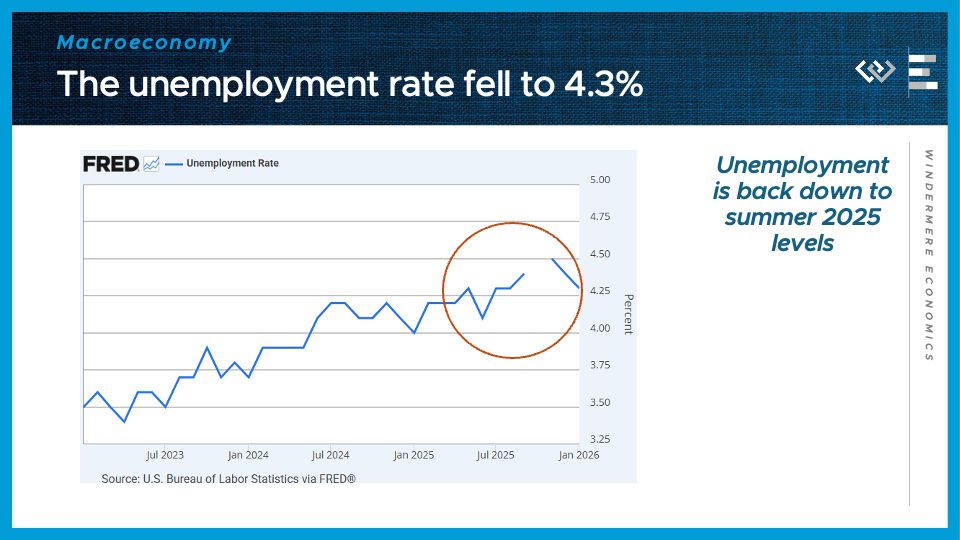
The second number to know this week was the good news in the latest jobs report: 4.3%. That’s the unemployment rate in January, which stepped down again, from a high in November of 4.5%, bringing it back down to summer 2025 levels. That’s one indication that the labor market MAY have begun to turn the corner this winter, with some modest improvement to start the year after several straight months of weakening. These are just preliminary numbers, but coupled with what we know will be strong economic tailwinds from the huge tax cuts in last year’s budget bill, the stage seems to be set for stronger economic growth this spring.
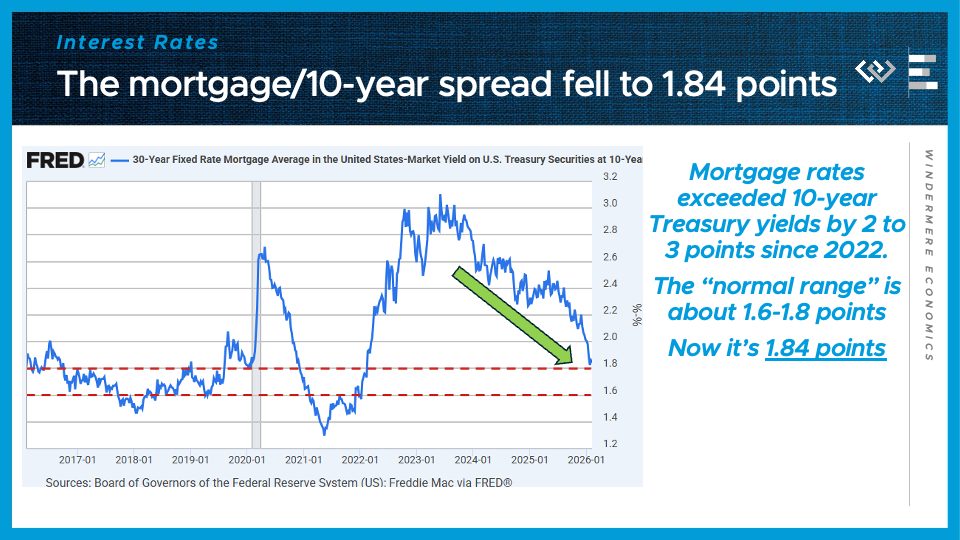
The third number to know right now: 1.84 percentage points. That was the average spread, or how much higher 30-year mortgage rates were than the benchmark 10-year Treasury yield in the first week of February. That means we are knocking at the door of a normal spread after almost four years of a really abnormally wide spread. This was a major culprit in the pain that homebuyers felt trying to get a mortgage. Last month I talked about the surprise announcement that Fannie Mae and Freddie Mac would be buying mortgage-backed securities, and I think the proof is in the pudding that the news of that purchasing plan helped bring this spread down by that last 30 basis points just in the last month.
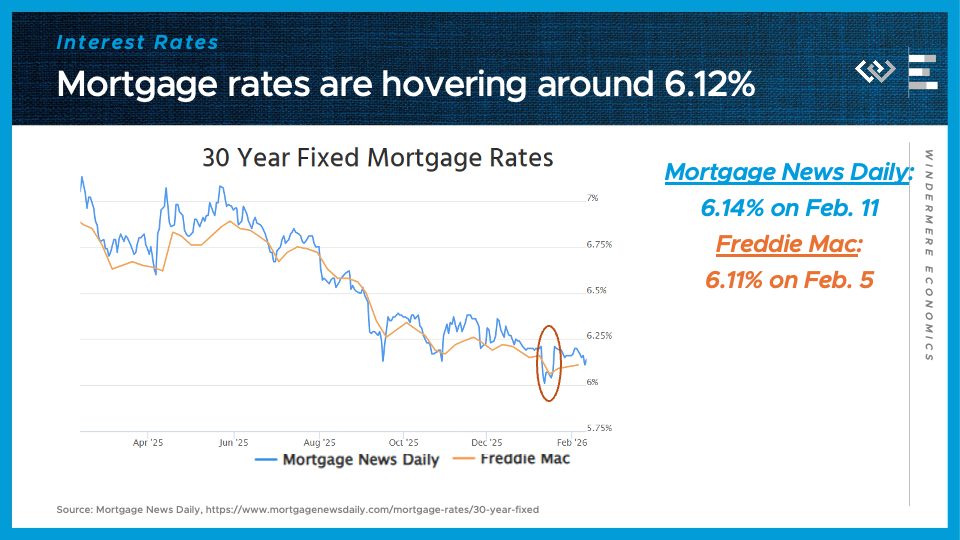
So where are mortgage rates now? Well, they’ve been hovering around 6 and an eighth all year, which is an improvement from this time in 2025 of at least half a point, maybe ¾ or a whole point, for most borrowers. I think the takeaway here is that we’ve now seen most of the improvement to mortgage rates that we were expecting from that spread closing, which is a little bittersweet – it’s great news that it happened, but now that potential avenue for rate improvement has run its course, which makes me less optimistic about prospects for further rate declines in the near term. It’ll depend instead on the overall interest rate and inflation environment cooling down, and those prospects look a lot dicier: the big increase in borrowing that the budget bill is kicking off this year will tend to push up Treasury yields, and the boost to economic growth should also keep inflation elevated. So my takeaway for anyone considering a mortgage is that rates have come down a lot, and there’s no point waiting on the sidelines in hopes of further declines, given what we can expect in the year ahead.
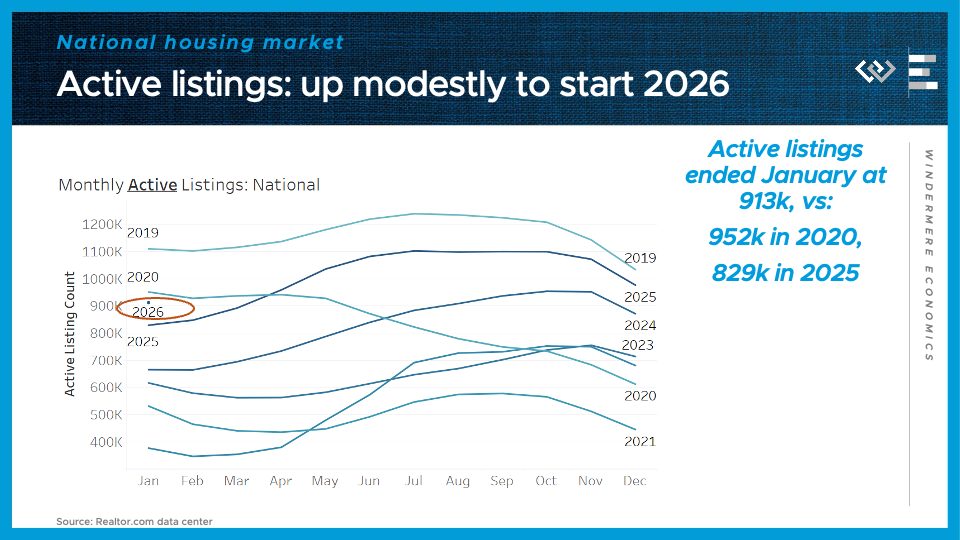
Turning to the housing market, we saw 913,000 active listings at the end of January, which is the most since January 2020, on the eve of the pandemic. In other words, nationally, inventory is finally nearly back to normal.
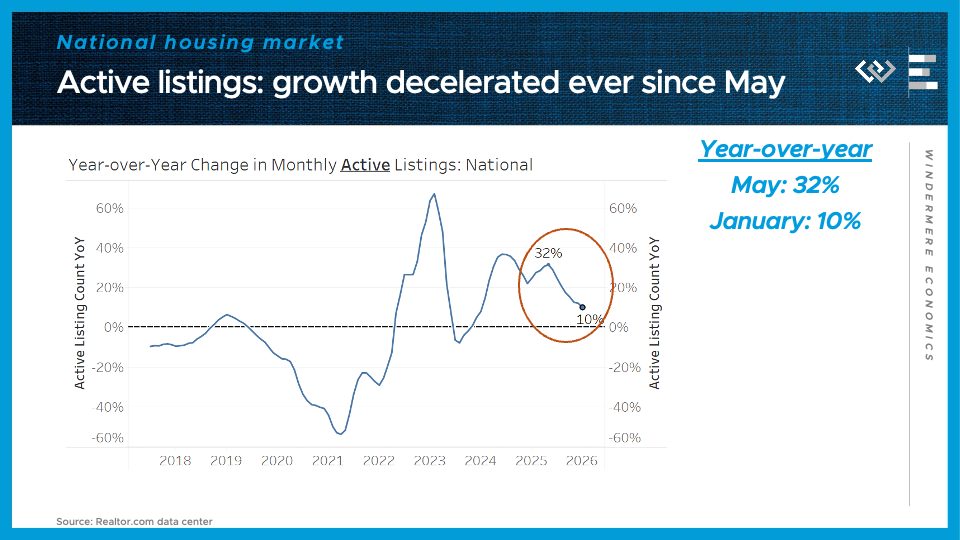
That 10% growth in inventory continues a consistent trend since last May, of active listings growing but at an ever slower pace. I think there’s good news for everyone in that fact: buyers will have more options to choose from this spring, and sellers don’t need to worry about competing against a glut of inventory, but they should be prepared to put their best foot forward when they list their home this spring, because it’s always worth it to stand out from the competition.
Fourth Quarter Regional Real Estate Report

This is a recurring series of blog posts taking a closer look at the U.S. economy and several major regional markets in Windermere’s nine-state footprint. Updates will be released on a quarterly basis.
Economic Overview
Last year did not deliver the hoped-for breakout from the low-sales housing market that has persisted since interest rates skyrocketed in 2022. Just over four million existing homes sold in 2025 – nearly identical to the totals in 2023 and 2024.
Mortgage rates edged lower in the fourth quarter, falling from an average of 6.35% in September to 6.19% in December. That downward trend continued into early 2026, particularly following the announcement that Fannie Mae and Freddie Mac would purchase additional mortgage-backed securities.

Source: Freddie Mac via FRED.
The labor market continued to soften in the fourth quarter, with negative total payroll changes after anemic job growth in the third quarter.

Source: BLS via FRED.
The following is a detailed overview of housing trends across six regional markets within Windermere’s footprint during the fourth quarter of 2025. They include the Greater Seattle Area, Greater Portland Area, Greater Sacramento Area, Northwest Washington State, the Spokane, WA and Coeur d’Alene, ID markets, and Salt Lake County, UT.
Greater Seattle Area (King, Snohomish, Pierce, and Kitsap Counties)
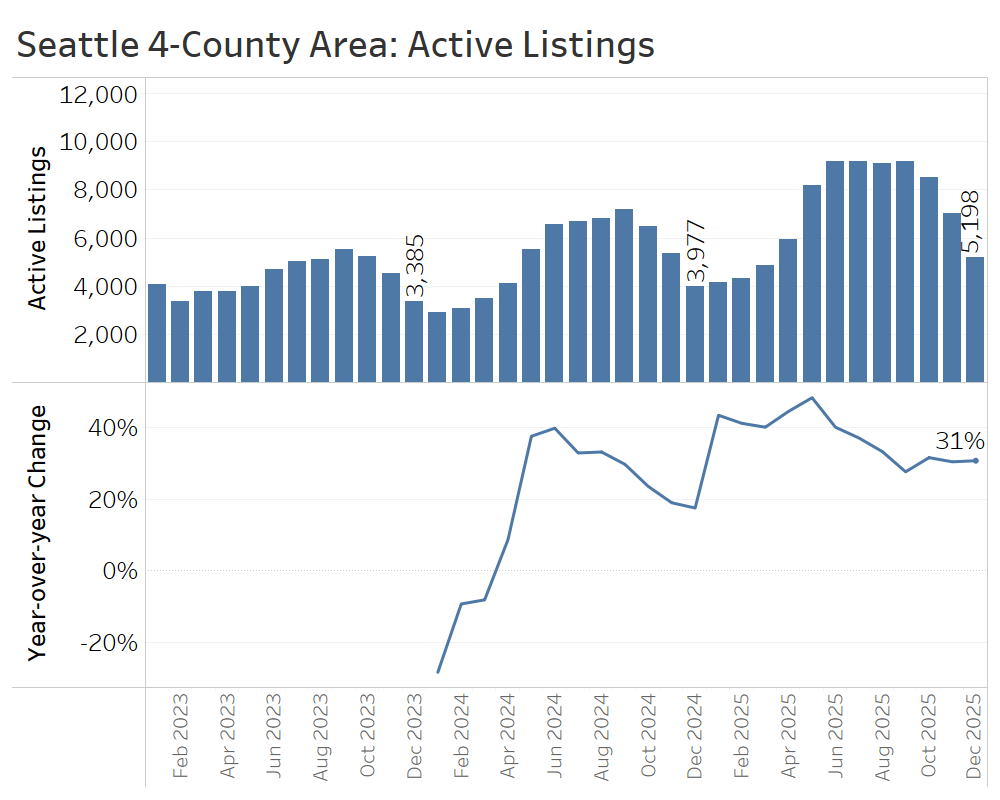
The fourth quarter cemented the defining themes of 2025 for the Seattle-area housing market: higher inventory and more negotiating power for buyers. Active listings totaled nearly 5,200 at year-end, which was 31% higher than at the end of 2024, yet well below the more than 9,000 listings on the market as recently as September, reflecting the typical seasonal pullback in the fall.
The fourth quarter is typically the low-water mark for new listings, and 2025 was no exception: just under 1,700 new listings hit the market in December, barely 2% more than a year earlier. That modest year-over-year increase marked a major cooldown from the faster pace of new-listings growth seen earlier in the year.
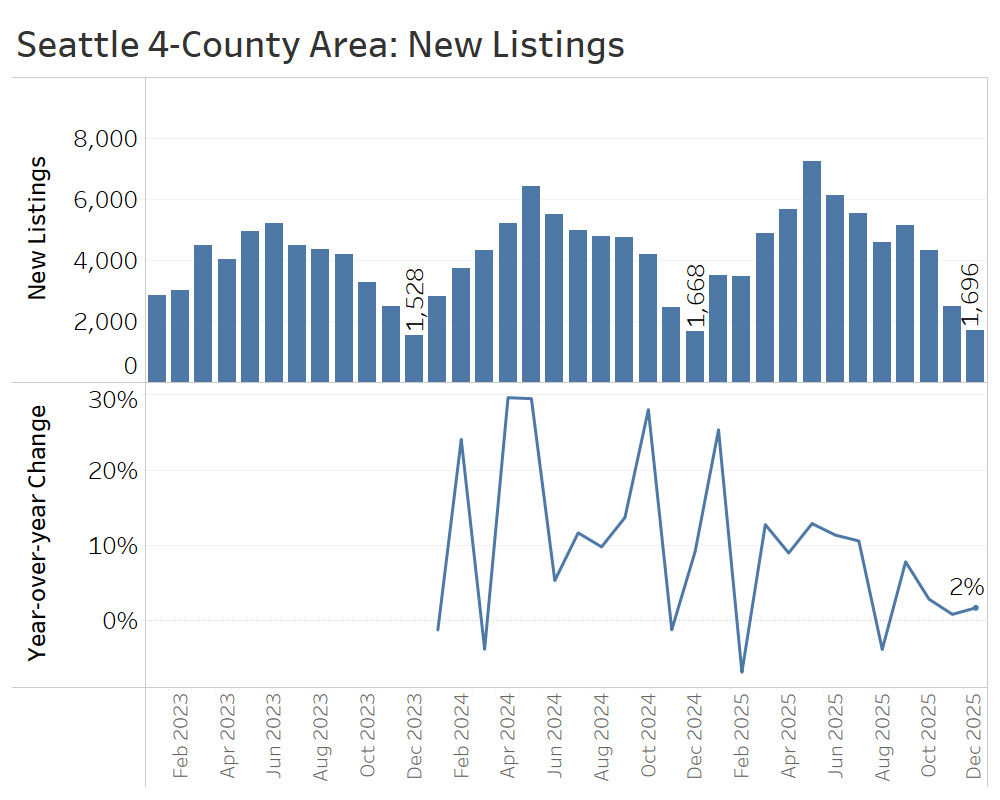
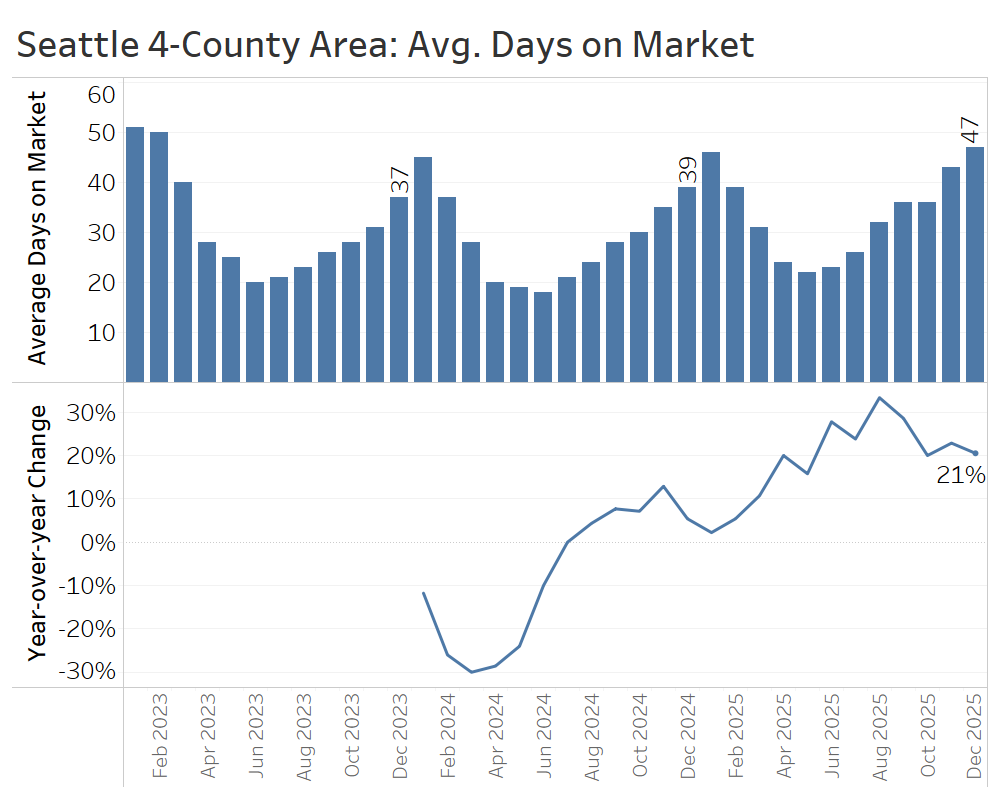
Listings continued to linger on the market longer in the fourth quarter compared to the prior year. In December, homes averaged 47 days on market, up from 39 days in December 2024. January will likely mark the seasonal high-water mark before time on market plunges with the onset of the spring selling season later in the first quarter.
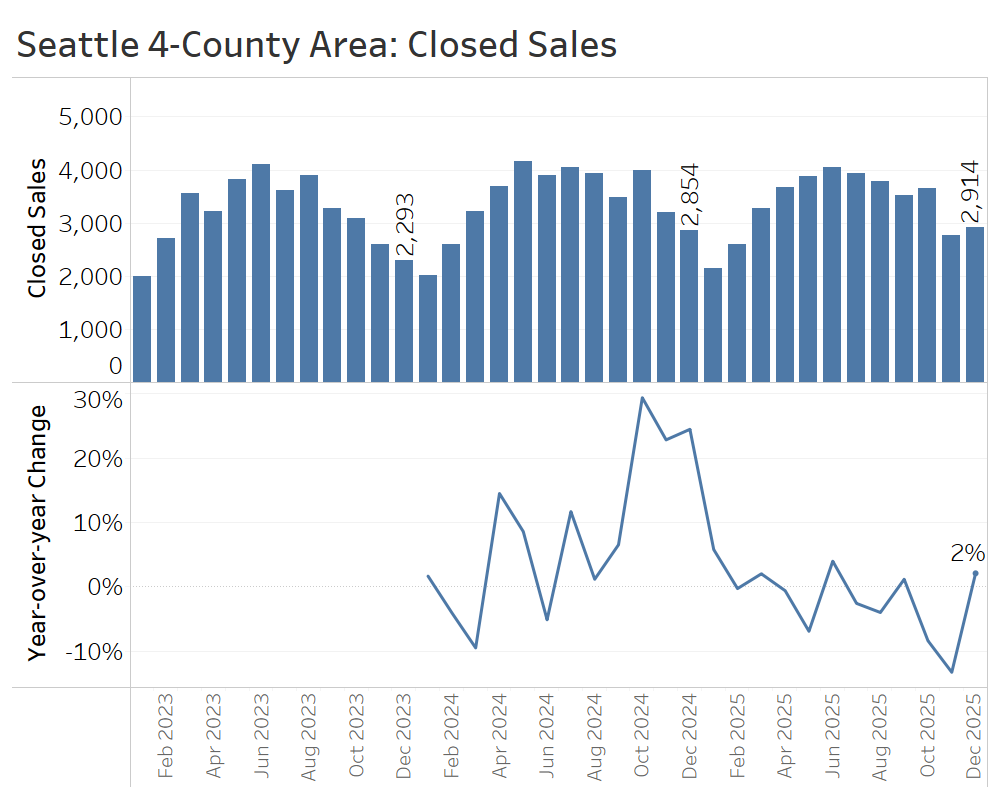
Closed sales in the fourth quarter generally fell short of fourth-quarter2024 levels, which were boosted by a frenzy of buyer activity following the Federal Reserve’s initial interest rate cuts in September of that year. Closed sales year over year declined 8% in October and 13% in November, before rebounding to a 2% year-over-year increase in December.
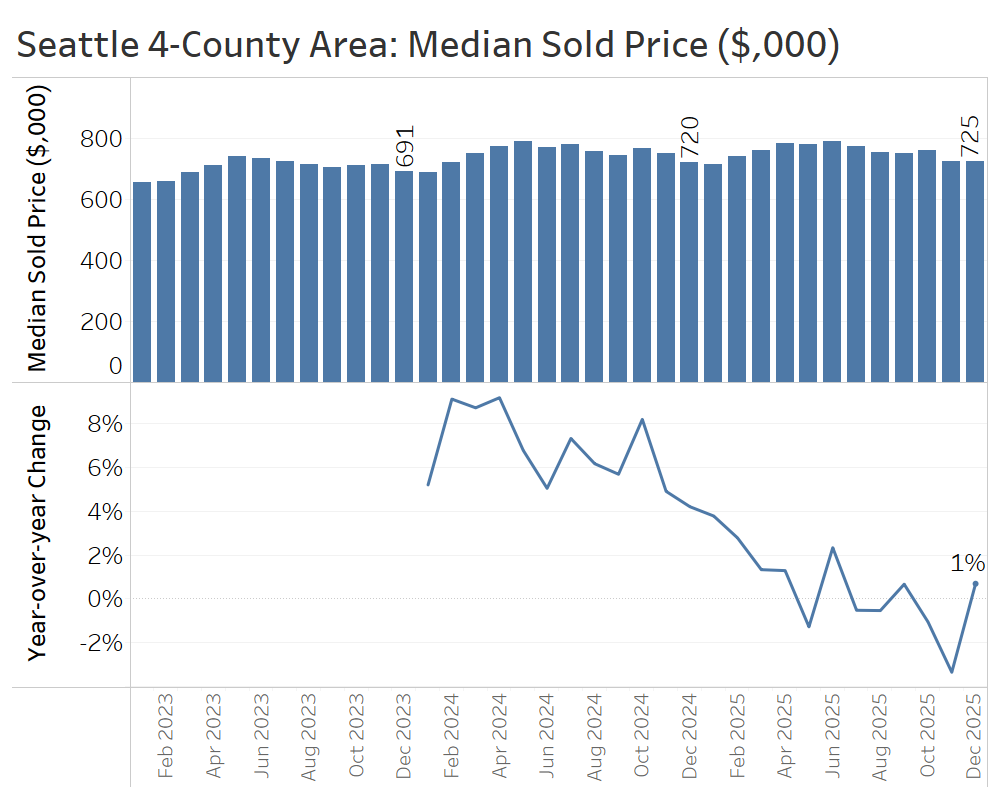
Cooler demand this quarter showed up in prices, too. October and November saw median sale price drops of 1% and 3% from 2024, before ending the year at $725,000, about 1% higher than the end of 2024. High inventory tends to depress price growth, as sellers are forced to compete for limited buyers.
The fourth quarter brought 2025 to a subdued close in the Seattle-area housing market, with no surge of activity to rival the fourth quarter of 2024 and higher inventory continuing to weigh down prices. That said, the new year is kicking off with much lower interest rates than a year ago, which may be enough to jump-start buyer demand after a quiet winter.
Greater Portland Area (Multnomah, Washington, Clackamas, and Clark Counties)
The Greater Portland Area notched another quiet quarter of normalization to round out 2025, with modestly rising inventory and slightly lower prices than 2024.
Active listings ended the year at 3,788, or 13% higher than the previous year. That continues a trend of decelerating inventory growth since May.
New listings in the fourth quarter of 2025 remained below fourth-quarter 2024 levels for the third straight month, capped by a 5% decline in December, traditionally the quietest month for new listings. The slower inflow of listings to the market has contributed to the more modest inventory growth seen above.
The average home sold after 66 days on the market—about six days longer than December 2024. Homes that linger for several months often end up selling below their original asking price, a trend that has increasingly worked in buyers’ favor in the fourth quarter.
Closed sales of single-family homes rose 7% year over year in December, following a significant dip in November. Overall, the 5,221 closed sales in the fourth quarter narrowly exceeded the 5,162 sales recorded in the final quarter of 2024, suggesting that more buyers were motivated to get off the fence this fall.
Median home sale prices in the Portland area edged down slightly, ending the year at $580,000 – about 1% below December 2024. Paired with the rebound in sales, this suggests buyers were able to negotiate for some deals at the end of 2025.
The fourth quarter continued to demonstrate the downstream effects of higher inventory in the Portland area: it helped attract buyers and support affordability, while also discouraging some sellers who are likely waiting to list.
Greater Sacramento Area (Sacramento, Yolo, El Dorado, and Placer Counties)
The Greater Sacramento Area is another market where the advantage has decisively shifted in favor of buyers. Inventory has climbed, prices have cooled, and sales activity has remained relatively flat.
At the end of December, there were about 2,700 active listings—an increase of 14% compared to the end of 2024. Overall, inventory growth in the fourth quarter was much more modest than in early 2025, when listings were up 50% or more compared with 2024.
New listings ran below December 2024 levels for four straight months, before ticking up 10% in December 2025—a modest boost to end the year.
Average days on market rose by about 11 days compared to December 2024, reaching 52 days. While this eases some of the pressure on home shoppers, seasonal trends are likely to bring the number down later in the first quarter.
Sales activity in the fourth quarter of 2025 was remarkably similar to the fourth quarter of 2024, with nearly 4,500 homes sold in 2025 compared with just over 4,500 the year before.
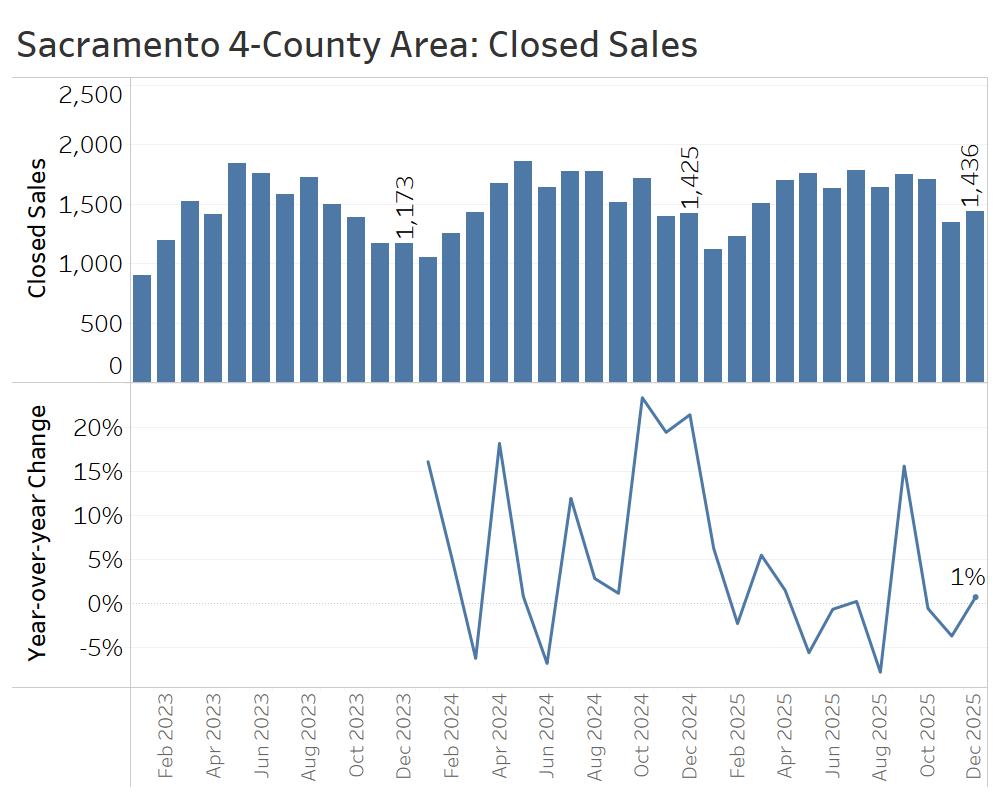
Median sale prices fell 3%, from around $595,000 in December 2024 to $577,000 in December 2025. The main causes of the softer pricing were higher inventory and longer time on market.
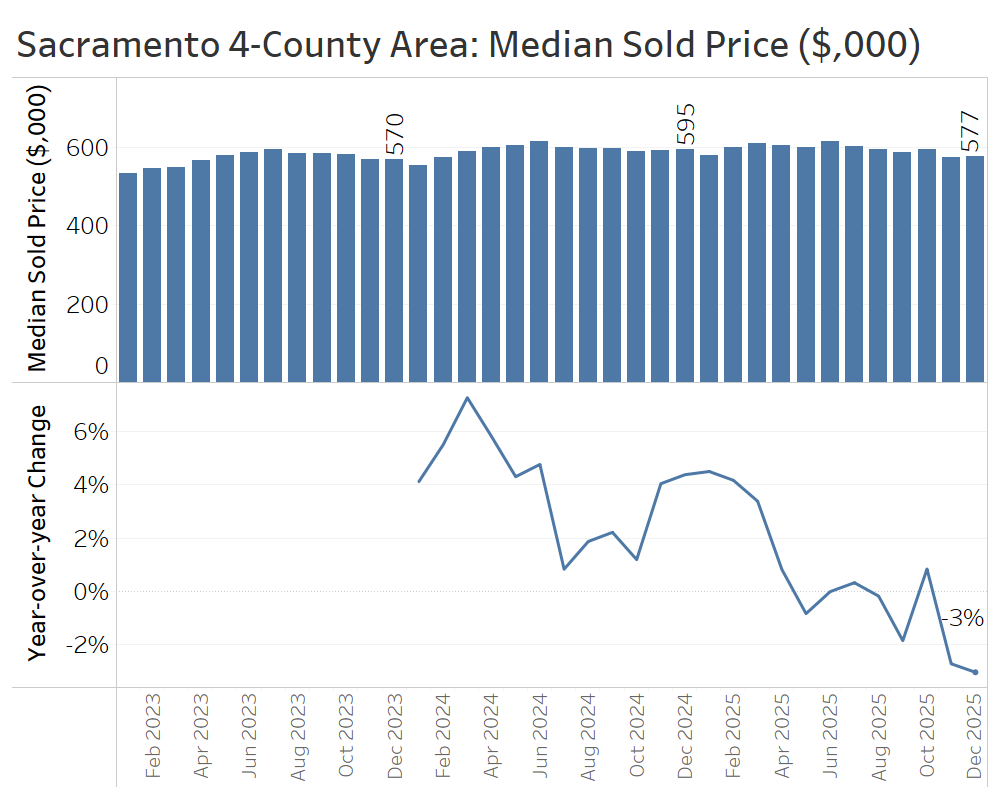
The fourth-quarter takeaway in the Greater Sacramento Area is that buyers came to appreciate and act on their greater negotiating power, winning some bargains while sales volume remained basically flat.
Northwest Washington (Skagit, Whatcom, San Juan, and Island Counties)
The market conditions in the four northernmost counties of Western Washington are experiencing a major shift in favor of buyers.
At the end of December, there were 1,121 active listings, up 21% from a year earlier. That marked a slowdown in inventory growth in the fourth quarter, down from increases of 30% or more in the middle of the year.
The flow of new listings fell sharply in the fourth quarter, even by seasonal standards. Some listings may have been affected by flooding during the atmospheric rivers that slammed Washington State; others may have been withheld by sellers clued into the cooler selling conditions.
Days on market continued to climb compared to a year earlier, with homes in December taking about five days longer to sell than they did at the same time a year earlier.
Closed home sales in the fourth quarter of 2025 generally trailed fourth-quarter 2024 levels, except for a modest uptick in December. In total, the 1,210 closed sales for the quarter fell about 4% short of the 1,251 homes sold in the fourth quarter of 2024.
Compared to the same time the previous year, median home prices were virtually flat in November and December, after a brief bump in October. This marks a continuation of the cooldown of price growth that had characterized 2024 and early 2025.
Fourth quarter confirmed that higher inventory levels finally gave buyers more negotiating leverage in Northwest Washington.
Spokane, WA and Coeur d’Alene, ID Area (Spokane and Kootenai Counties)
The greater Spokane-Coeur d’Alene region, spanning the Washington-Idaho border, is experiencing many of the same market trends seen in Western Washington, including higher inventory, softer buyer demand, and flattening home prices.
At the end of December, there were 1,979 active listings, up 16% from December 2024. That represented a modest slowdown in inventory growth from the year-over-year increases of more than 20% seen earlier in 2025.
New listings jumped 19% compared to December 2024, but month-to-month changes in new listings were quite volatile. During the quarter as a whole, there were 2,681 new listings, up from 2,549 in the fourth quarter of 2024, representing a 5% increase.

The pace of home sales, which is measured by days on market, only crept up modestly in the fourth quarter, ending the year at 66 days in December. However, that average obscures a wide divide across the state line, with homes averaging 47 days on market in Spokane County compared with 106 days in Kootenai County.
Closed sales in December were down 9% year-over-year, and the quarter also saw a modest decline. Sales slipped from 2,152 in the fourth quarter of 2024 to 2,117 in the fourth quarter of 2025.
Because of challenges associated with combining data from multiple MLSs, we report average sale prices rather than medians for the Spokane-Coeur d’Alene area. Compared with December 2024, the average sale price in December rose about 2%, from $550,000 to $561,000. For the quarter as a whole, average prices also increased 2%, rising from $560,000 in the fourth quarter of 2024 to $572,000 in the fourth quarter of 2025.
That increase was driven entirely by higher average sale prices in Kootenai County, where prices climbed 8%, while average prices in Spokane County fell 2%.
Altogether, the shift towards a buyer’s market in the greater Spokane-Coeur d’Alene area began to flatten prices without yielding an increase in sales. Many metrics diverged across the Washington-Idaho border, with evidence of resilient demand for homes at Coeur d’Alene’s higher price points, while demand lagged in Spokane County.
Salt Lake County, Utah
Market conditions in Salt Lake County swung sharply in buyers’ favor early in 2025, as rapid inventory growth led to modest price declines. More recently, however, the market has begun to look more balanced rather than distinctly a buyer’s market.
Active listings at the end of December stood at 1,423 homes, up 12% from a year ago—a major slowdown from the 43% inventory growth seen in July of last year.
Salt Lake County experienced strong year-over-year growth in new listings early in 2025, exceeding 20% in March and April, but slowing to just 7% growth in December. The waning seller enthusiasm is helping to rebalance the market.
The average number of days it took to sell a home in Salt Lake County ended the year at 61 days, just slightly longer than the 60-day average at the end of 2024.
Closed home sales in December 2025 rose 2% compared to December 2024, capping a fourth quarter that roughly matched the strong sales seen in the same period the year before.
In December, the median sale price in Salt Lake County rose 5% year over year—from $594,000 to $625,000. That marked the fifth straight month of price gains, reversing a trend of modest price declines in mid-summer.
All in all, Salt Lake County has shifted into a more balanced market, driven by modest price growth and a slowdown from the significant inventory buildup seen earlier in 2025.
Conclusion:
All of the markets covered in this report shifted in buyers’ favor in 2025, though some, like Salt Lake County, show that the pendulum can—and will—begin to swing back toward more balanced conditions.
Going forward, buyers should be aware that in most markets, there are more listings than in recent years, home prices have remained roughly flat for at least a year, and mortgage rates are near three-year lows. Together, these factors create a strong opportunity to buy. That said, buyers should also be mindful of the usual spring surge in competition, which will accelerate home sales and push prices higher, as it does every year. Savvy buyers can try to get ahead by shopping earlier, but they should also be prepared to write a competitive offer if their ideal home hits the market this spring.
For sellers, the peak selling season is fast approaching. But even in a more balanced market, homes do not sell themselves. The best outcomes still depend on presenting the home well, setting the right list price, and marketing effectively to the right buyers. With the right strategy, this spring presents a great opportunity to sell for the best possible price, especially as lower mortgage rates bring more buyers off the fence.
Sources: TrendGraphix analysis of NWMLS, RMLS, Spokane MLS, MetroList MLS, and Wasatch Front MLS data.
Numbers to Know 1/14/26: Mortgage Rates Are Moving, Here’s What to Know

This is the latest in a series of videos with Windermere Principal Economist Jeff Tucker, where he delivers the key economic numbers to follow to keep you well-informed about what’s going on in the real estate market.
2026 is already proving to be a busy news year for the housing market, starting with our first number to know:
$200 billion
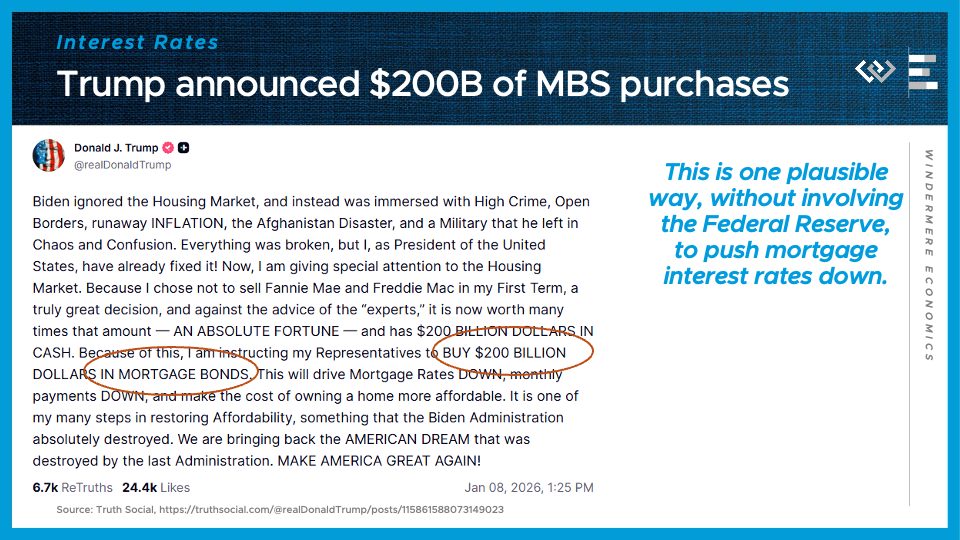
That’s the total value of mortgage-backed securities that President Trump announced on January 8th he’s directed “his Representatives” to purchase, with a stated goal of reducing mortgage interest rates. A big new buyer of mortgages will tend to bid their prices up, which – for bonds – means pushing interest rates down.
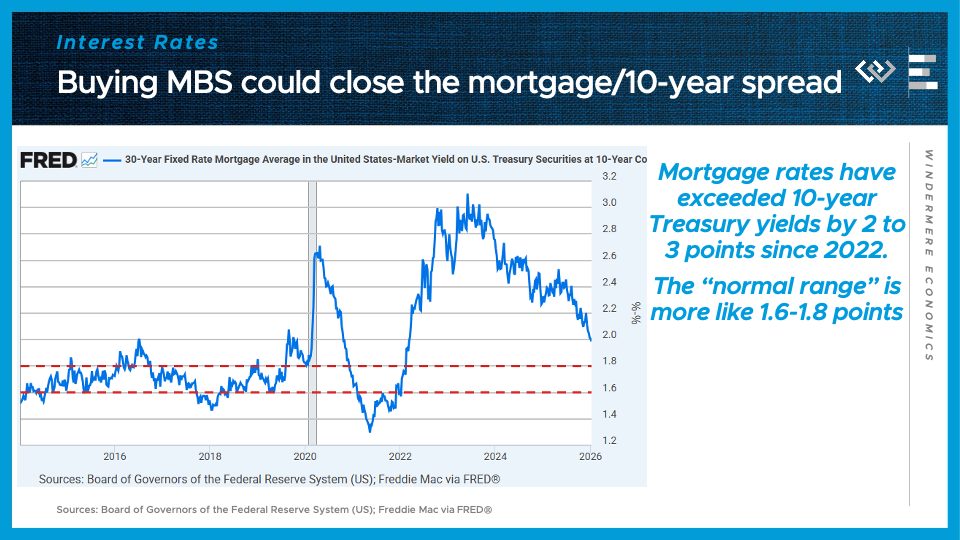
For the last 3 years, mortgage rates have been unusually high relative to the benchmark 10-year Treasury rate, which has been gradually compressing back to a normal range, and this buying spree, evidently by Fannie Mae and Freddie Mac, should accelerate that process of shrinking the spread.
Markets have taken this announcement quite seriously. In just the first day of trading after Trump’s announcement, mortgage rates dropped 15 basis points, bringing us to our second number to know right now:
6.06%
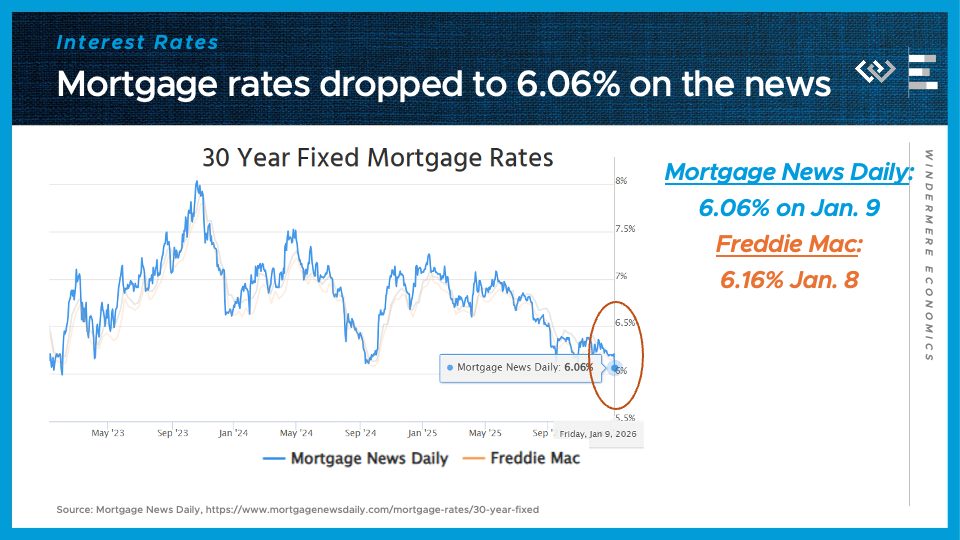
That was Mortgage News Daily’s average 30-year mortgage rate on Friday, January 9th, and that marks the lowest mortgage rate they’ve reported in almost 3 years. Now – trading has been unusually volatile, and there are still a lot of unanswered questions about this new program, but there’s no doubt that in the short term, it has begun moving markets, and I think SOME highly qualified buyers and sellers who start to see mortgage rates in the 5% range will be more motivated to transact this spring.
Another number to know right now:
56,000
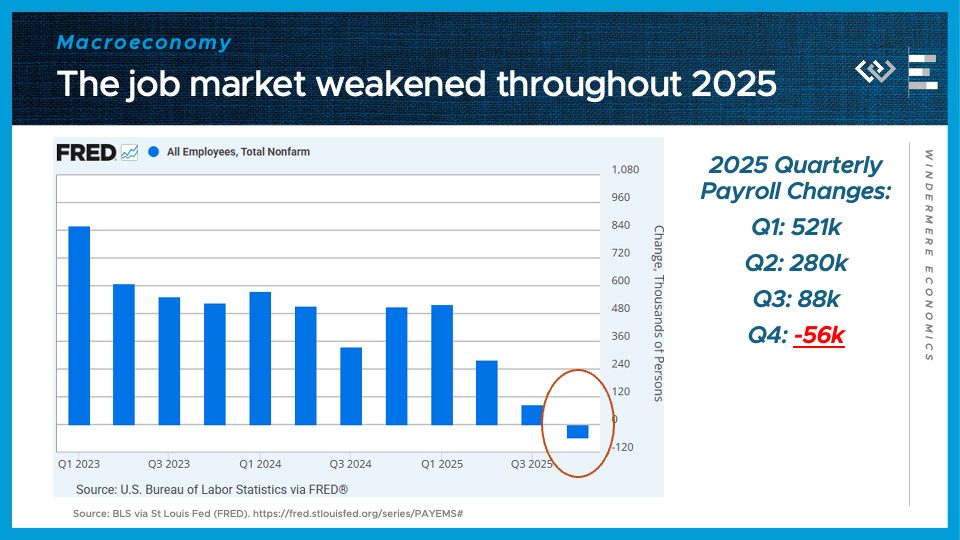
That’s the number of jobs lost on net over the fourth quarter of 2025, capping a year of slowing, and finally shrinking, payrolls in the U.S. economy. Now, other data shows economic activity held up fine in the fourth quarter, so this is not the beginning of a recession, but slowing job growth could help explain why home purchases disappointed in the fourth quarter, despite lower mortgage rates than in late 2024.
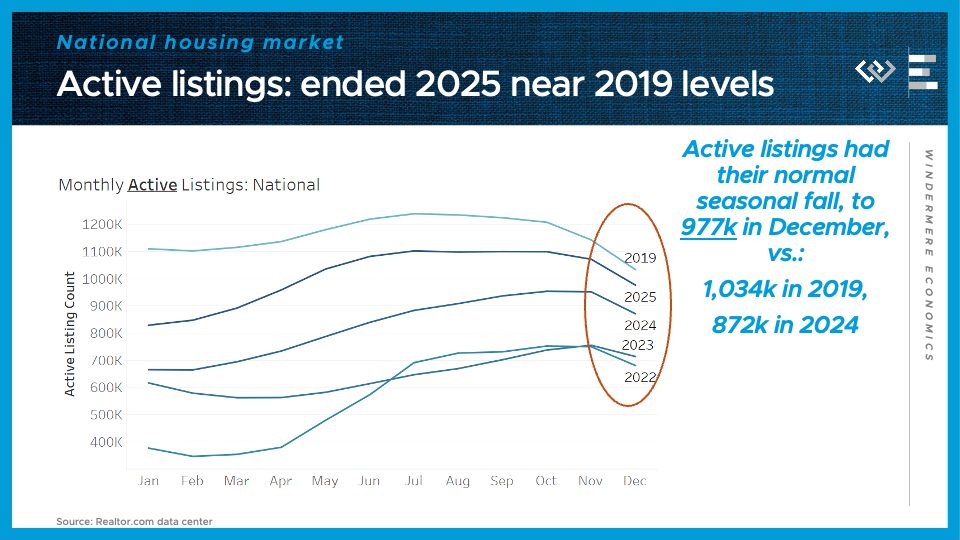
Speaking of housing, 2025 ended with the housing market still just shy of an important benchmark I’ve been watching: the moment when active inventory recovers to its pre-pandemic, 2019 levels. The year ended with just under a million active listings, vs just over a million 6 years ago on the eve of the Covid pandemic.
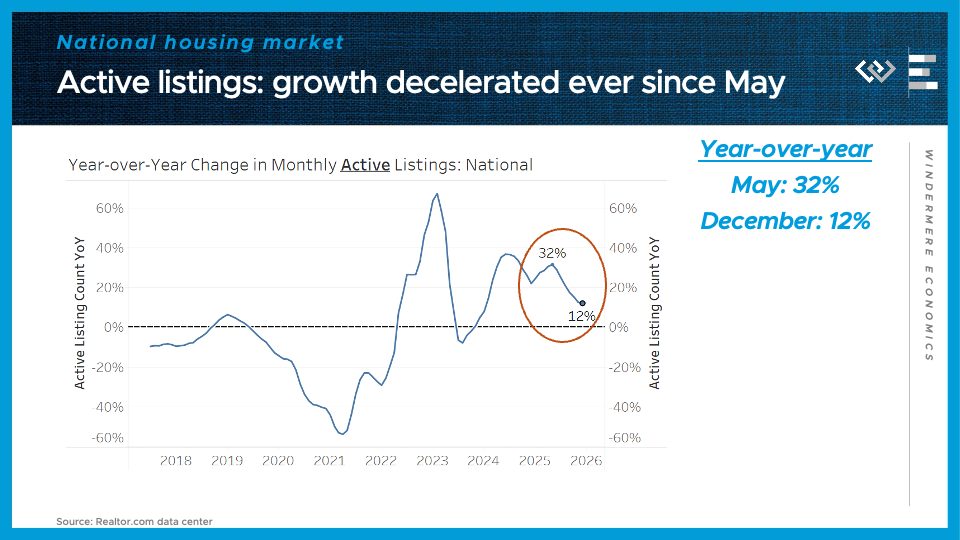
That is still up substantially from this time last year, but the trend of year-over-year listing growth clearly slowed over the course of 2025. That helps explain why 2025 went down as the year of cooling and normalization, but NOT anything like a fire sale or glut of unsold homes. Rather, it’s a market that made a lot of progress back toward normalcy, foretelling a healthy, balanced market in the year ahead.
")


