
 Facebook
 X
X
 Pinterest
 Copy Link

This video is the latest in our Monday with Matthew series with Windermere Chief Economist Matthew Gardner. Each month, he analyzes the most up-to-date U.S. housing data to keep you well-informed about what’s going on in the real estate market.
Hello there and welcome to the April edition of Mondays with Matthew. I’m Windermere Real Estate’s Chief Economist, Matthew Gardner
There were a lot of rich, housing-related datasets released this month so let’s get going.
And first up, I want to look at mortgage applications.
Source: MBA
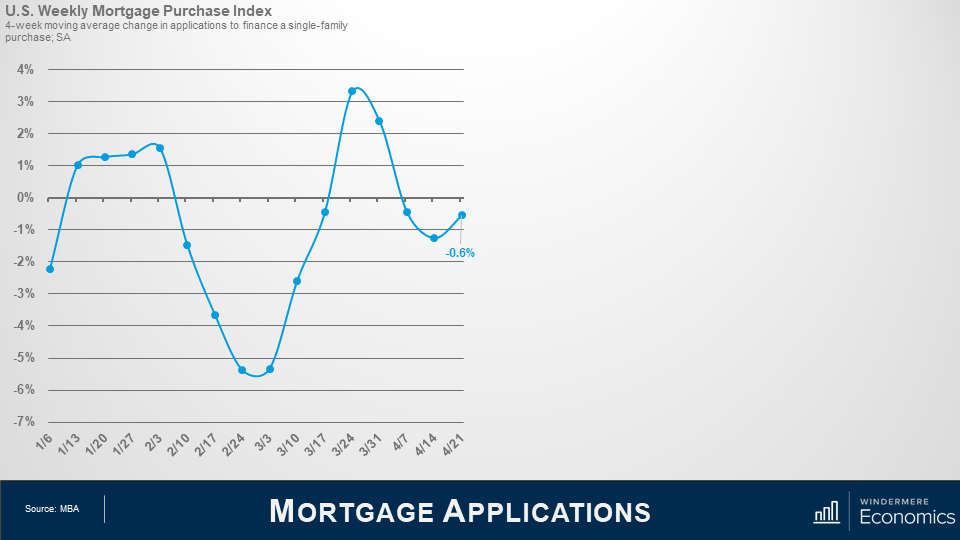
You may remember last month we discussed what was going on with mortgage rates as they had started to trend higher beginning in the New Year. Well, as rates rose, you can see here that mortgage applications slowed before picking back up in at the end of February, which was interesting as rates were still rising at that time.
And for those who find it curious that applications picked up even as rates were rising, well it was partly because buyers started to believe that rates would not be headed back down, and they wanted to get locked in for fear that they would continue trending higher.
Now, this pattern did reverse at the end of March as rising rates started to take a toll on would be buyers and affordability issues started to come more into play, but as mortgage rates pulled back in April, applications picked up again – albeit modestly.
Source: MBA
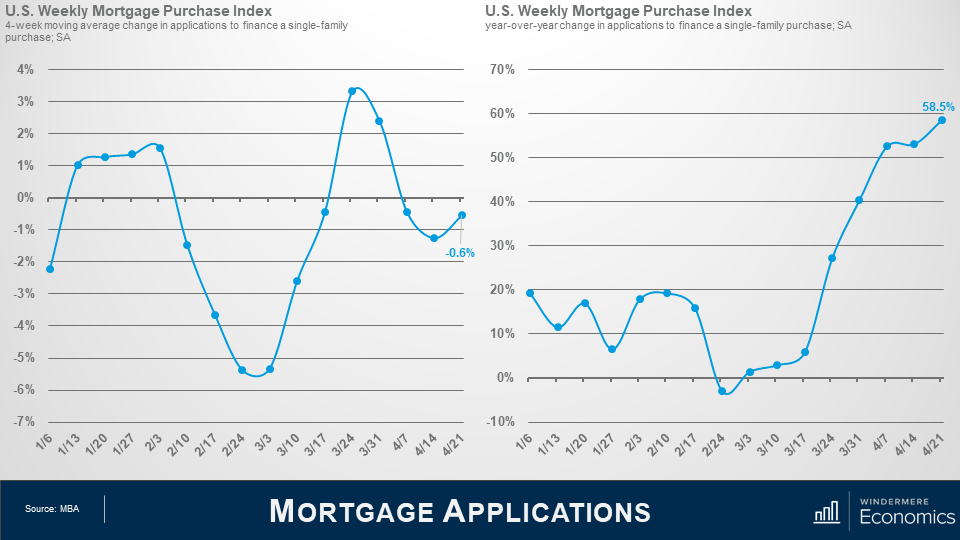
But when we take a look at the data on a year-over-year basis. Well, WOW!
Applications were up by over 58%! But remember what happened in March of last year? Who can forget….?
And its therefore really not surprising to see this kind of spike, but, I would caution you all that almost any dataset that compares current numbers to those seen a year ago – well, they are likely to paint far too rosy a picture, and one that is removed from reality.
Something to be aware of.
Next up, we got several datasets regarding the new home market March and we will start off with permits and starts.
Source: Census Bureau
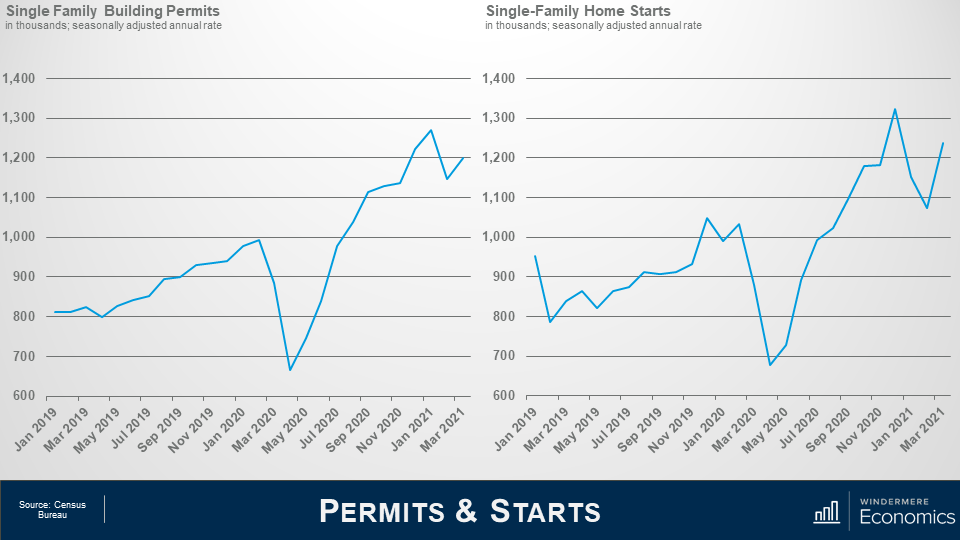
Following the pullback in permit applications that was seen in February, builders were more optimistic in March with single family permits up by 4.6% on the month and 35.6% higher than a year ago – but don’t forget what we just said about year over year data!
Looking at housing starts – well they pulled back in January and February, but also saw a solid 15% monthly increase in March.
Interestingly, there was a massive spike in starts in the mid-west where they were up by 109% month-over-month, but they were actually down by over 12% out here in the west.
I would also let you know that the number of homes under construction rose by 1.6% versus February and this was particularly pleasing given that construction costs remain very elevated.
And it hasn’t just been material costs that have been hitting home builders, they have also seen significant pressures with labor costs and here’s why…
Source: BLS
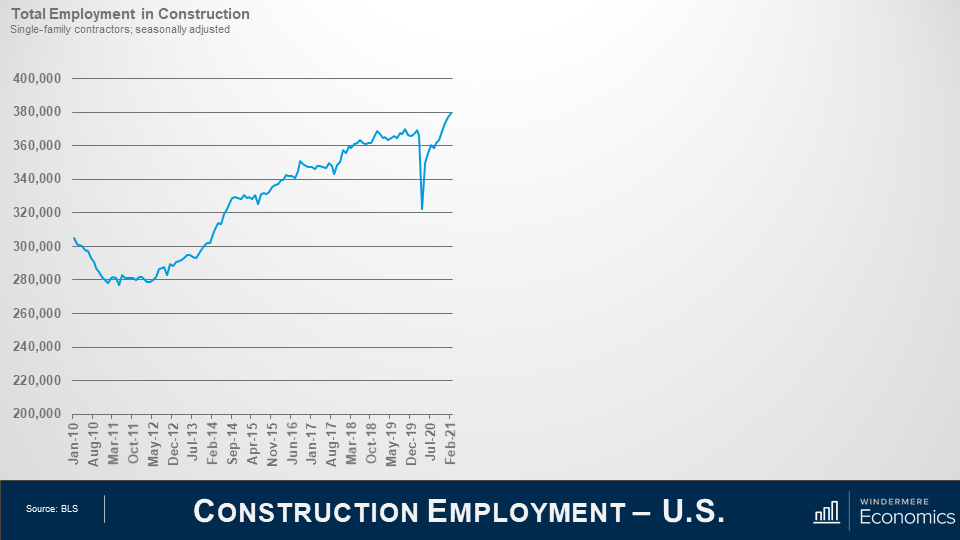
This chart shows how many people are employed in the construction of single-family homes and, at face value, it looks pretty good with constant growth seen since 2012 – of course, ignoring the impact of the pandemic but….
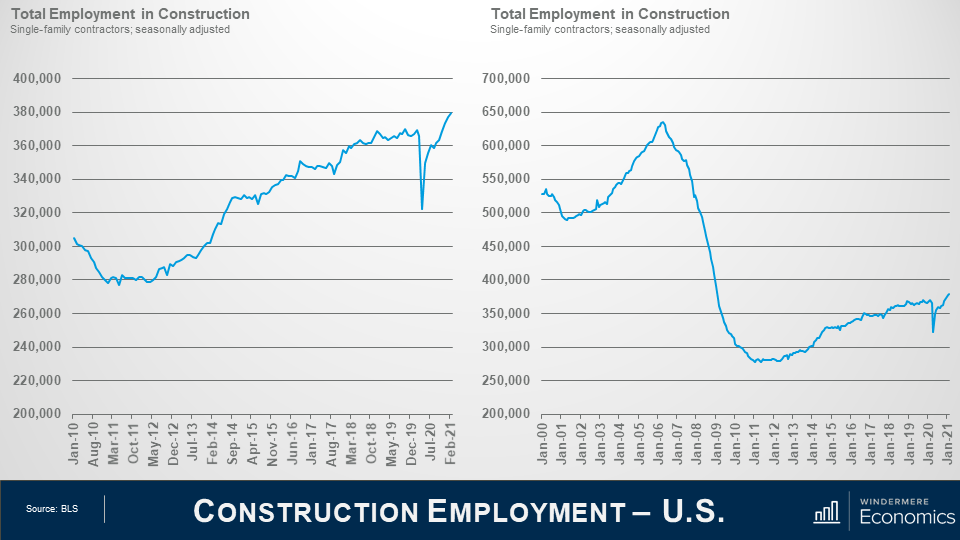
Source: BLS
Looking at a longer timeline, it doesn’t paint as good a picture. At its peak in 2006, there were almost 650,000 people employed building homes, but the number today is just 60% of that.
Of course, there are fewer homes being started today than there were back in those halcyon days but starts today aren’t 40% lower, so the job market remains tight. In fact, there are over 260,000 job openings in the construction sector. Of course, not all of them are for the single-family construction market, but we do know that builder’s cost of labor is rising and that, in concert with higher land and material costs continue to impact builder’s ability to bring homes to market that are relatively affordable as the increase in costs is transferred directly into the price that a home must sell for and that brings me to data on new home listings, sales and prices in March.
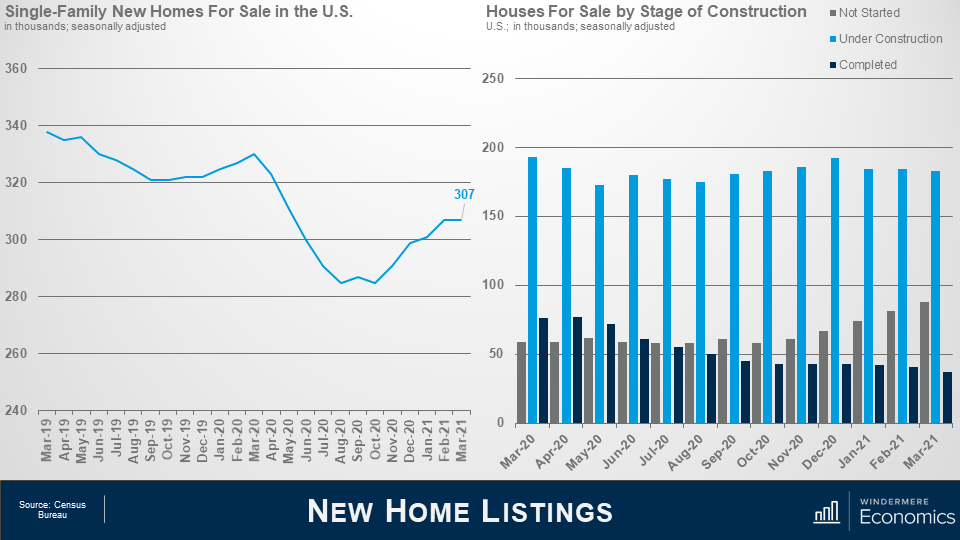
Source: Census Bureau
Even with new housing permits and starts rising significantly the seasonally adjusted estimate of new houses for sale at the end of March was 307,000. This represents a supply of 3.6 months at the current sales rate.
The number of new homes for sale was down by 7% from a year ago, but I do expect that the increase in permits and starts bodes well for this arena, and I do expect to see more listings come online over time.
If you look at the chart to the right, you will notice that the number of homes for sale that have yet to be started continues to rise. This is because builders want some certainty that the home will be sold, and it’s, therefore, easier to sell before you build it.
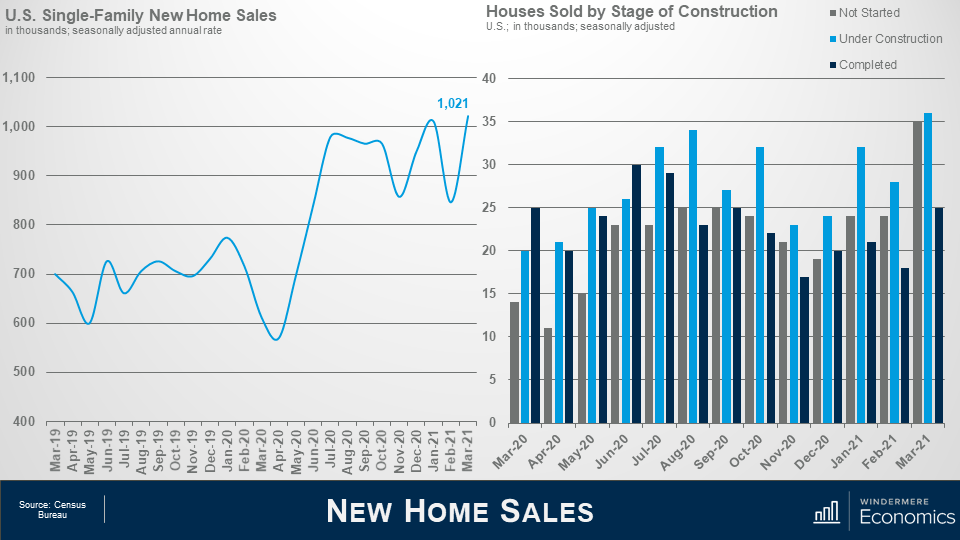
Source: Census Bureau
And when we look at sales, well they rise by 20.7% in March to an annual rate of over 1 million units and clearly rebounded from the previous month when we saw a massive drop as severe winter storms wreaked havoc across much of the country.
Interestingly, you will see that as many homes sold that hadn’t yet started as were under construction. Clearly, demand is robust to the degree that buyers willing to commit to buying a home that hasn’t yet been built.
The median new home sale price came in at $330,800 – that’s down by 4.4% on the month but 0.8% higher than a year ago.
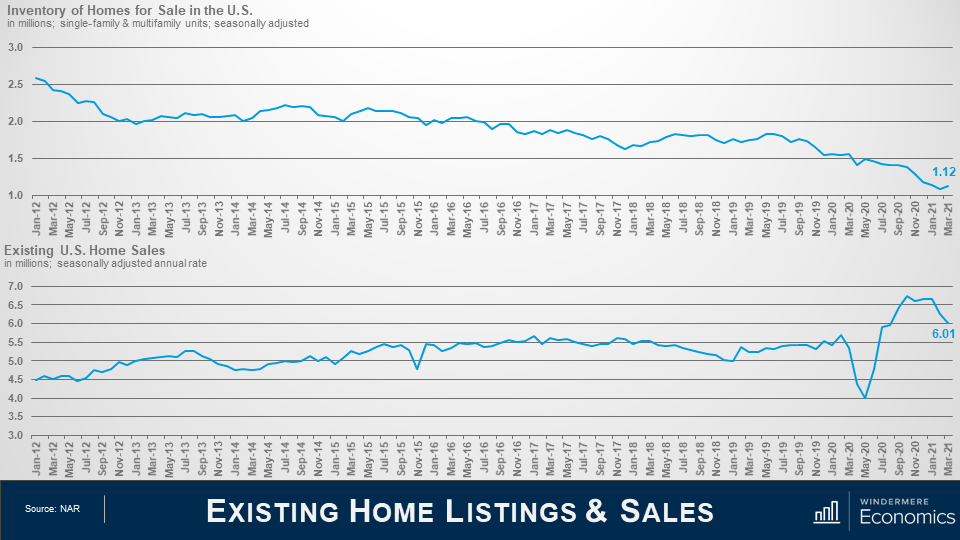
Source: NAR
OK – now we have covered the new home market, let’s take a look at how the resale market fared in March.
The number of homes for sale remains at almost historically low levels with marginally more than 1 million units on the market. Now there may be some of you out there who say that is inaccurate as NAR is reporting 1.07 million homes for sale, and you’d be absolutely correct. But I have adjusted the data to account for seasonality, so it is slightly different.
Anyway, with such limited choice across the country, it wasn’t a surprise to see sales pulling back, with the total number of closings running at an annual rate of 6 million units – that’s down by 3.7% month over month, and down by 12.3% when compared to March of 2020.
Am I worried about this? No, I am not. Why? Well, as I just mentioned, just look at the inventory numbers. With little choice, it’s not at all surprising to see sales pull back but I would add that the market still hit 6 million transactions and that was in the face of the increase in mortgage rates that we saw last month so, to tell you the truth, I was actually a little surprised to see that the number held above that 6 million level.
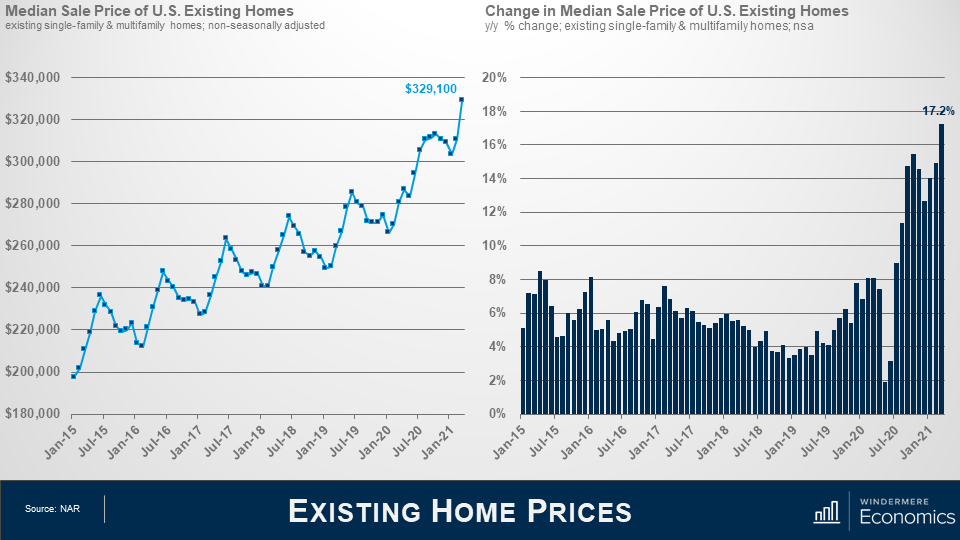
Source: NAR
But even as sales pulled back a little, prices didn’t, and more records were broken with the median sale price hitting an all-time high, and year-over-year price growth above 17% was another record shattered.
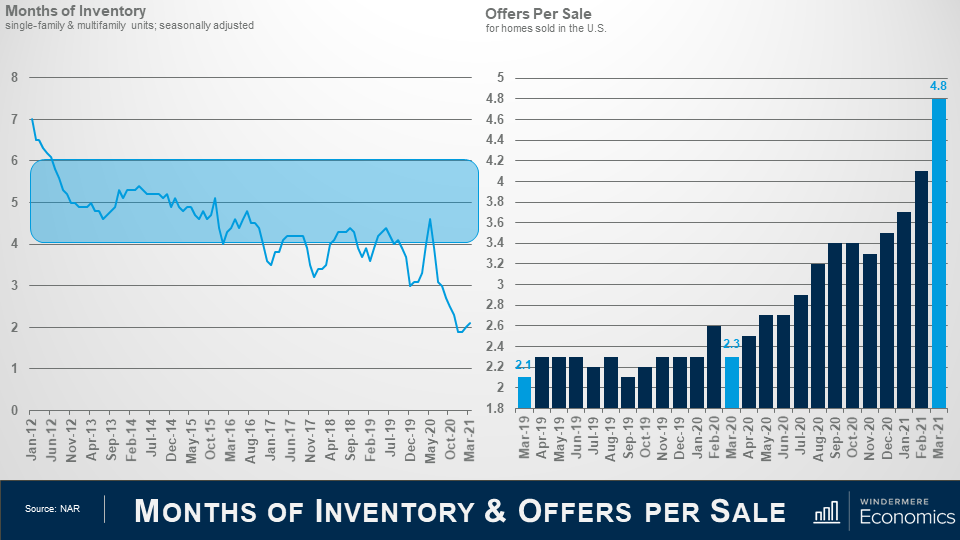
Source: NAR
And if you need further proof that there is little to be concerned about when it comes to sales pulling back, you only need to look at these charts. Low supply, but still very robust demand has months of supply at levels that indicate a highly unbalanced market. Nationally, I like to see somewhere between 4 and 6 months of supply, not 2.1…
But look at the right. For every offer accepted in March, there were 3.8 additional offers, and I would also tell you that the average length of time it took to sell a home in March was just 18 days and that’s down by one day from February but down by eleven days when compared to a year ago.
Surely if demand was waning, wouldn’t the number of offers be going down, and days on market going up?
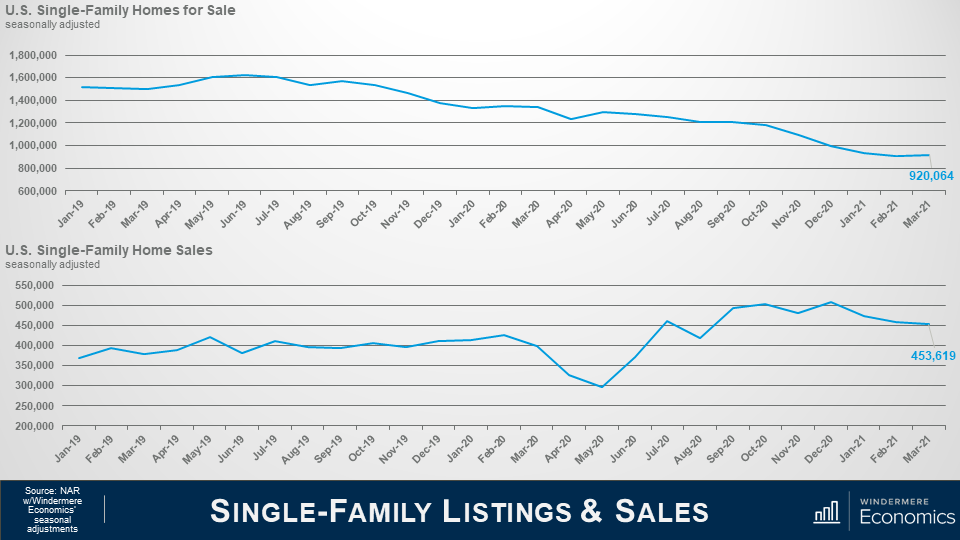
Source: NAR with Windermere Economics seasonal adjustments
And when we separate out the single-family market, you can see that listings notched very slightly higher – up by 1.2%, but the level is still close to an all-time low with listings down by over 31% year over year.
As far as sales are concerned, well they also pulled back a little and were down by 1.3% versus February but were 14% higher year over year.
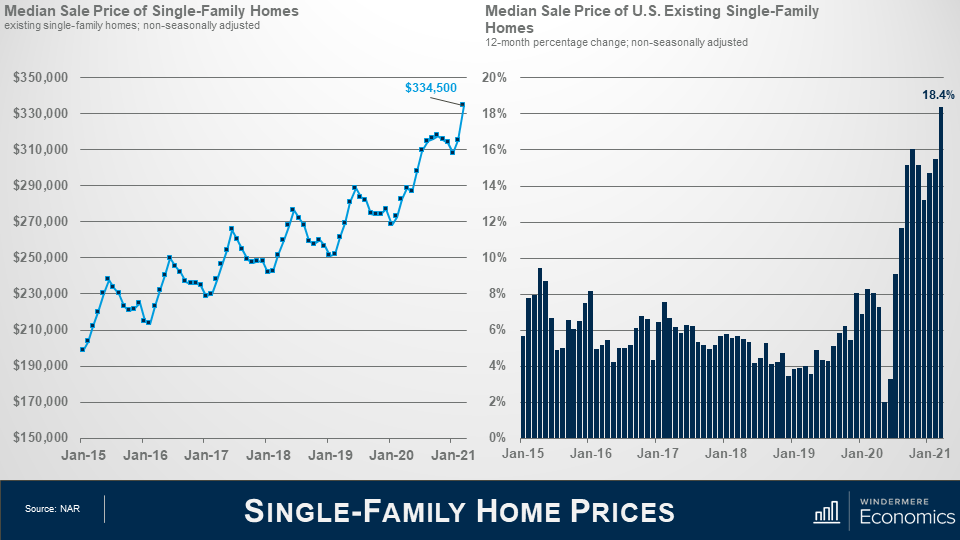
Source: NAR
And as we discussed earlier, even with lower sales activity, sale prices are still rising at a very rapid pace and are now over 18% higher than seen a year ago and a remarkable 6.2% higher than seen in February.
The median price also broke above $330,000 for the first time.
Source: NAR with Windermere Economics Seasonal Adjustments
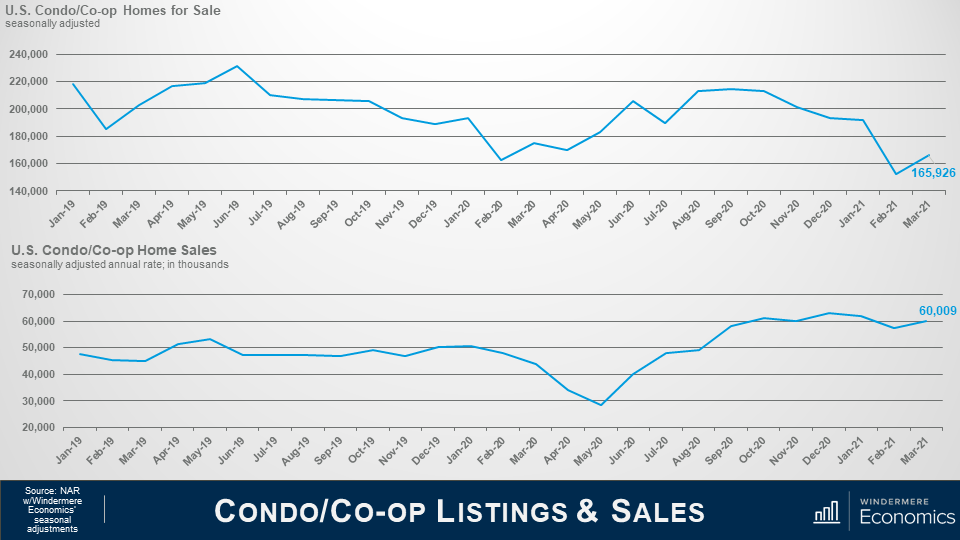
Moving on to the condominium market, we saw listings rise as the pandemic took hold, and there were concerns back then that we were at the start of a systemic increase in listings with people fleeing cities over fears of COVID-19, as well as the ability to work remotely, but the increase soon wore off, even if it rise by 9% in March when compared to February, but there were 5.1% fewer listings than seen a year ago.
But on the sales front – and with listings rising – we saw demand for those homes with sales up by 5% versus February and 36.4% higher than seen in March of 2020.
Source: NAR
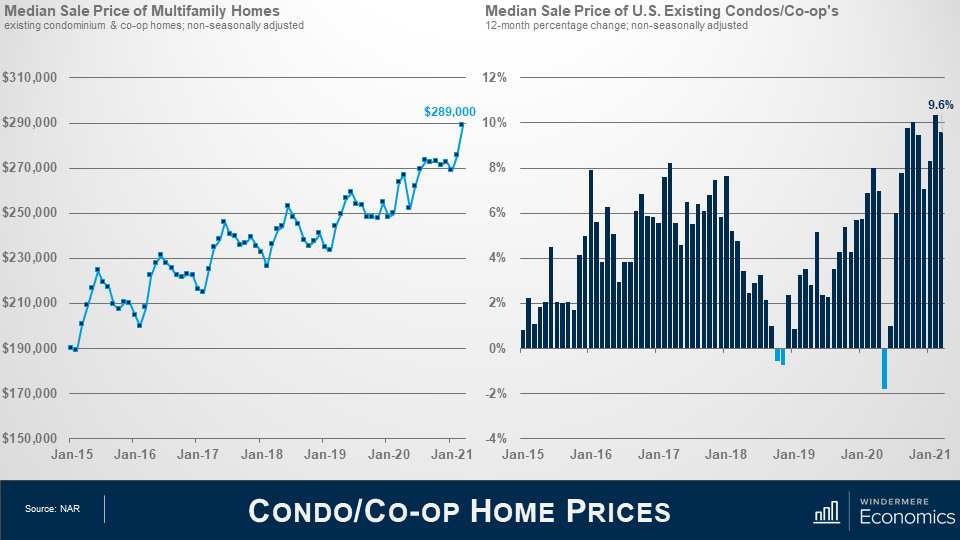
In a similar fashion to single-family prices, sale prices for condominium units saw a spike in price in March and were up by 4.9% versus February and almost 10% higher than seen a year ago.
Although you will see that annual sale price growth did turn negative last May – due to COVID – it is actually rare to see this. We did see a tiny drop back in 2018 but you will likely remember that mortgage rates were rising then and knocking on the door of 5%.
Anyway, since last May, sale prices have picked back up very nicely and worries of any significant drop in condo prices appears to be overblown.
As far as the ownership market is concerned, I am far less worried that mortgage rates have been ticking higher than I am that there are just not enough homes for sale to meet demand.
We had seen some growth in the new construction arena – and that took just a tiny bit of heat off the resale arena – but demand continues to exceed supply, and that is pushing prices higher and affordability issues have already started to appear in several markets across the country.
At some point, we will see price growth slow, but I think that it will be far more to do with affordability limitations than it will rising mortgage rates.
So, there you have it. My thoughts on the housing market in March.
As always, if you have any questions or comments about the numbers, we have looked at today, feel free to reach out. I would love to hear from you.
In the meantime, thank you for watching, stay safe out there, and I look forward to visiting with you again, next month.
Bye now.
")


