
 Facebook
 X
X
 Pinterest
 Copy Link

This is a recurring series of blog posts taking a closer look at the U.S. economy and several major regional markets in Windermere’s nine-state footprint. Updates will be released on a quarterly basis.
Economic Overview
Last year did not deliver the hoped-for breakout from the low-sales housing market that has persisted since interest rates skyrocketed in 2022. Just over four million existing homes sold in 2025 – nearly identical to the totals in 2023 and 2024.
Mortgage rates edged lower in the fourth quarter, falling from an average of 6.35% in September to 6.19% in December. That downward trend continued into early 2026, particularly following the announcement that Fannie Mae and Freddie Mac would purchase additional mortgage-backed securities.

Source: Freddie Mac via FRED.
The labor market continued to soften in the fourth quarter, with negative total payroll changes after anemic job growth in the third quarter.

Source: BLS via FRED.
The following is a detailed overview of housing trends across six regional markets within Windermere’s footprint during the fourth quarter of 2025. They include the Greater Seattle Area, Greater Portland Area, Greater Sacramento Area, Northwest Washington State, the Spokane, WA and Coeur d’Alene, ID markets, and Salt Lake County, UT.
Greater Seattle Area (King, Snohomish, Pierce, and Kitsap Counties)
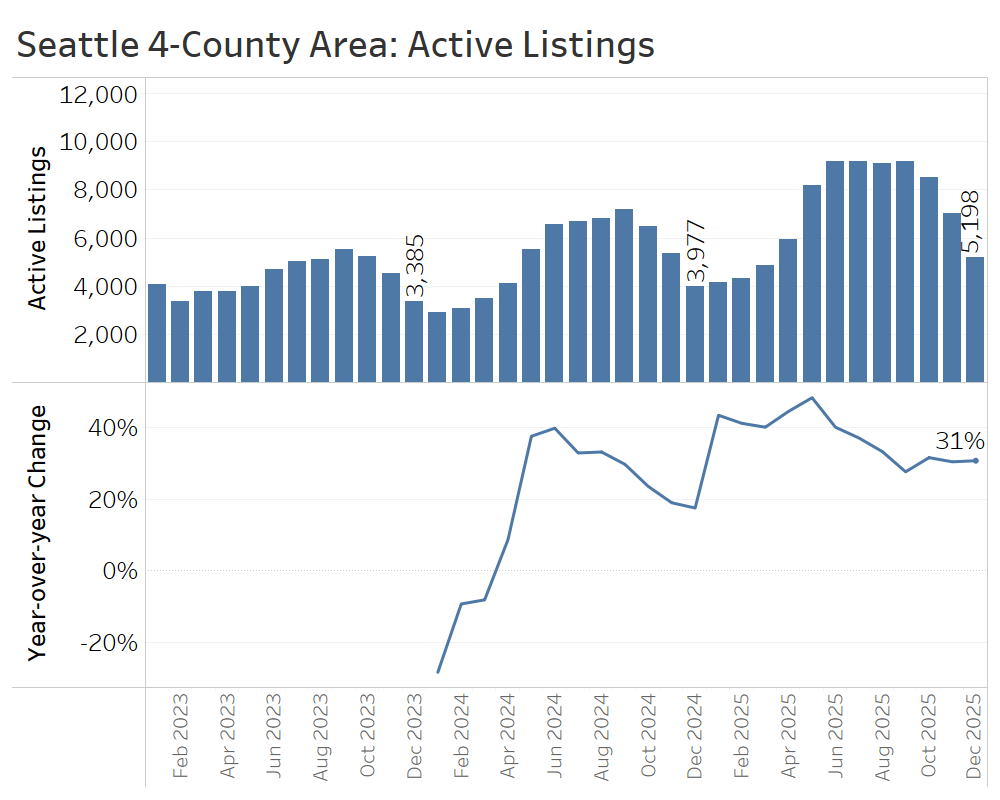
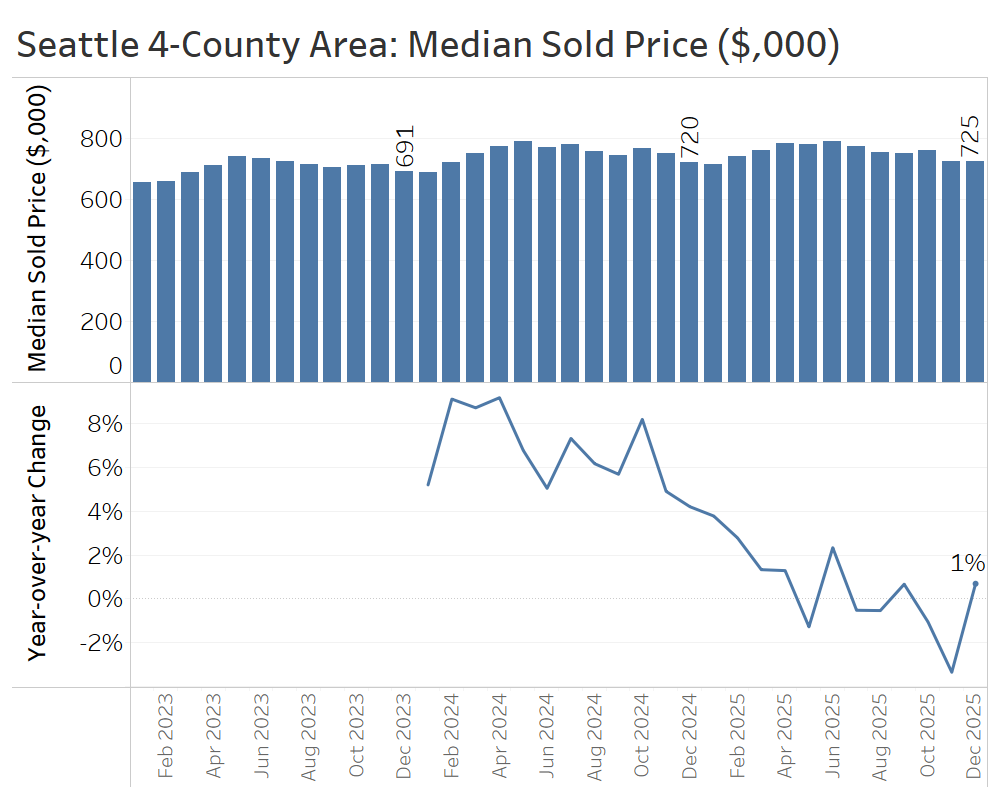
The fourth quarter cemented the defining themes of 2025 for the Seattle-area housing market: higher inventory and more negotiating power for buyers. Active listings totaled nearly 5,200 at year-end, which was 31% higher than at the end of 2024, yet well below the more than 9,000 listings on the market as recently as September, reflecting the typical seasonal pullback in the fall.
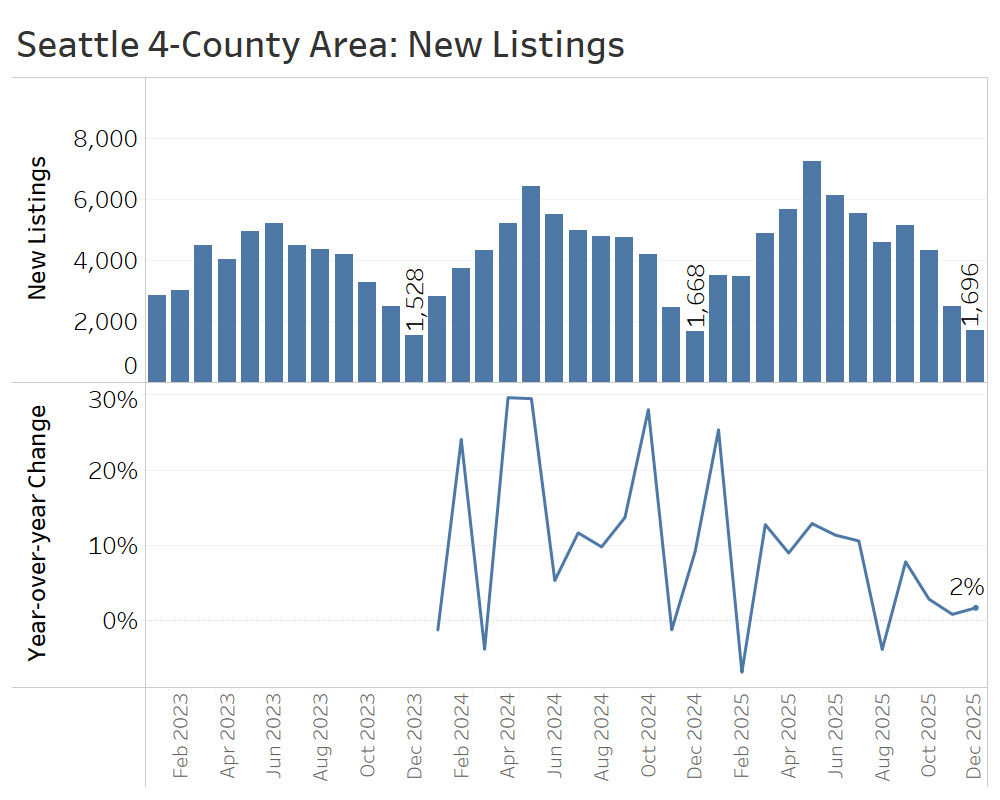
The fourth quarter is typically the low-water mark for new listings, and 2025 was no exception: just under 1,700 new listings hit the market in December, barely 2% more than a year earlier. That modest year-over-year increase marked a major cooldown from the faster pace of new-listings growth seen earlier in the year.
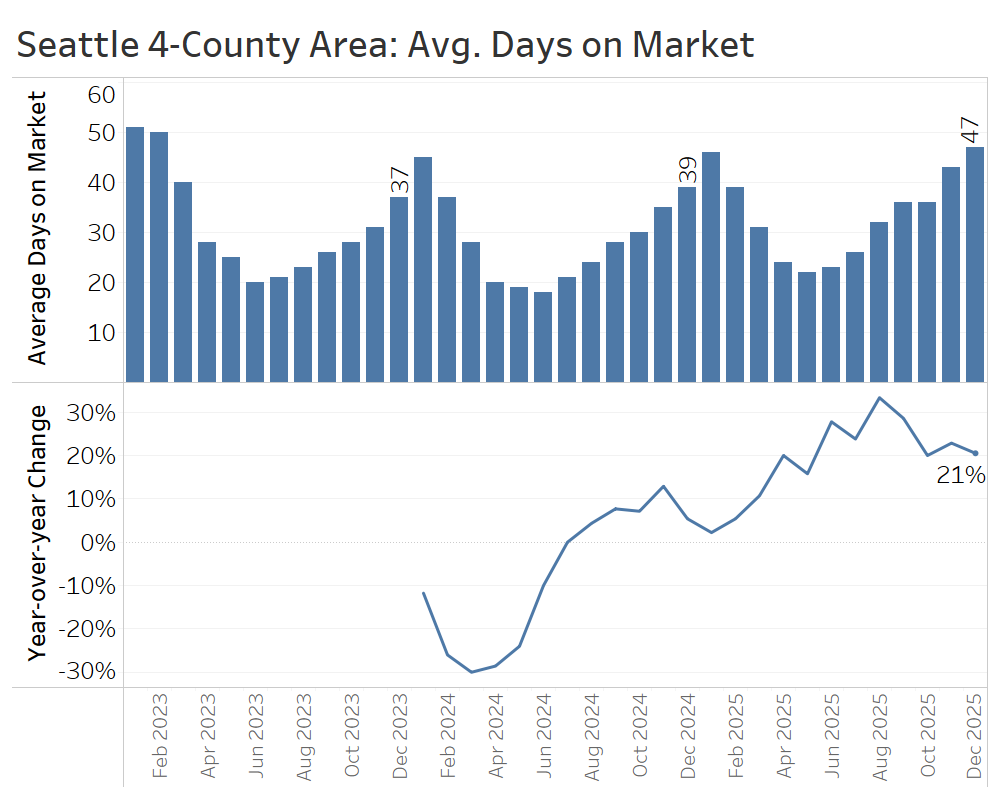
Listings continued to linger on the market longer in the fourth quarter compared to the prior year. In December, homes averaged 47 days on market, up from 39 days in December 2024. January will likely mark the seasonal high-water mark before time on market plunges with the onset of the spring selling season later in the first quarter.
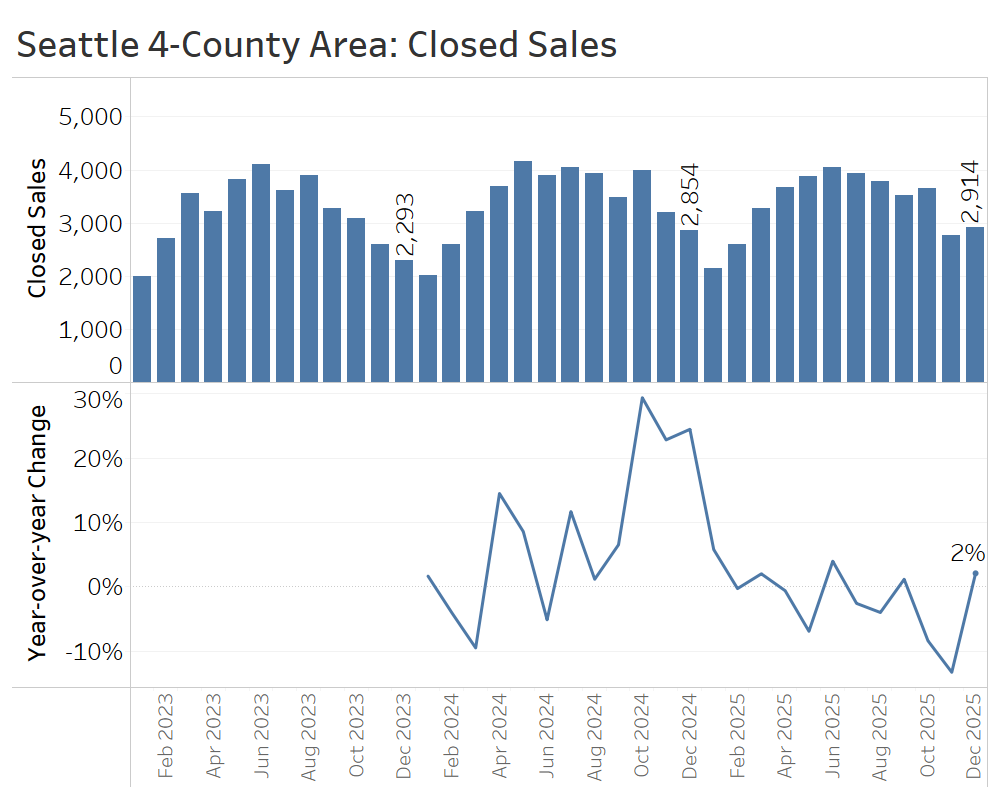
Closed sales in the fourth quarter generally fell short of fourth-quarter2024 levels, which were boosted by a frenzy of buyer activity following the Federal Reserve’s initial interest rate cuts in September of that year. Closed sales year over year declined 8% in October and 13% in November, before rebounding to a 2% year-over-year increase in December.
Cooler demand this quarter showed up in prices, too. October and November saw median sale price drops of 1% and 3% from 2024, before ending the year at $725,000, about 1% higher than the end of 2024. High inventory tends to depress price growth, as sellers are forced to compete for limited buyers.
The fourth quarter brought 2025 to a subdued close in the Seattle-area housing market, with no surge of activity to rival the fourth quarter of 2024 and higher inventory continuing to weigh down prices. That said, the new year is kicking off with much lower interest rates than a year ago, which may be enough to jump-start buyer demand after a quiet winter.
Greater Portland Area (Multnomah, Washington, Clackamas, and Clark Counties)
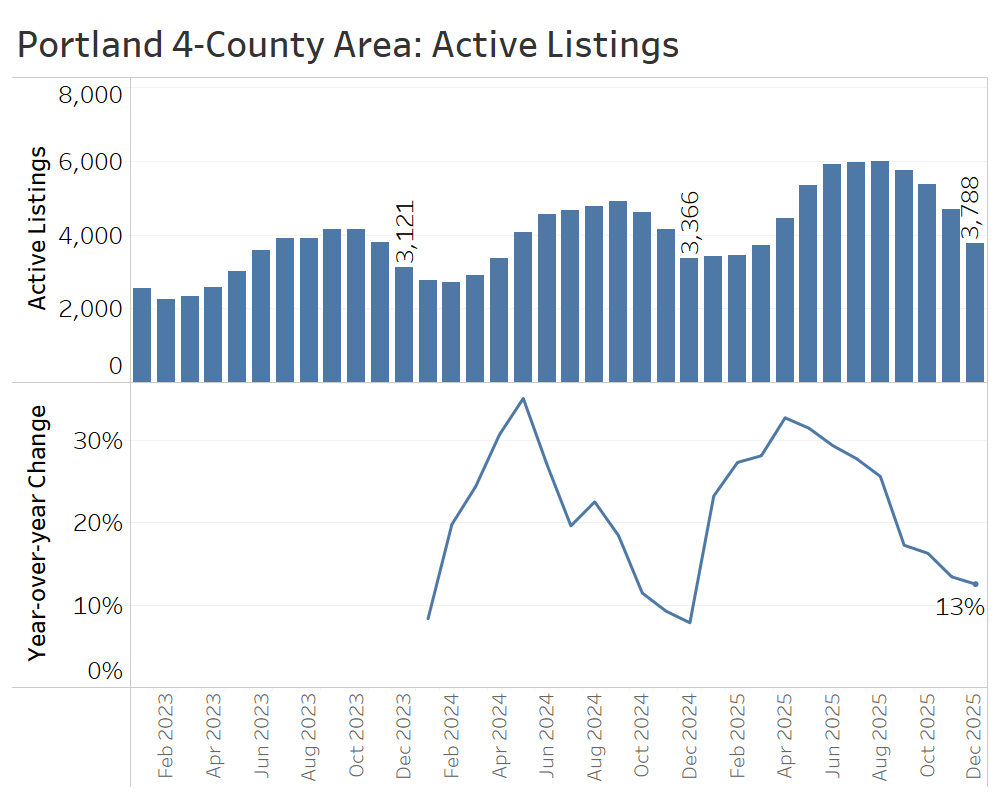
The Greater Portland Area notched another quiet quarter of normalization to round out 2025, with modestly rising inventory and slightly lower prices than 2024.
Active listings ended the year at 3,788, or 13% higher than the previous year. That continues a trend of decelerating inventory growth since May.
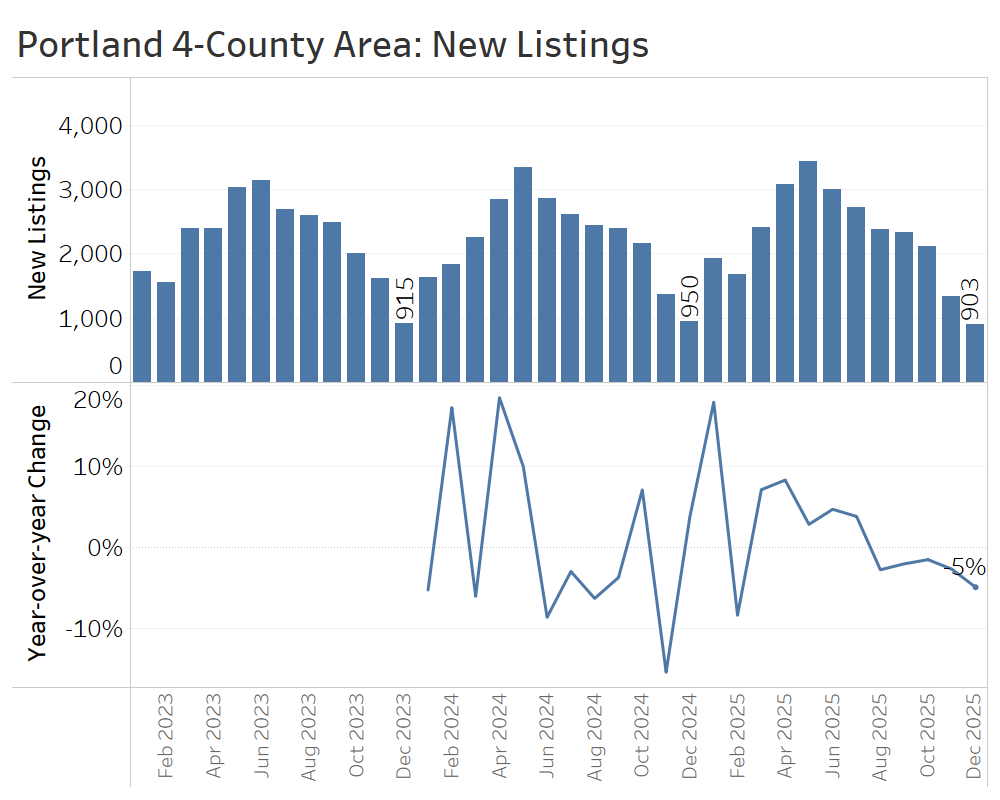
New listings in the fourth quarter of 2025 remained below fourth-quarter 2024 levels for the third straight month, capped by a 5% decline in December, traditionally the quietest month for new listings. The slower inflow of listings to the market has contributed to the more modest inventory growth seen above.
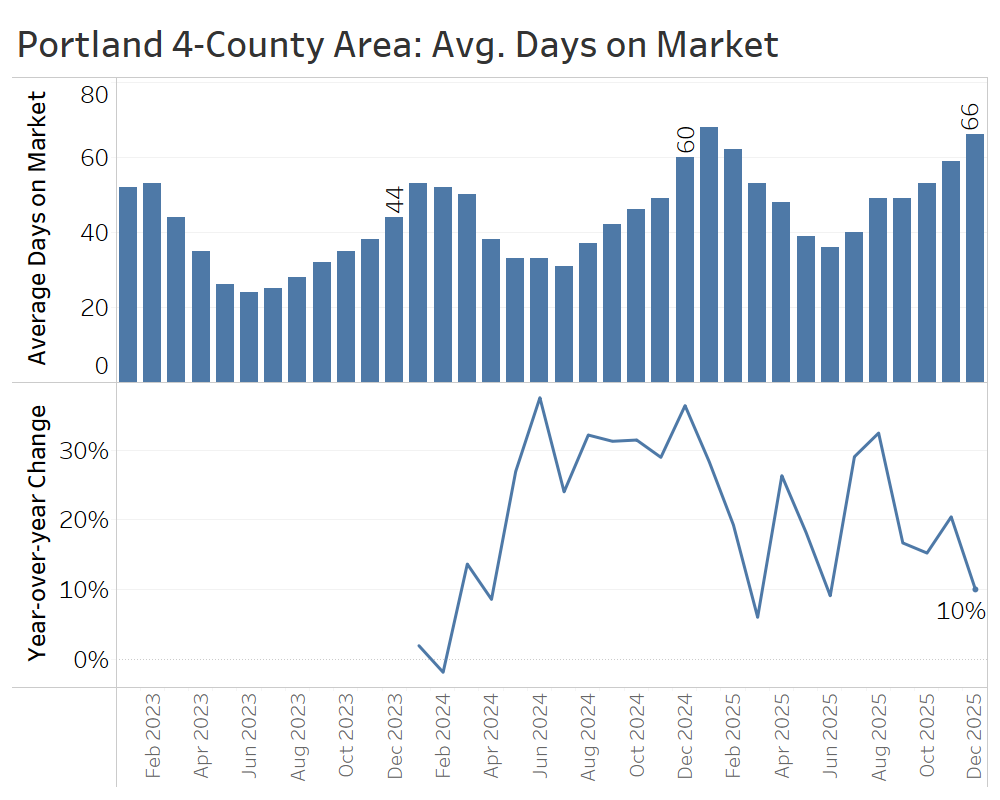
The average home sold after 66 days on the market—about six days longer than December 2024. Homes that linger for several months often end up selling below their original asking price, a trend that has increasingly worked in buyers’ favor in the fourth quarter.
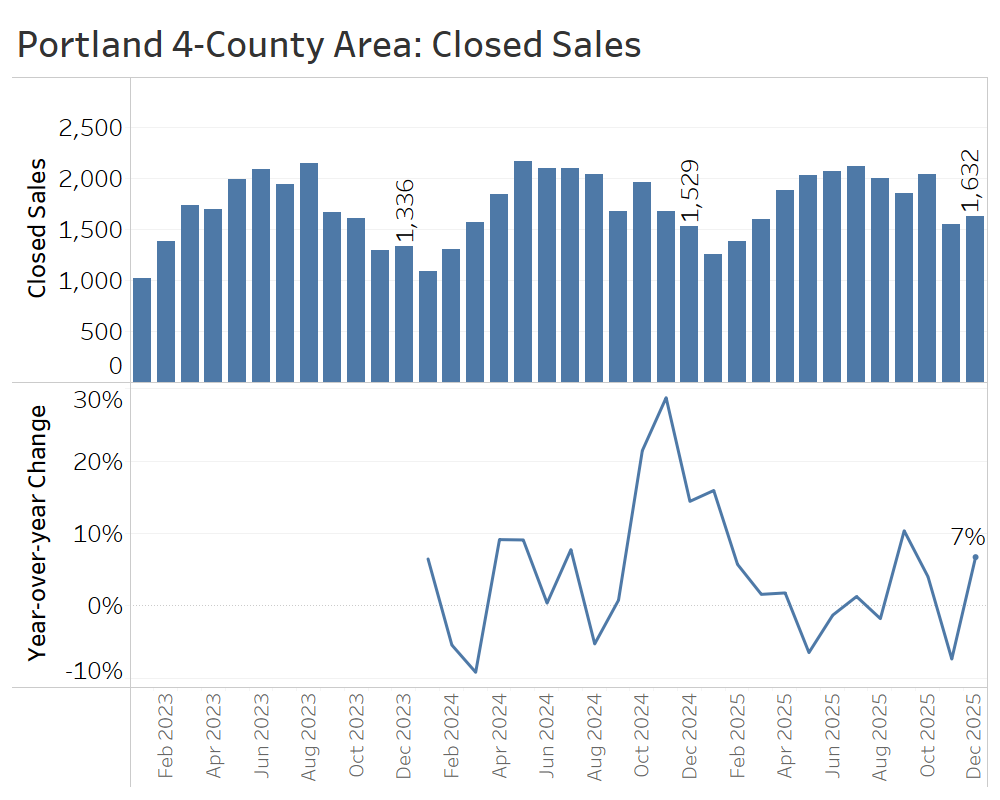
Closed sales of single-family homes rose 7% year over year in December, following a significant dip in November. Overall, the 5,221 closed sales in the fourth quarter narrowly exceeded the 5,162 sales recorded in the final quarter of 2024, suggesting that more buyers were motivated to get off the fence this fall.
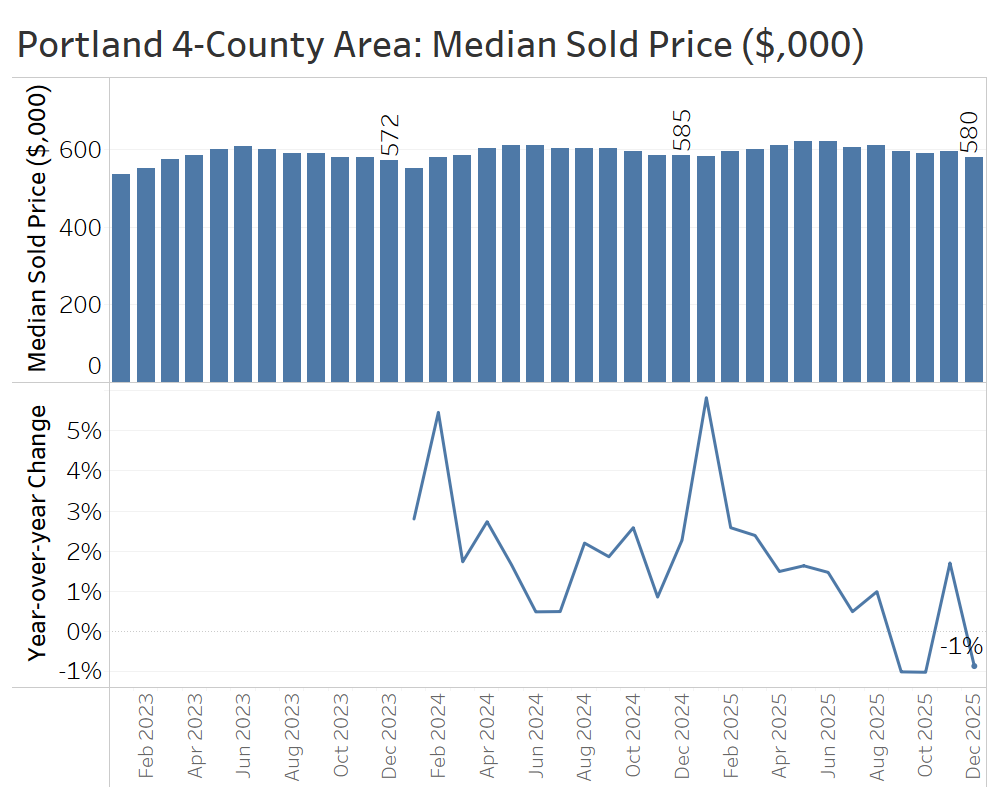
Median home sale prices in the Portland area edged down slightly, ending the year at $580,000 – about 1% below December 2024. Paired with the rebound in sales, this suggests buyers were able to negotiate for some deals at the end of 2025.
The fourth quarter continued to demonstrate the downstream effects of higher inventory in the Portland area: it helped attract buyers and support affordability, while also discouraging some sellers who are likely waiting to list.
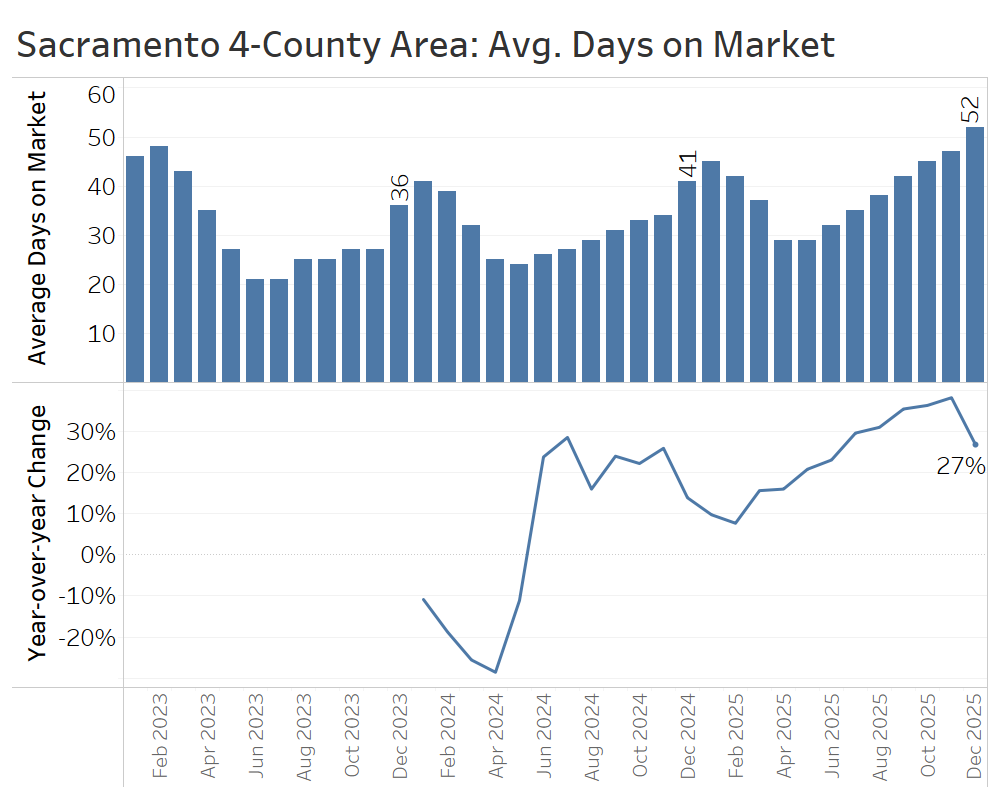
Greater Sacramento Area (Sacramento, Yolo, El Dorado, and Placer Counties)
The Greater Sacramento Area is another market where the advantage has decisively shifted in favor of buyers. Inventory has climbed, prices have cooled, and sales activity has remained relatively flat.
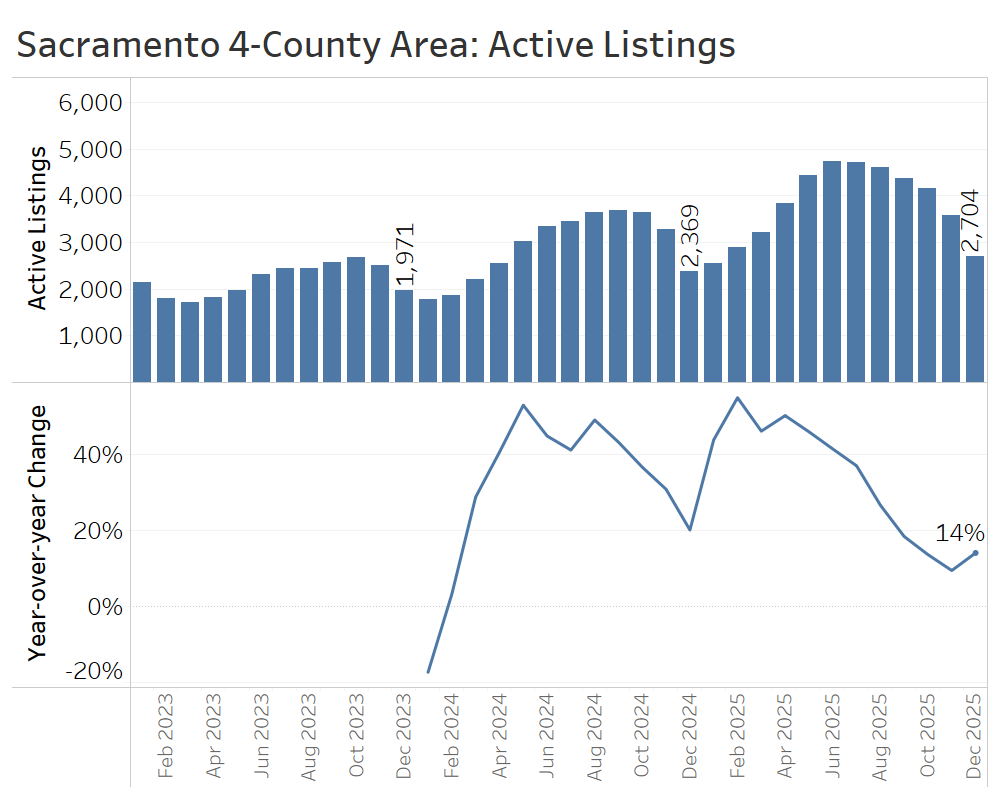
At the end of December, there were about 2,700 active listings—an increase of 14% compared to the end of 2024. Overall, inventory growth in the fourth quarter was much more modest than in early 2025, when listings were up 50% or more compared with 2024.
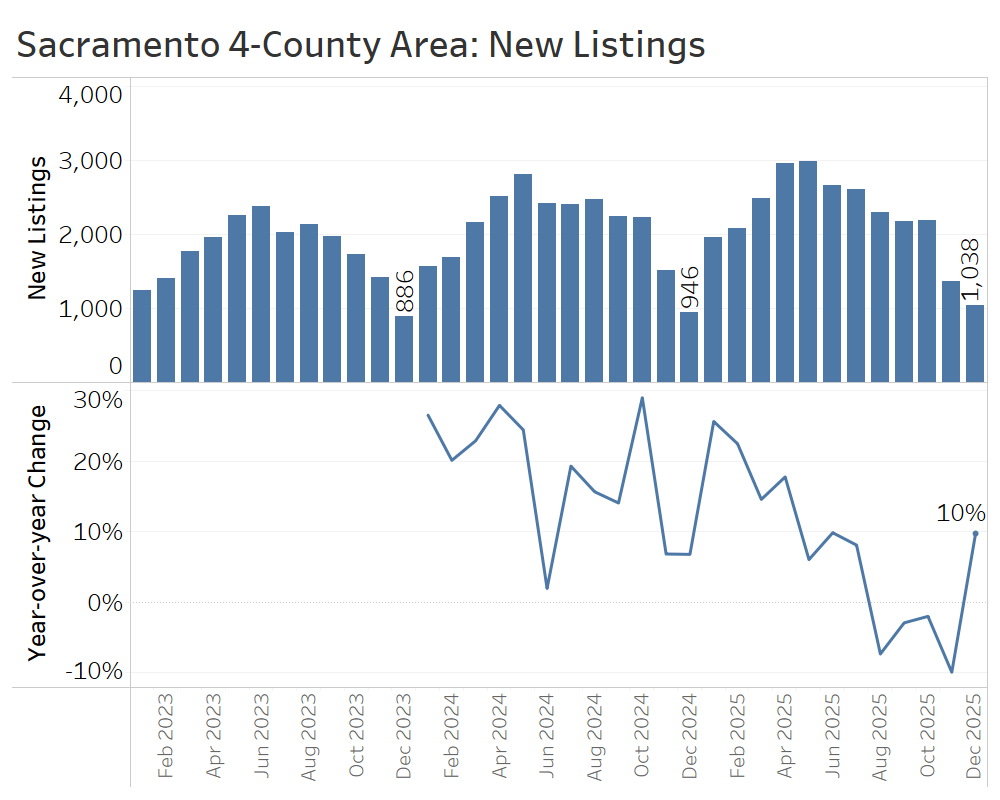
New listings ran below December 2024 levels for four straight months, before ticking up 10% in December 2025—a modest boost to end the year.
Average days on market rose by about 11 days compared to December 2024, reaching 52 days. While this eases some of the pressure on home shoppers, seasonal trends are likely to bring the number down later in the first quarter.
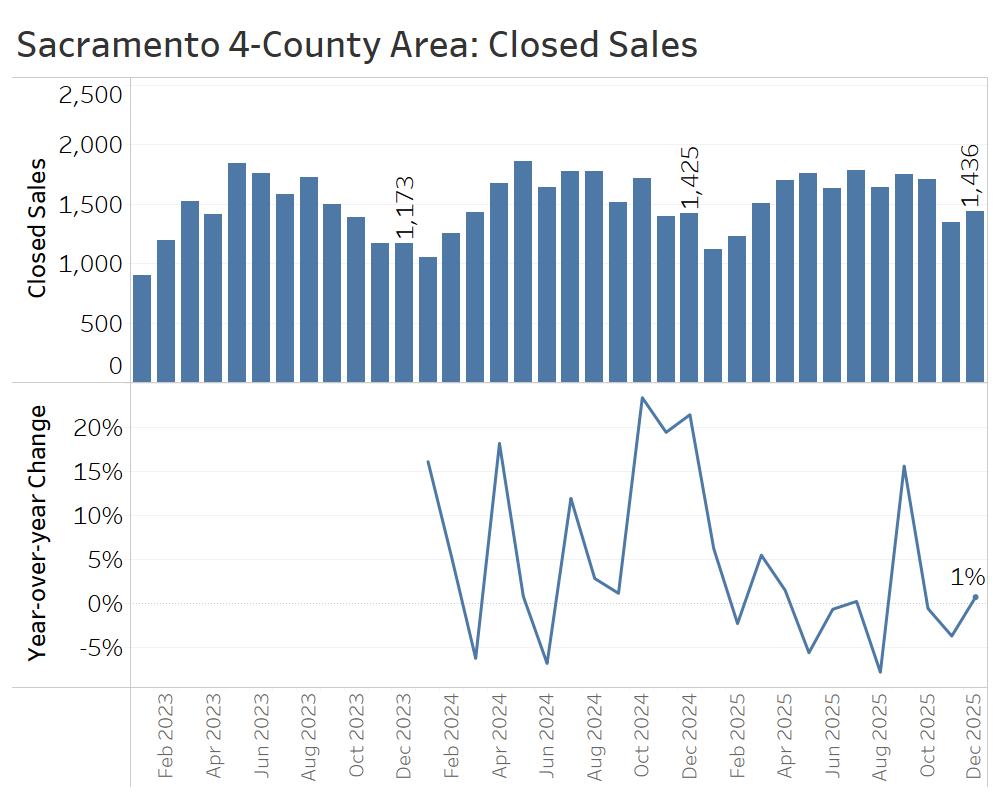
Sales activity in the fourth quarter of 2025 was remarkably similar to the fourth quarter of 2024, with nearly 4,500 homes sold in 2025 compared with just over 4,500 the year before.
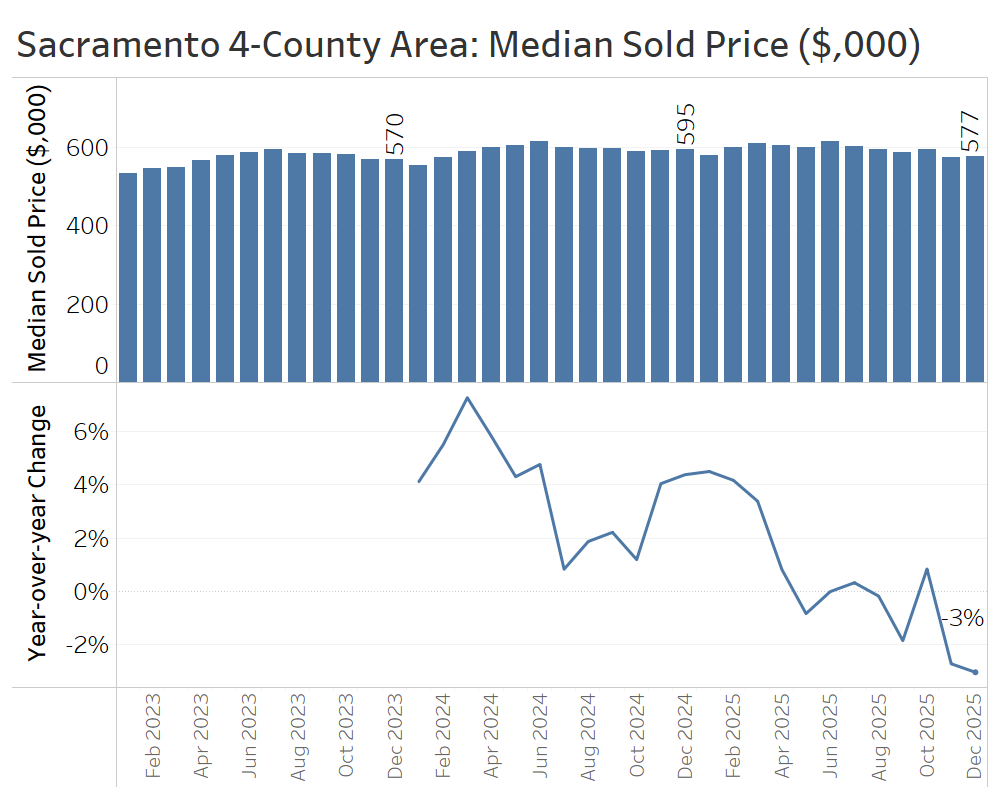
Median sale prices fell 3%, from around $595,000 in December 2024 to $577,000 in December 2025. The main causes of the softer pricing were higher inventory and longer time on market.
The fourth-quarter takeaway in the Greater Sacramento Area is that buyers came to appreciate and act on their greater negotiating power, winning some bargains while sales volume remained basically flat.
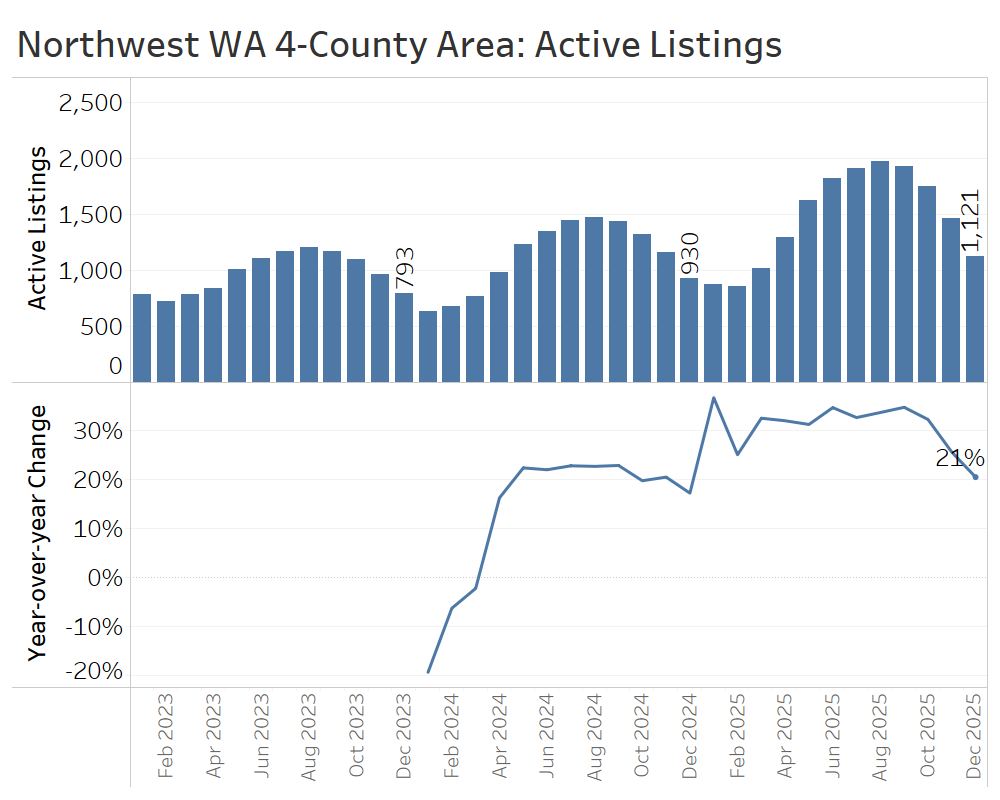
Northwest Washington (Skagit, Whatcom, San Juan, and Island Counties)
The market conditions in the four northernmost counties of Western Washington are experiencing a major shift in favor of buyers.
At the end of December, there were 1,121 active listings, up 21% from a year earlier. That marked a slowdown in inventory growth in the fourth quarter, down from increases of 30% or more in the middle of the year.
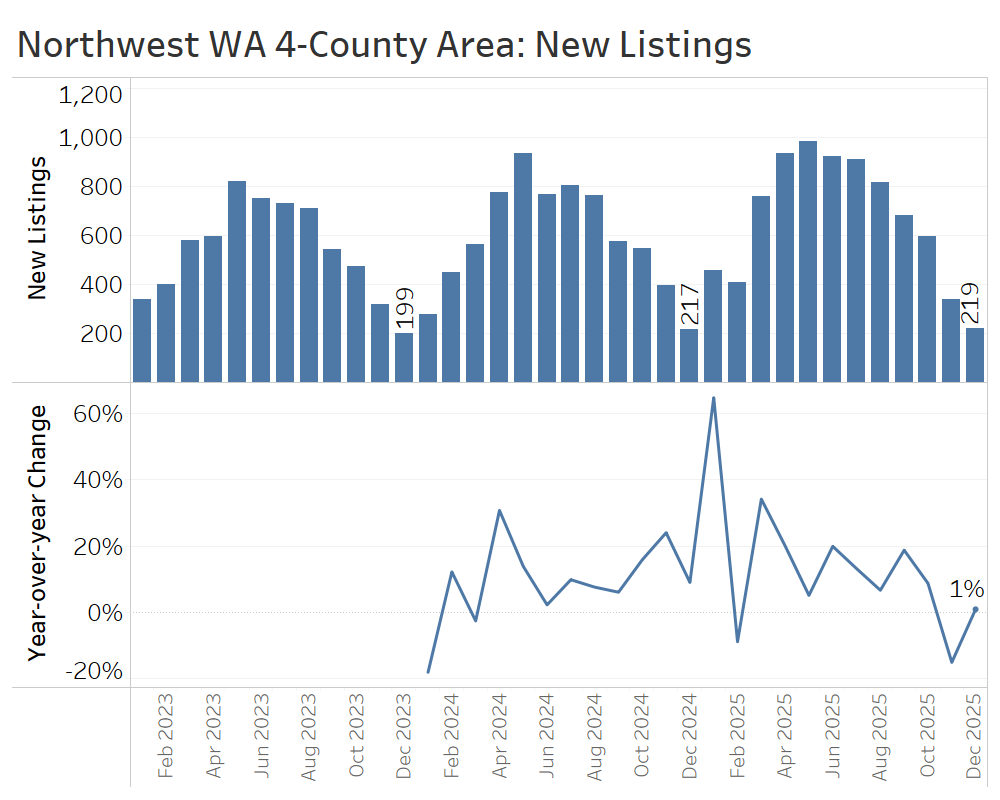
The flow of new listings fell sharply in the fourth quarter, even by seasonal standards. Some listings may have been affected by flooding during the atmospheric rivers that slammed Washington State; others may have been withheld by sellers clued into the cooler selling conditions.
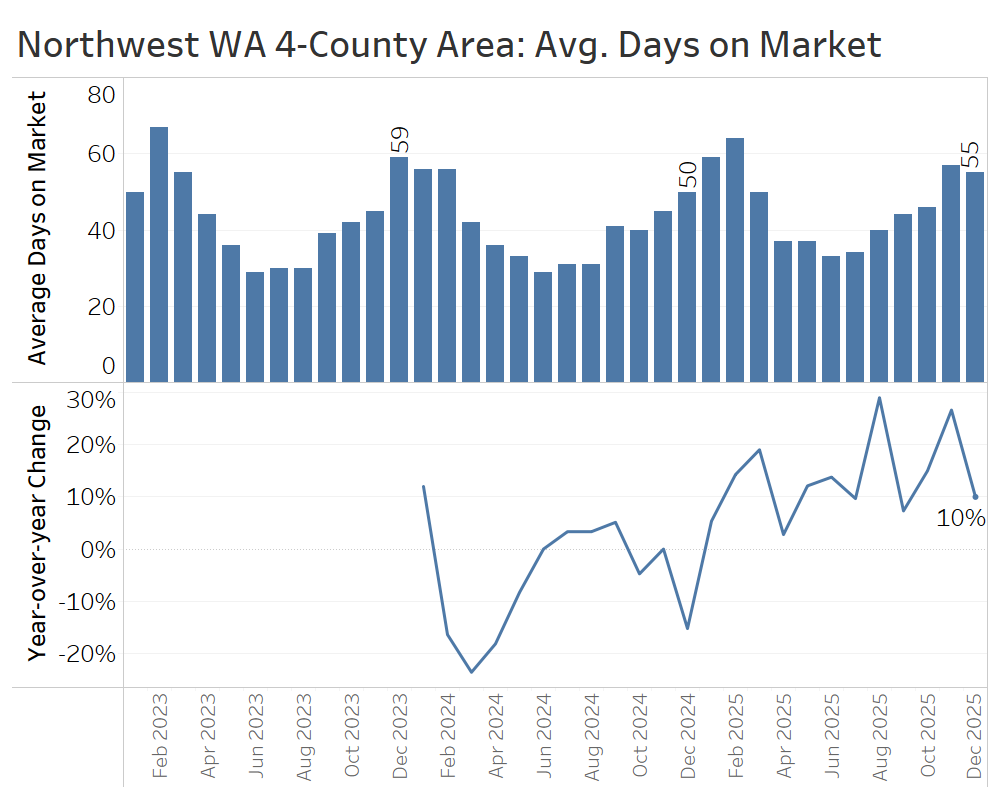
Days on market continued to climb compared to a year earlier, with homes in December taking about five days longer to sell than they did at the same time a year earlier.
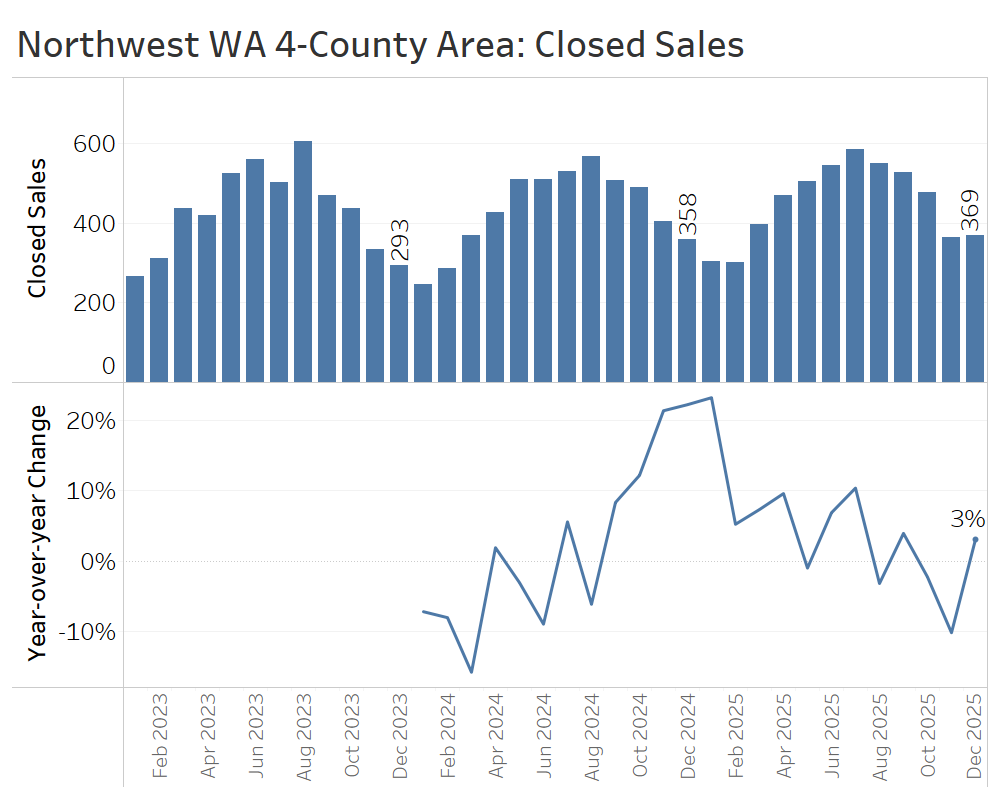
Closed home sales in the fourth quarter of 2025 generally trailed fourth-quarter 2024 levels, except for a modest uptick in December. In total, the 1,210 closed sales for the quarter fell about 4% short of the 1,251 homes sold in the fourth quarter of 2024.
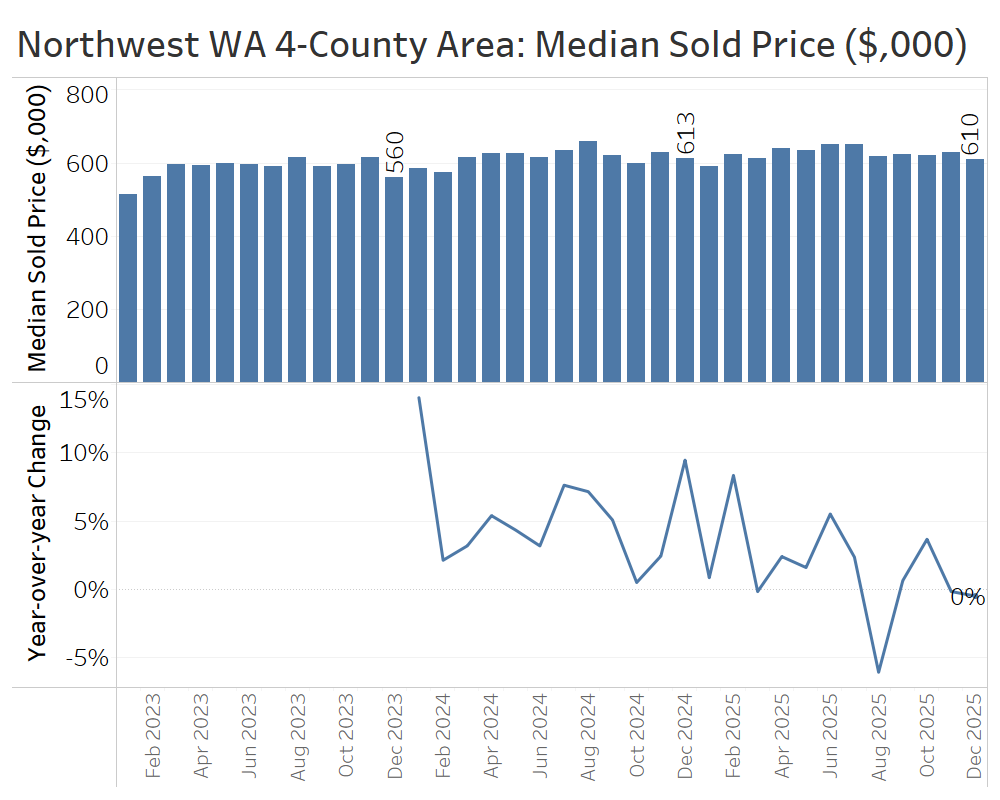
Compared to the same time the previous year, median home prices were virtually flat in November and December, after a brief bump in October. This marks a continuation of the cooldown of price growth that had characterized 2024 and early 2025.
Fourth quarter confirmed that higher inventory levels finally gave buyers more negotiating leverage in Northwest Washington.
Spokane, WA and Coeur d’Alene, ID Area (Spokane and Kootenai Counties)
The greater Spokane-Coeur d’Alene region, spanning the Washington-Idaho border, is experiencing many of the same market trends seen in Western Washington, including higher inventory, softer buyer demand, and flattening home prices.
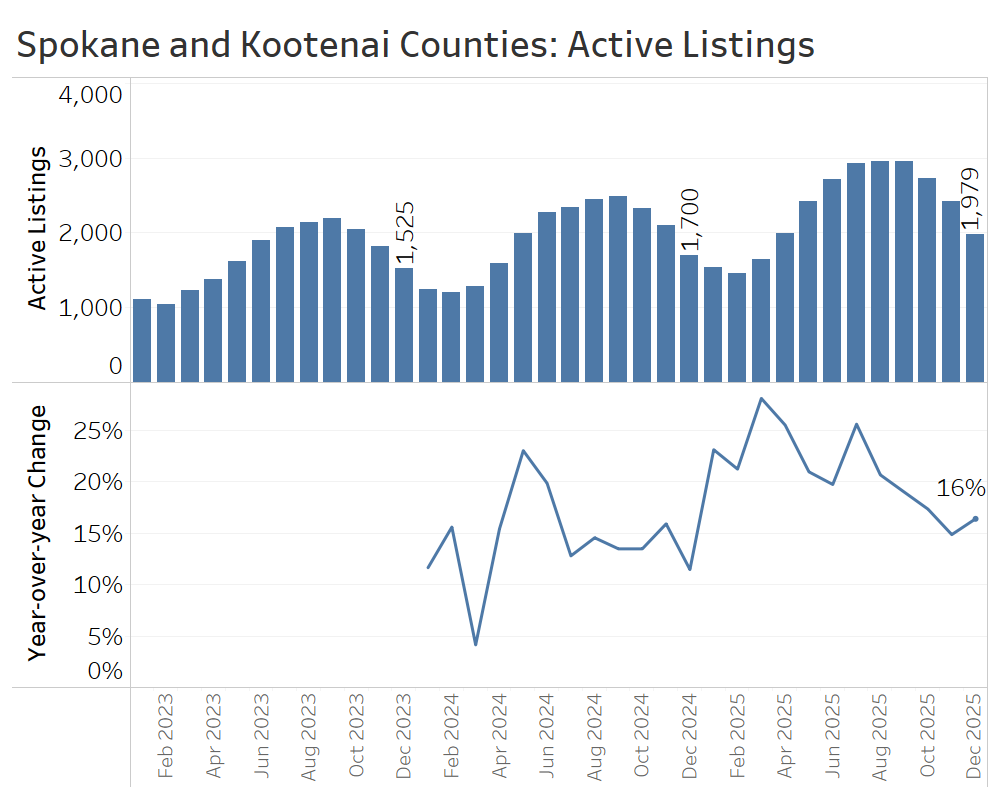
At the end of December, there were 1,979 active listings, up 16% from December 2024. That represented a modest slowdown in inventory growth from the year-over-year increases of more than 20% seen earlier in 2025.
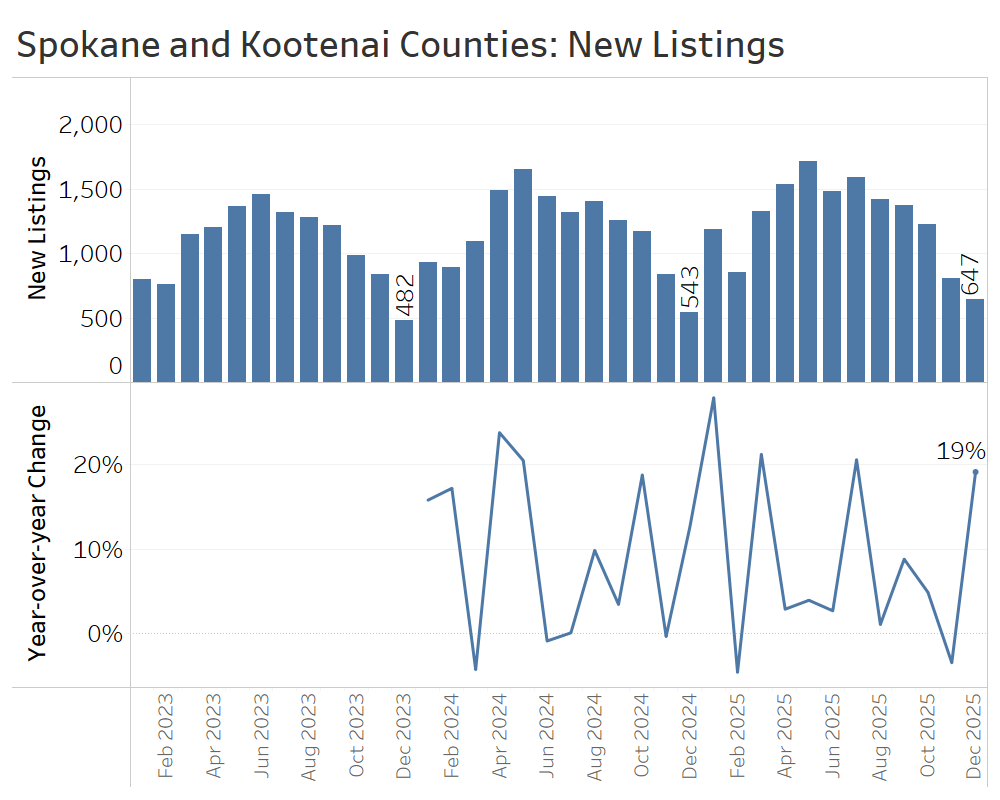
New listings jumped 19% compared to December 2024, but month-to-month changes in new listings were quite volatile. During the quarter as a whole, there were 2,681 new listings, up from 2,549 in the fourth quarter of 2024, representing a 5% increase.
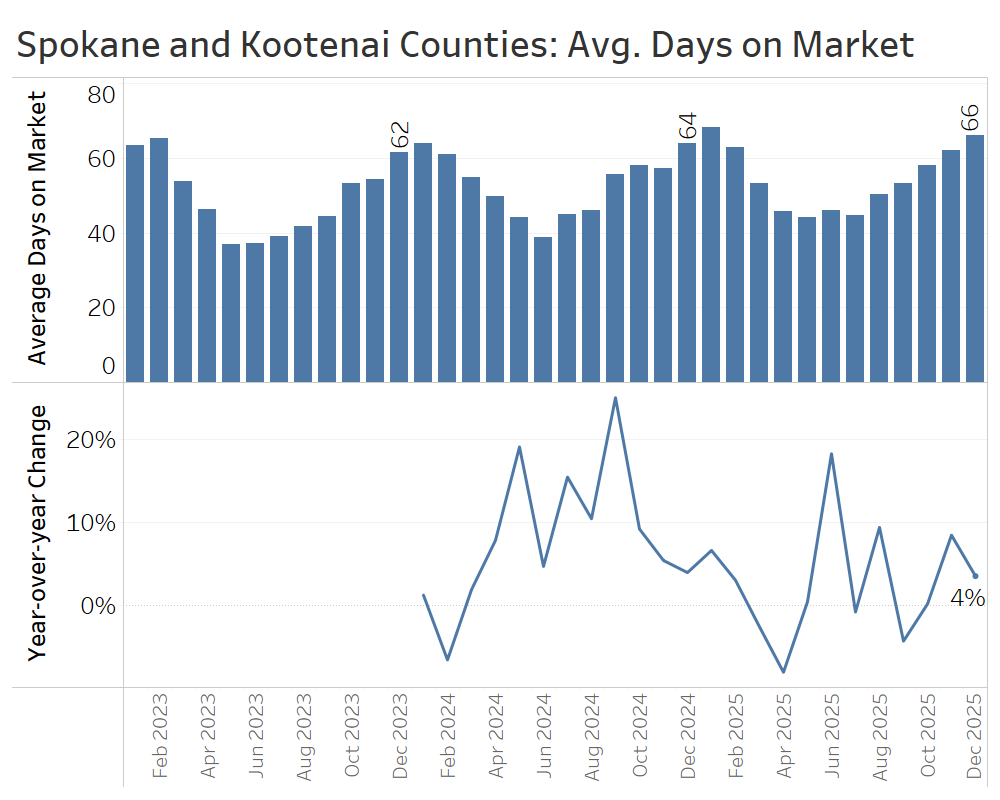
The pace of home sales, which is measured by days on market, only crept up modestly in the fourth quarter, ending the year at 66 days in December. However, that average obscures a wide divide across the state line, with homes averaging 47 days on market in Spokane County compared with 106 days in Kootenai County.
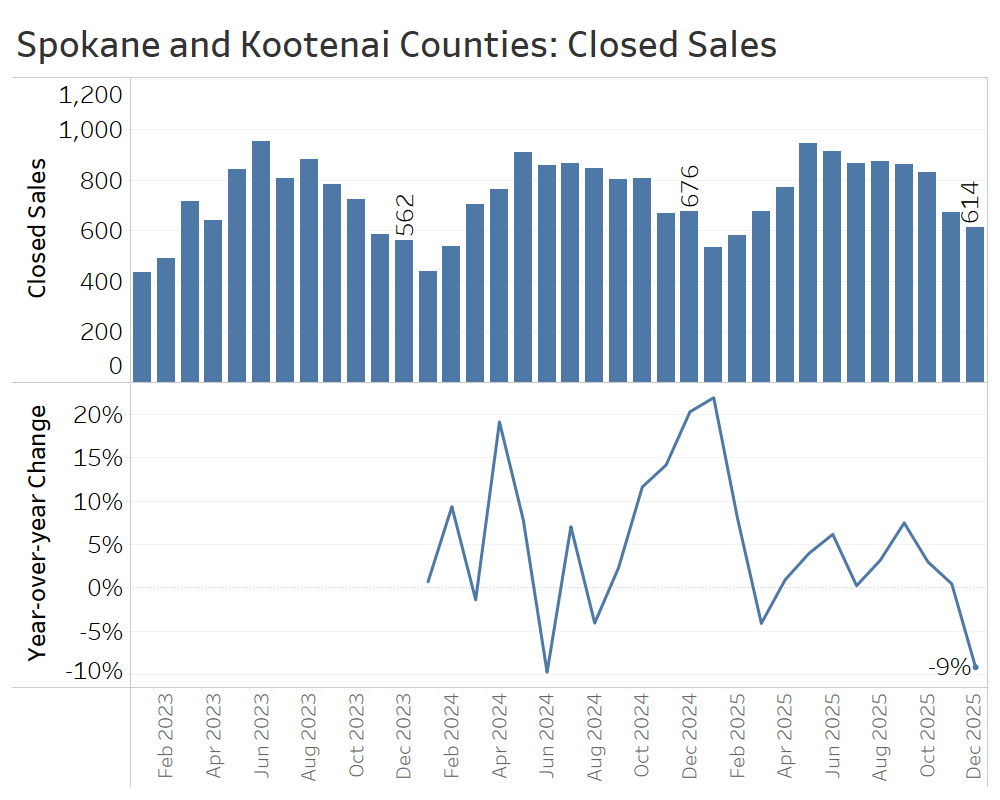
Closed sales in December were down 9% year-over-year, and the quarter also saw a modest decline. Sales slipped from 2,152 in the fourth quarter of 2024 to 2,117 in the fourth quarter of 2025.
Because of challenges associated with combining data from multiple MLSs, we report average sale prices rather than medians for the Spokane-Coeur d’Alene area. Compared with December 2024, the average sale price in December rose about 2%, from $550,000 to $561,000. For the quarter as a whole, average prices also increased 2%, rising from $560,000 in the fourth quarter of 2024 to $572,000 in the fourth quarter of 2025.
That increase was driven entirely by higher average sale prices in Kootenai County, where prices climbed 8%, while average prices in Spokane County fell 2%.
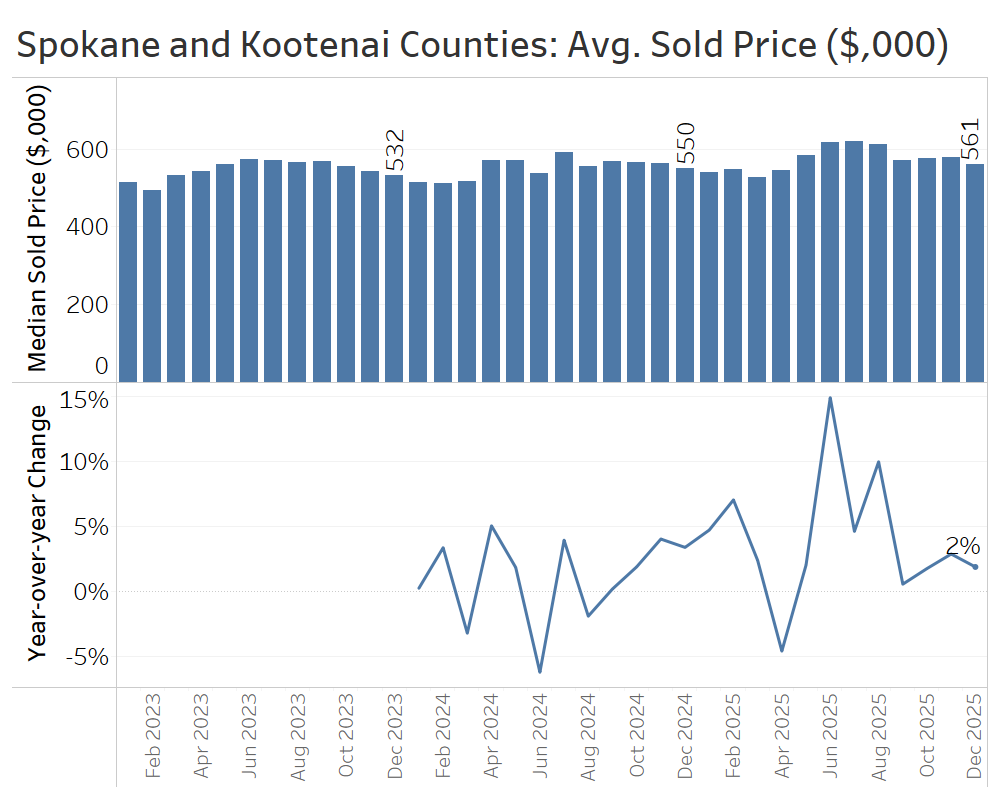
Altogether, the shift towards a buyer’s market in the greater Spokane-Coeur d’Alene area began to flatten prices without yielding an increase in sales. Many metrics diverged across the Washington-Idaho border, with evidence of resilient demand for homes at Coeur d’Alene’s higher price points, while demand lagged in Spokane County.
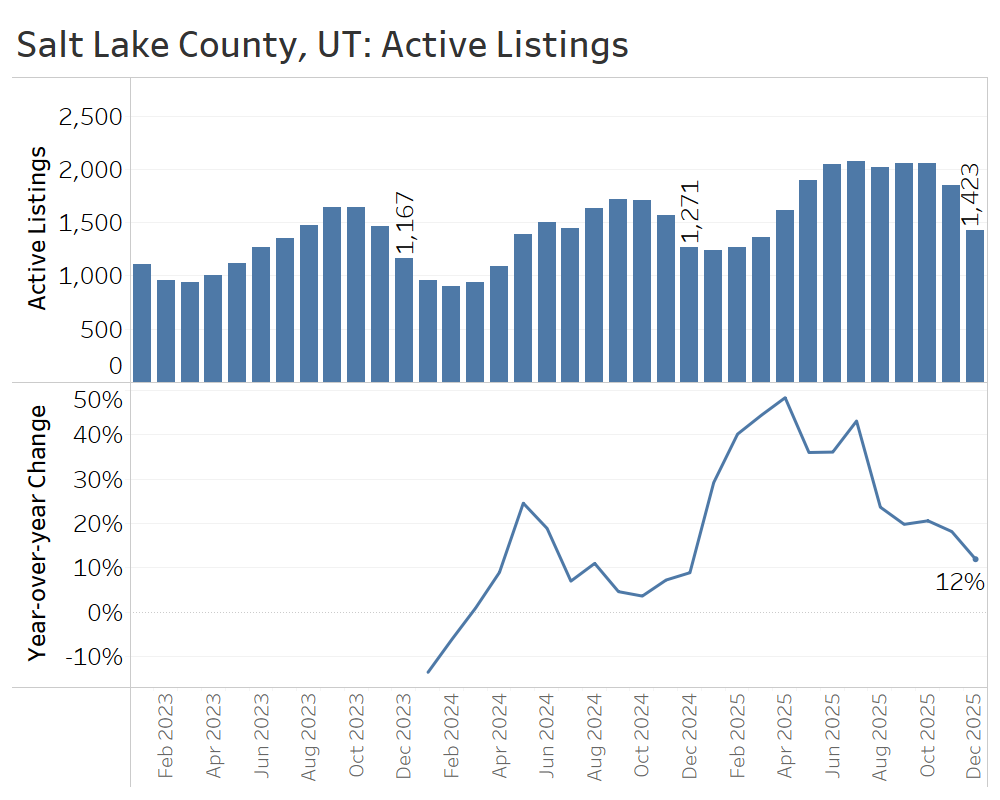
Salt Lake County, Utah
Market conditions in Salt Lake County swung sharply in buyers’ favor early in 2025, as rapid inventory growth led to modest price declines. More recently, however, the market has begun to look more balanced rather than distinctly a buyer’s market.
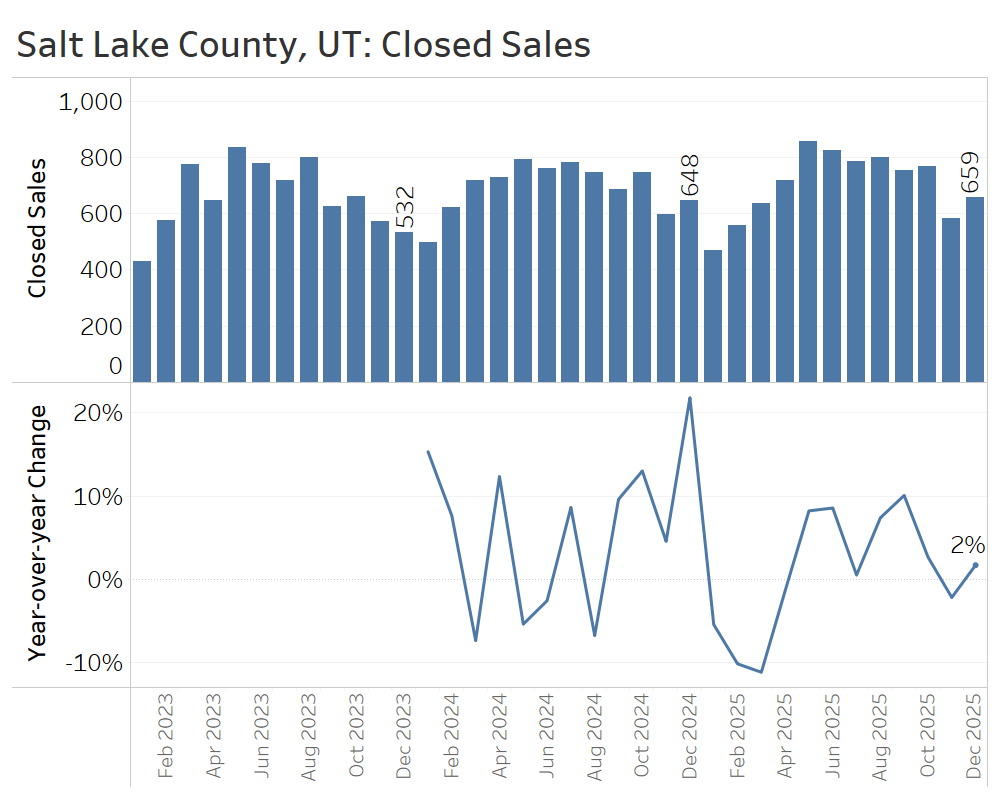
Active listings at the end of December stood at 1,423 homes, up 12% from a year ago—a major slowdown from the 43% inventory growth seen in July of last year.
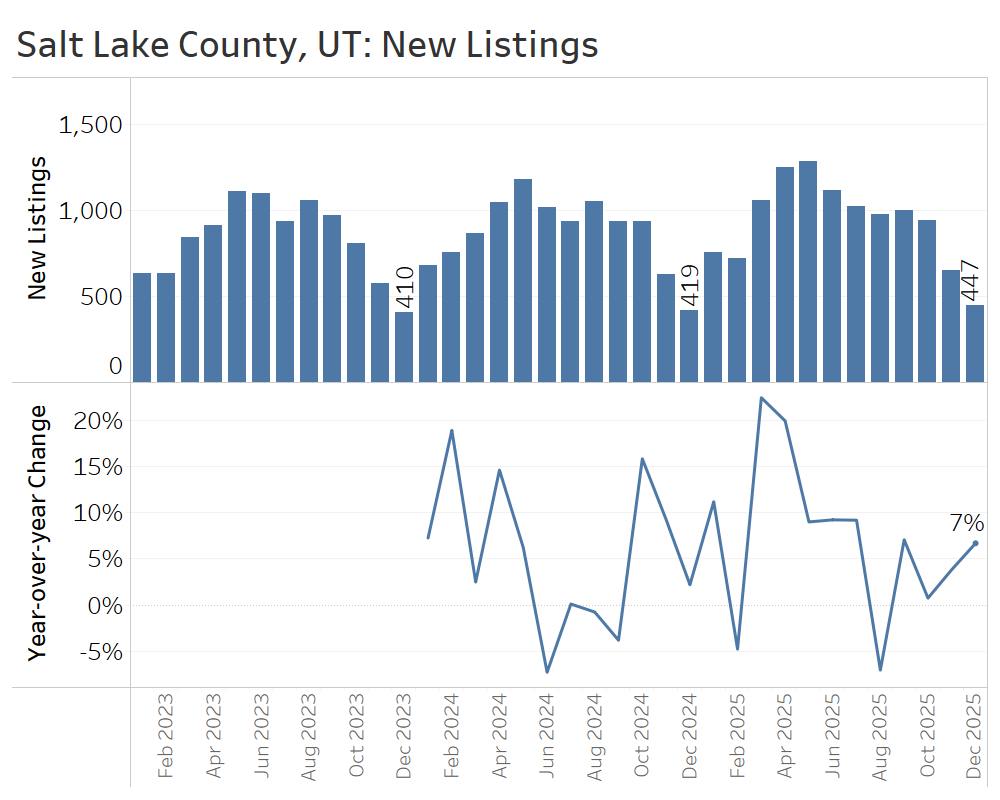
Salt Lake County experienced strong year-over-year growth in new listings early in 2025, exceeding 20% in March and April, but slowing to just 7% growth in December. The waning seller enthusiasm is helping to rebalance the market.
The average number of days it took to sell a home in Salt Lake County ended the year at 61 days, just slightly longer than the 60-day average at the end of 2024.
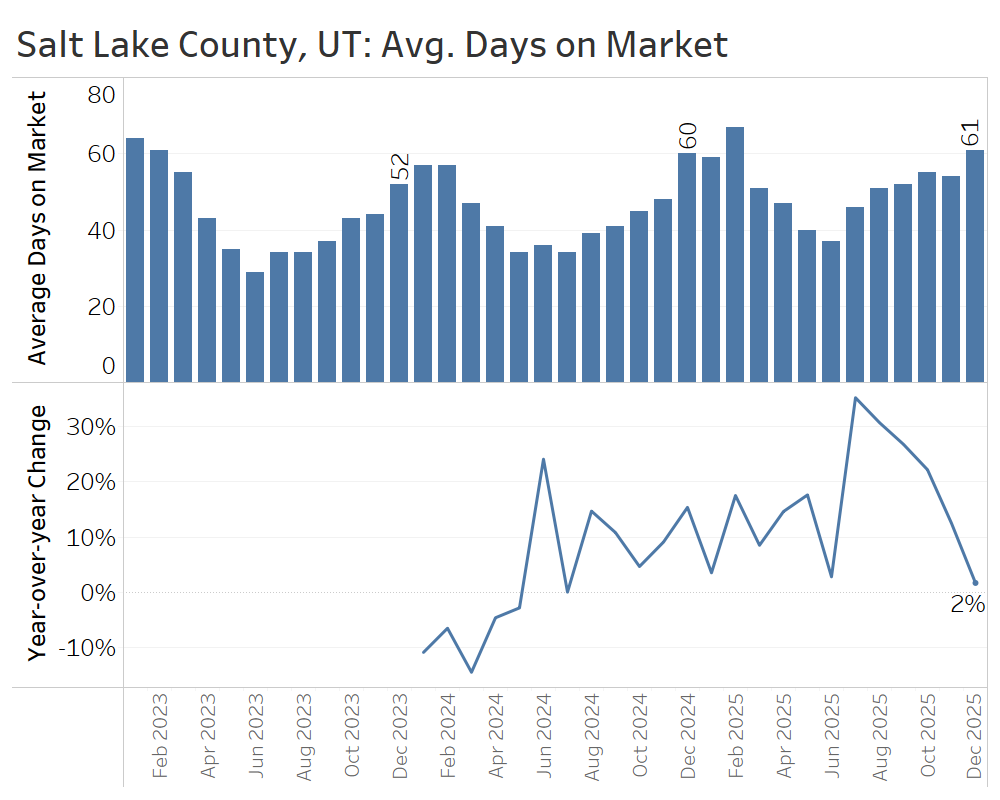
Closed home sales in December 2025 rose 2% compared to December 2024, capping a fourth quarter that roughly matched the strong sales seen in the same period the year before.
In December, the median sale price in Salt Lake County rose 5% year over year—from $594,000 to $625,000. That marked the fifth straight month of price gains, reversing a trend of modest price declines in mid-summer.
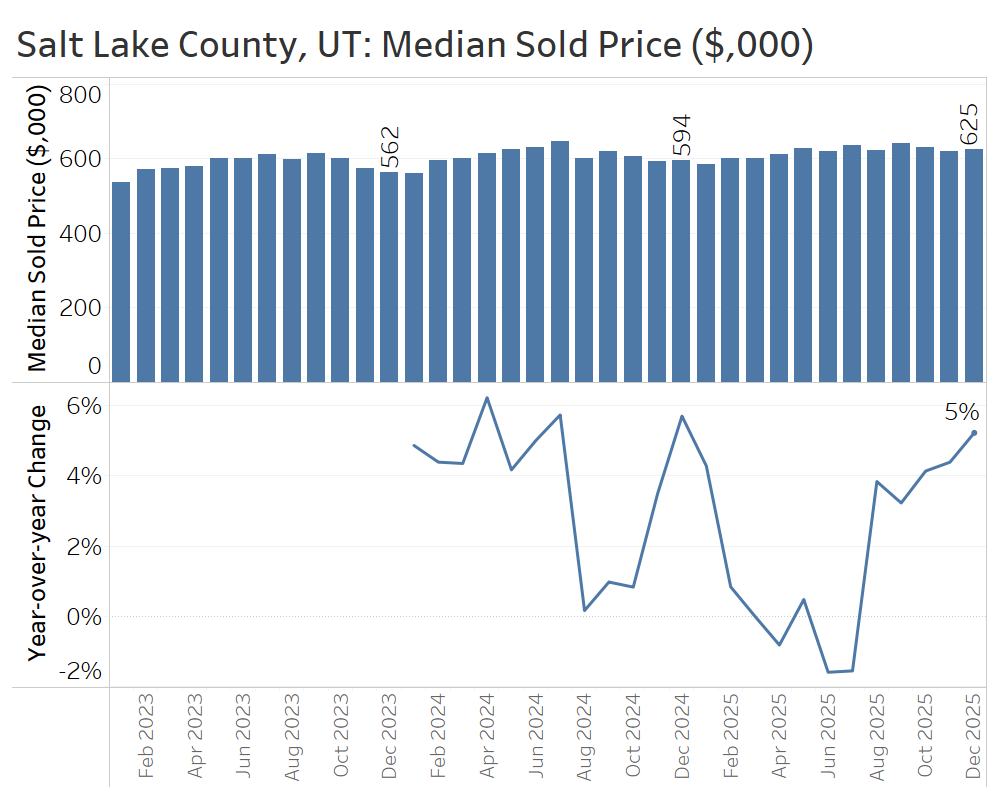
All in all, Salt Lake County has shifted into a more balanced market, driven by modest price growth and a slowdown from the significant inventory buildup seen earlier in 2025.
Conclusion:
All of the markets covered in this report shifted in buyers’ favor in 2025, though some, like Salt Lake County, show that the pendulum can—and will—begin to swing back toward more balanced conditions.
Going forward, buyers should be aware that in most markets, there are more listings than in recent years, home prices have remained roughly flat for at least a year, and mortgage rates are near three-year lows. Together, these factors create a strong opportunity to buy. That said, buyers should also be mindful of the usual spring surge in competition, which will accelerate home sales and push prices higher, as it does every year. Savvy buyers can try to get ahead by shopping earlier, but they should also be prepared to write a competitive offer if their ideal home hits the market this spring.
For sellers, the peak selling season is fast approaching. But even in a more balanced market, homes do not sell themselves. The best outcomes still depend on presenting the home well, setting the right list price, and marketing effectively to the right buyers. With the right strategy, this spring presents a great opportunity to sell for the best possible price, especially as lower mortgage rates bring more buyers off the fence.
Sources: TrendGraphix analysis of NWMLS, RMLS, Spokane MLS, MetroList MLS, and Wasatch Front MLS data.
")


