
 Facebook
 X
X
 Pinterest
 Copy Link

This is the first in a recurring series of blog posts taking a closer look at the U.S. economy and several major regional markets in Windermere’s nine-state footprint. Updates will be released on a quarterly basis.
Economic Overview
After a slow spring, the U.S. housing market cooled further this summer, with price gains leveling off and sales holding steady. Existing home sales have hovered around an annualized pace of 4 million through August—nearly identical to last year’s unusually low 4.06 million. Mortgage rates dropped in the third quarter, falling from an average of 6.82% in May and June to 6.35% in September. The combination of rising inventory, softer pricing, and lower mortgage rates is making this fall a good time to buy a home.

Source: Freddie Mac via FRED.
A key driver behind falling mortgage rates is the cooling U.S. economy, following a sharp slowdown in job growth over the summer. After revisions, nonfarm payrolls show little to no growth from April through August, and the next jobs reports are on hold due to the government shutdown. While slower growth poses challenges, it often brings the silver lining of lower interest rates—and this cycle appears to be following that pattern.
The following is a detailed overview of recent housing trends across six regional markets within Windermere’s footprint during the third quarter of 2025. They include Greater Seattle Area, Greater Portland Area, Greater Sacramento Area, Northwest Washington State, Spokane County, and Salt Lake County.
Greater Seattle Area (King, Snohomish, Pierce, and Kitsap Counties)
High inventory in the greater Seattle area has swung the balance of negotiating power in buyers’ favor across the region this year. As of the end of September, buyers could choose from nearly 9,200 active listings—8% more than the same time in 2024. Still, inventory growth has slowed throughout Q3, from a peak of 48% year-over-year growth back in May. Slower inventory growth means we are not headed for a glut of listings, which is good news for sellers.
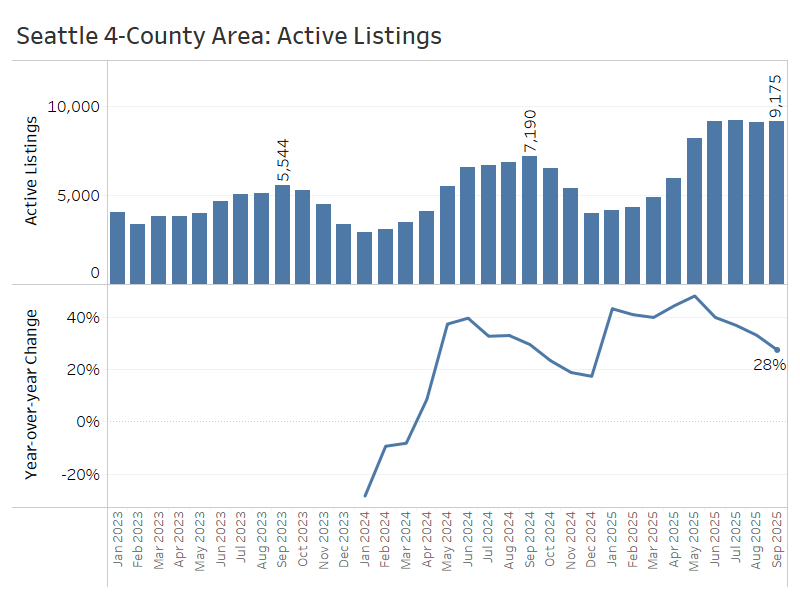
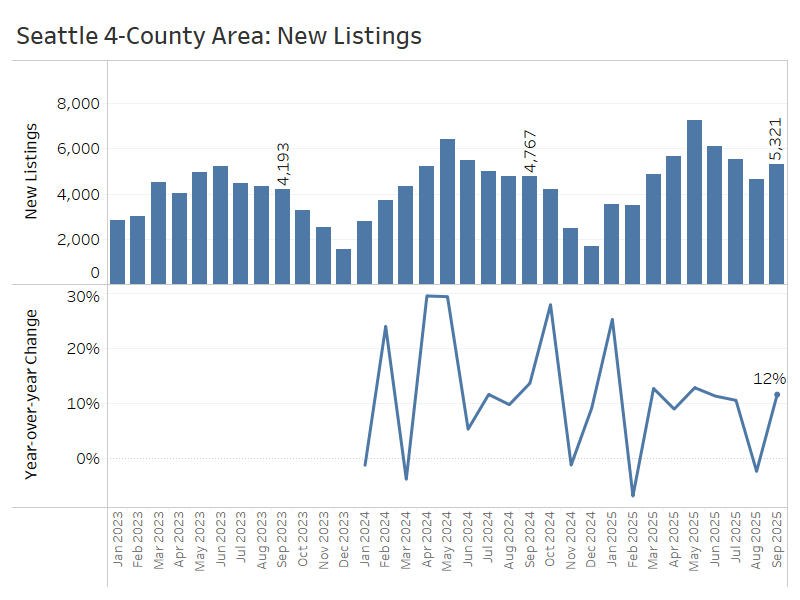
Inventory growth reflects several consecutive months of rising new listings outpacing closed sales, which gradually replenishes the supply of homes for sale. In September, the greater Seattle area had just over 5,300 new listings—about 12% more than last September. The entirety of Q3 reported 15,500 new listings, a 7% increase from Q3 2024.
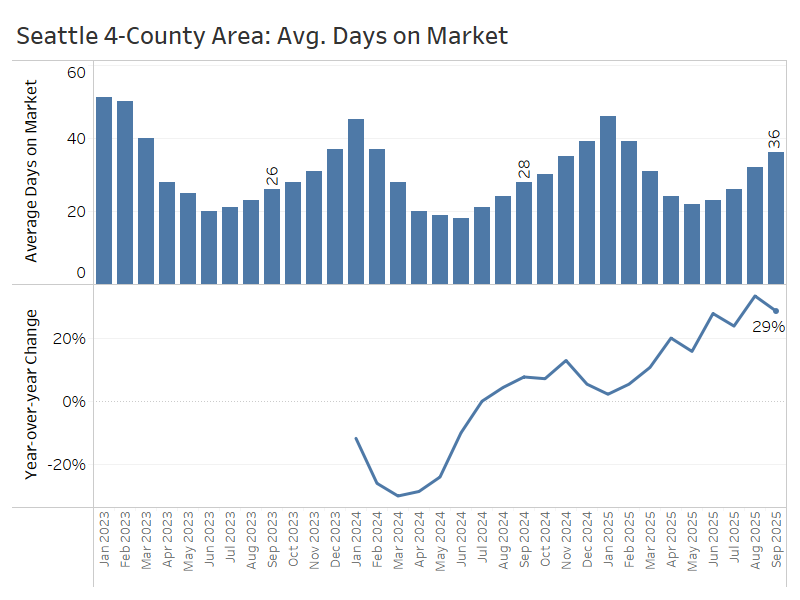
Not only do buyers have more options compared to a year ago, but they are also seeing listings linger on the market longer : an average of 36 days on market in September, up from 28 days last year. Days on market were substantially longer than last year’s levels in each month of Q3.
Unfortunately, the growth of inventory and new listings has not done much to generate home sales. Closed sales in September totaled just under 3,500—virtually unchanged from the same period last year—following year-over-year declines of 3% in July and 4% in August.

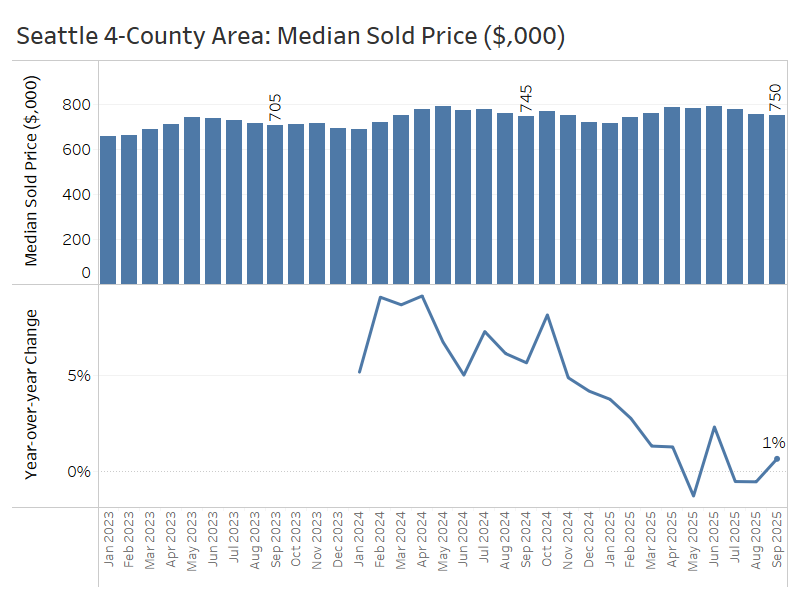
Home prices remain flat alongside sales. September’s median price of $750,000 was up less than 1% from a year ago, after slight declines in July and August. High mortgage rates and affordability challenges are capping price growth, while rising inventory will likely put downward pressure on prices going forward. The wildcard is seller behavior—whether they’ll cut prices to sell or hold firm and wait.
The greater Seattle region is still grappling with elevated inventory, but it has clearly passed an inflection point: inventory growth decelerated over the third quarter, preventing conditions from swinging much further in buyers’ favor. As it stands, they’ll still have ample options and negotiating leverage this fall and winter.
Greater Portland Area (Multnomah, Washington, Clackamas, and Clark Counties)
Broadly speaking, the greater Portland area housing market has entered the same holding pattern as many other Western U.S. cities: flat sales and prices; rising inventory and days on market; more negotiating power and options for buyers.
Active listings in the Portland area now stand close to 5,800, or about 17% more than this time last year. But the pace of inventory growth has decreased sharply since hitting 33% in April.
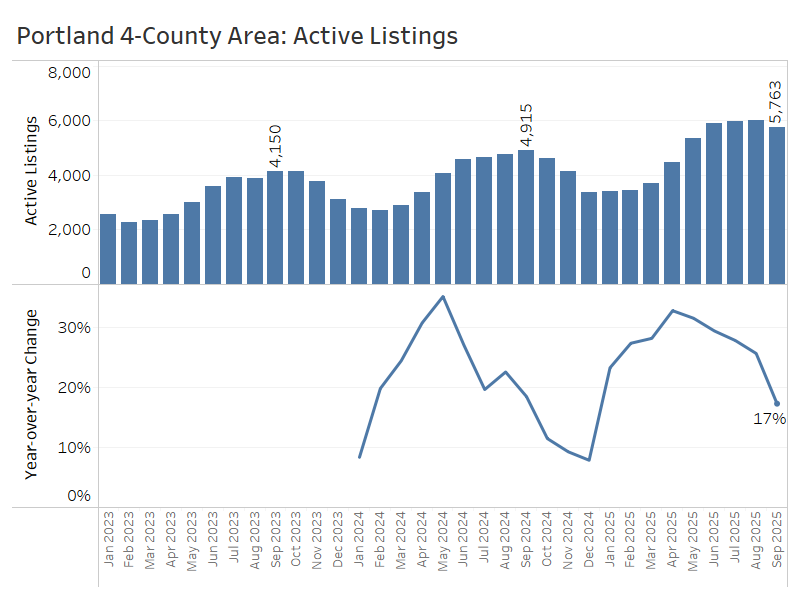
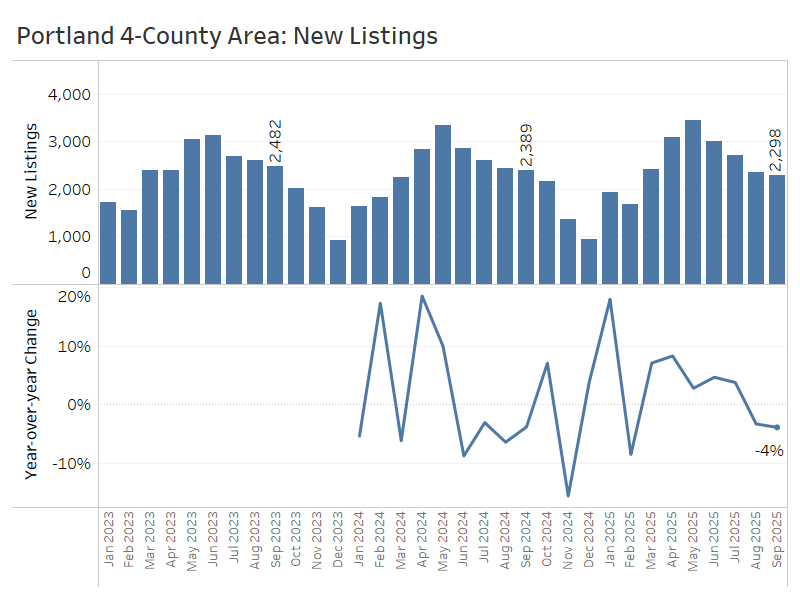
The slowdown in inventory growth can partly be attributed to a lower flow of new listings. The four–county Portland area saw year-over-year declines in new listings in both August and September, as some homeowners balked at listing in a slower market.
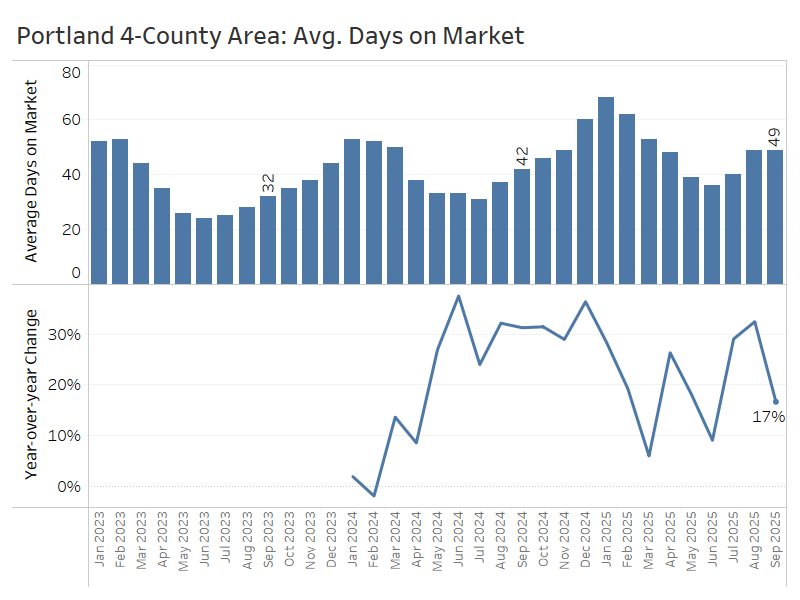
The average home sold after 49 days on the market—about a week longer than last September. This slower pace helps explain the higher inventory levels observed this year.
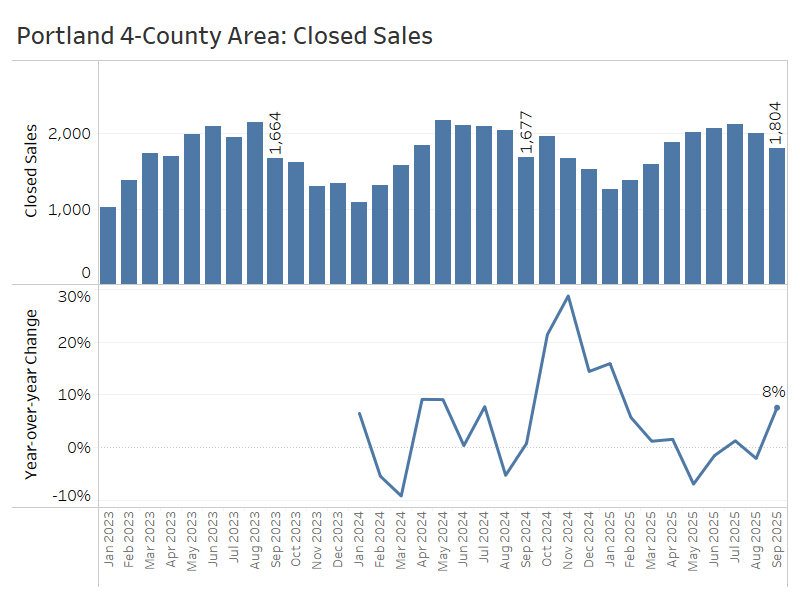
Closed sales of single-family homes climbed 8% year over year in September, following relatively flat activity in July and August. Sales volume momentum dropped sharply in May of this year, after impressive growth in late 2024.
Alongside rebounding sales activity in September, the median home price edged slightly below year-ago levels—slipping from just over $600,000 to about $595,000. This trend of flat or modestly negative price growth is giving household incomes some time to catch up with the higher mortgage costs we’ve seen this year.
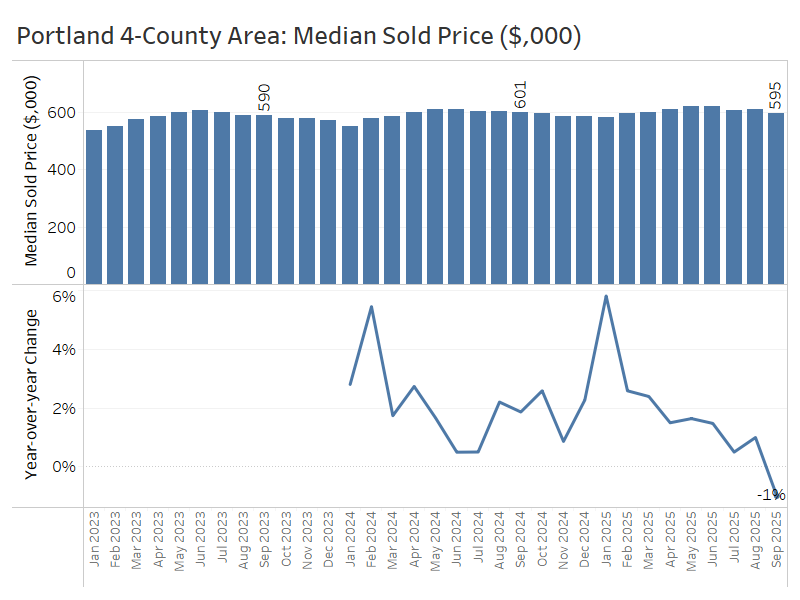
All in all, the greater Portland area seems to be working through the early stages of a market cooldown. The buildup of inventory is beginning to put downward pressure on home prices, which appears to be discouraging some would-be sellers while also creating opportunities for buyers.
Greater Sacramento Area (Sacramento, Yolo, El Dorado, and Placer Counties)
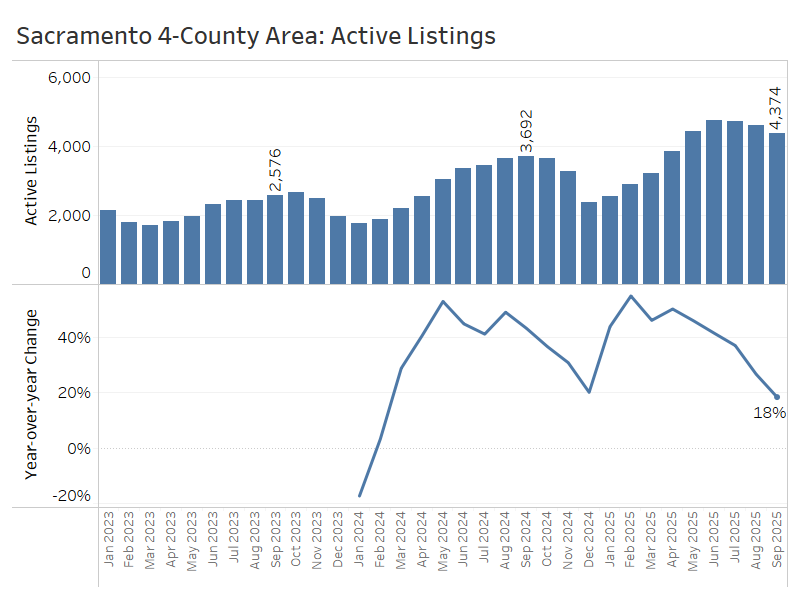
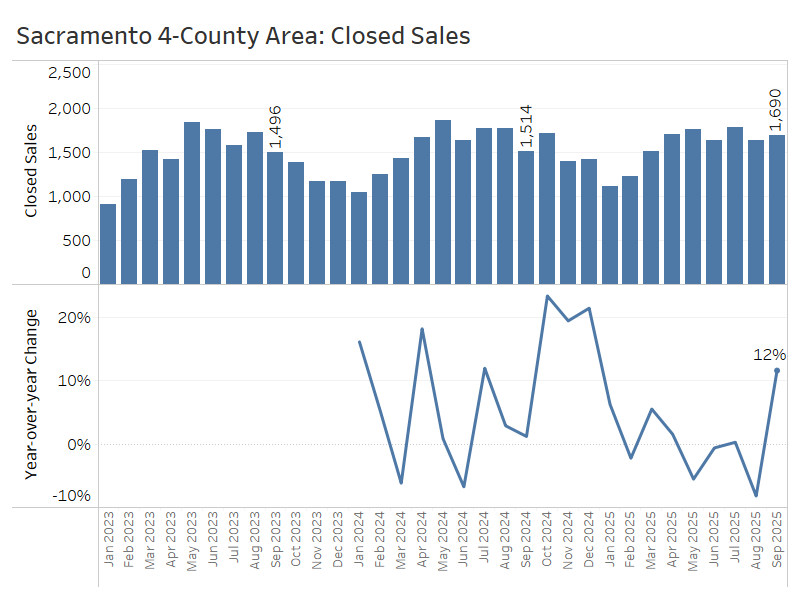
The greater Sacramento area has followed a similar trajectory to Portland, with market conditions gradually shifting in favor of buyers. Inventory has climbed, prices have cooled, and sales activity has remained relatively flat. That said, the pace of inventory growth has recently slowed, and home sales perked up in September, hinting at a possible shift in momentum.
At the end of September, there were nearly 4,400 active listings—an increase of 18% compared to the same time last year. However, the pace of inventory growth has slowed considerably since earlier in the year when year-over-year gains peaked at 55% in February.
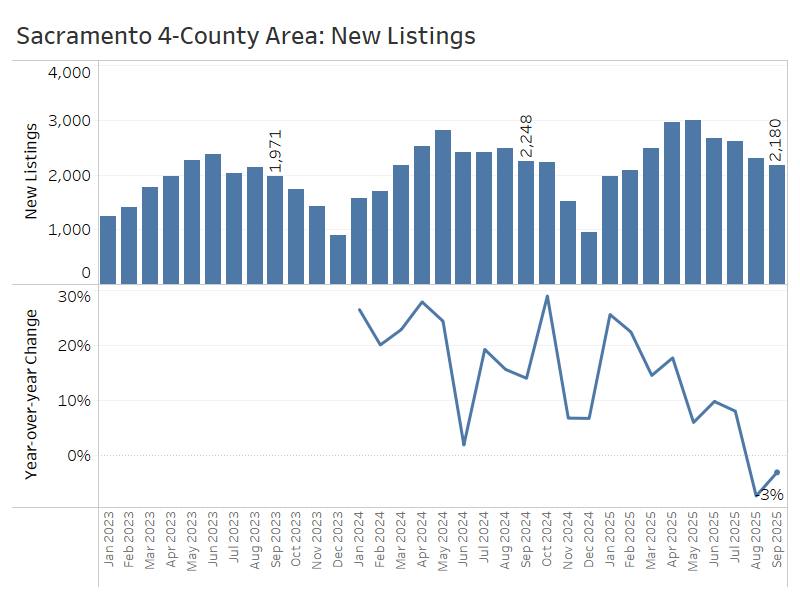
The flow of new listings has fallen below its year-ago pace for two months running now, with about 3% fewer new listings in September than last year.
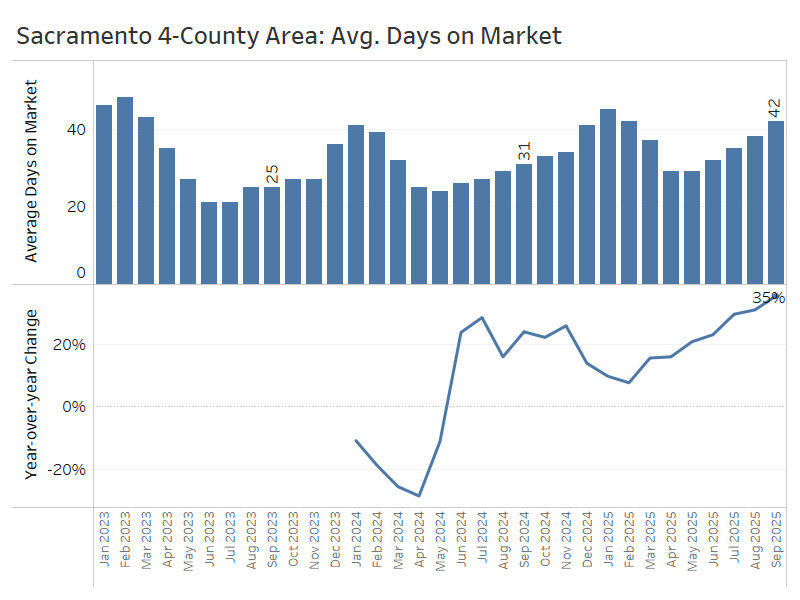
Average days on market rose by about 11 days compared to last year, reaching 42 days in September—a noticeable shift in how long homes are taking to sell.
After a period of solid sales growth in Q4 of 2024, the Sacramento region returned to low or negative growth through much of 2025. However, September saw a 12% year-over-year increase in sales, which might reflect a rebound from a weak August or a boost in buyers attracted to lower mortgage rates in the third quarter.
Median sale prices dipped 1%, from about $598,000 last September to $590,000 this year, after staying steady at almost exactly year-ago levels in July and August.
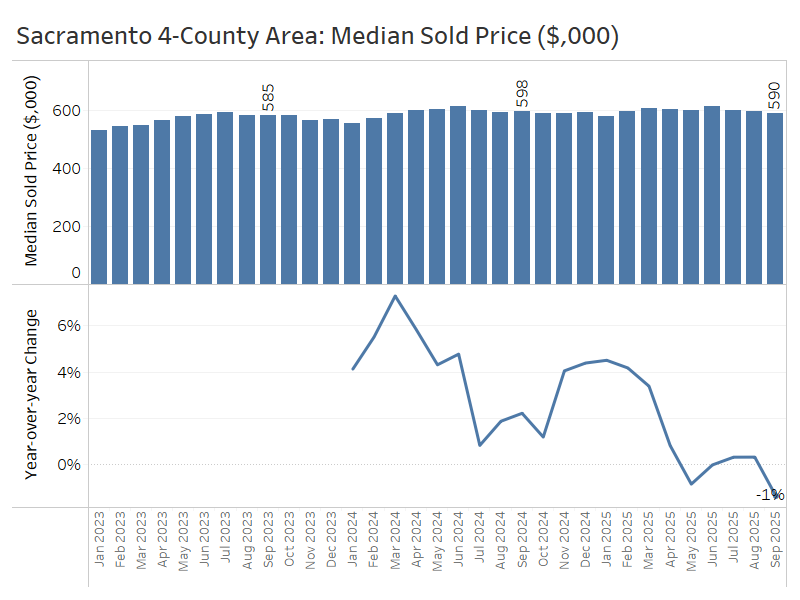
Third-quarter trends in the greater Sacramento area point to a market where rising inventory is finally putting modest downward pressure on prices, even as falling mortgage rates begin to draw some buyers back. That combination could result in an upturn in sales alongside flat price growth.
Northwest Washington – Skagit, Whatcom, San Juan, and Island Counties
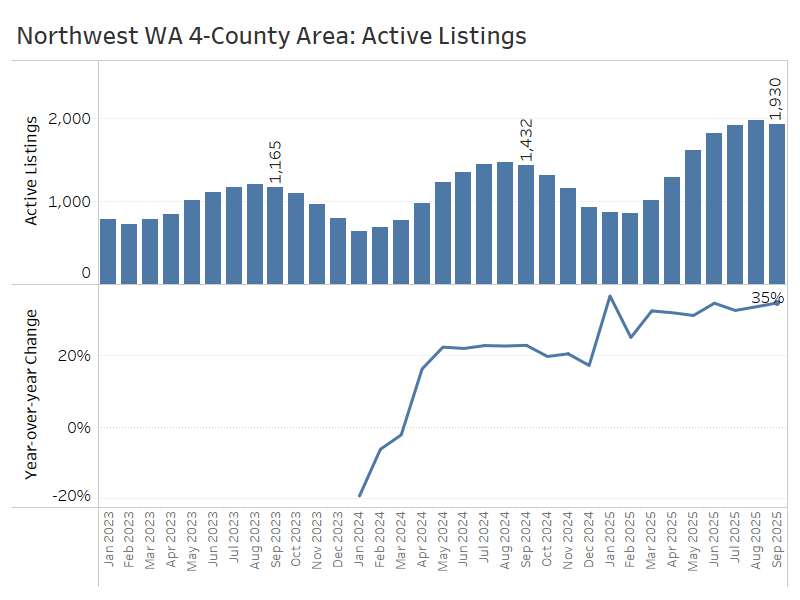
North of the greater Seattle area, the market conditions in the four northernmost counties of the Puget Sound region are experiencing a major shift in buyers’ favor.
At the end of September, there were 1,900 active listings, up 35% from a year ago. There’s no evidence of a slowdown in inventory growth here, like that of the Seattle area this quarter.
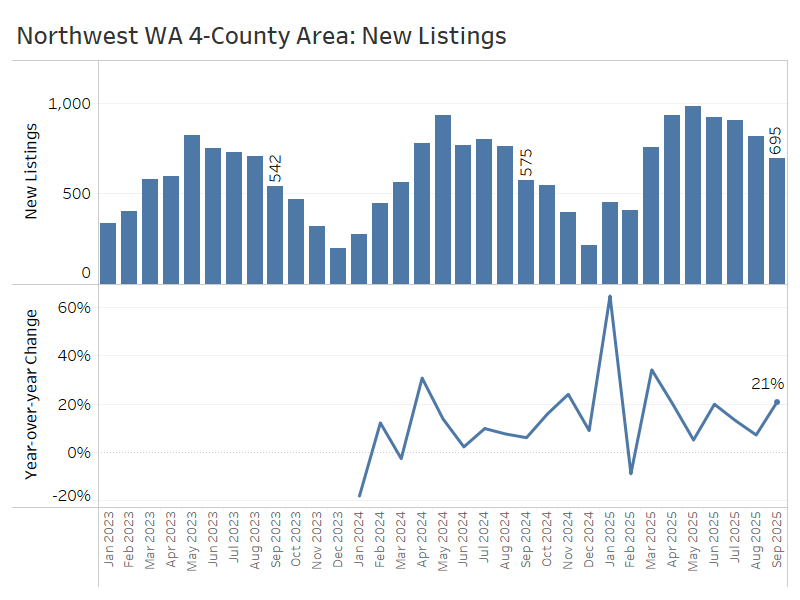
The flow of new listings has experienced healthy growth throughout most of 2025, resulting in a 21% increase compared to September of last year.
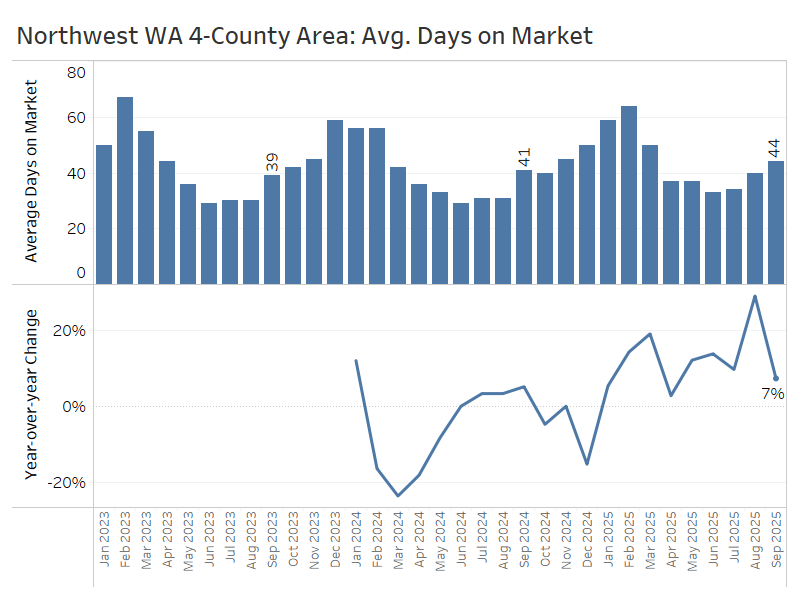
Time on market has climbed modestly but steadily all year, now up to 44 days on average in September, up from 41 days last year.
Closed sales were up 3% year over year in September, after a 3% dip in August and 10% growth in July.

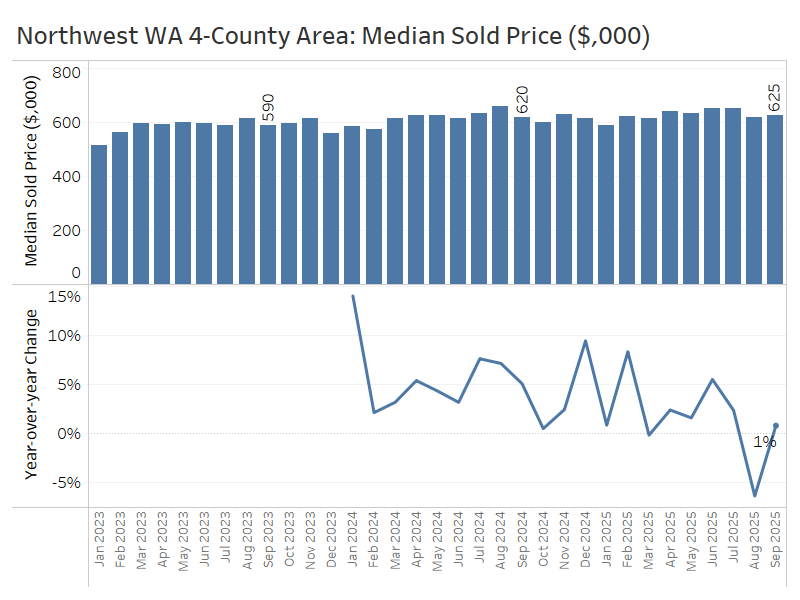
Compared to the same time last year, median home prices rose 2% in July, dipped 6% in August, and then increased 1% in September to $625,000.
Looking ahead, prices will likely cool as buyers take advantage of increased inventory and gain more negotiating power.
Spokane County, Washington
Spokane County, which anchors Eastern Washington, is experiencing many of the same market trends as Western Washington: higher inventory, softer buyer demand, and flat home prices.
At the end of September, there were just over 2,000 active listings, up 32% from a year ago and significantly higher than two years ago, when there were fewer than 1,300 listings. The pace of inventory growth has only slightly slowed from the 33% year-over-year increases we saw in July and August.

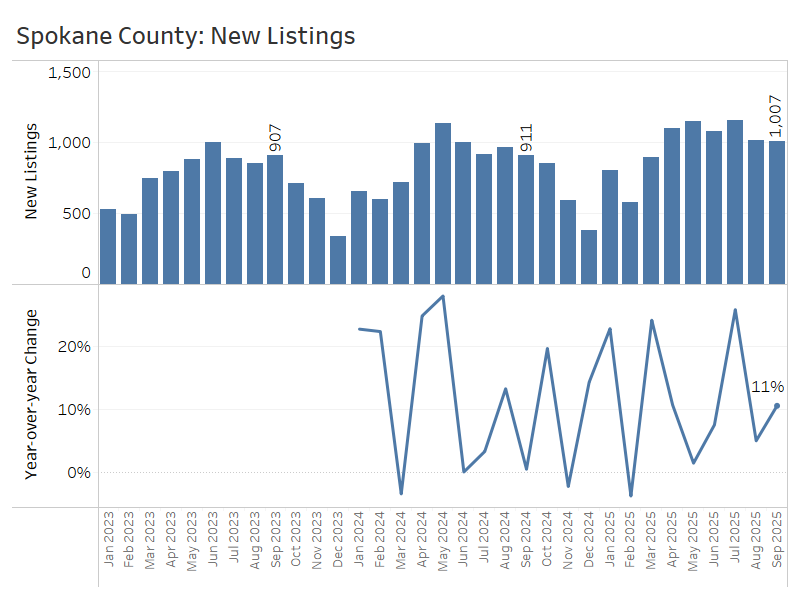
New listings climbed 11% from last September, after increasing 26% in July and 5% in August.
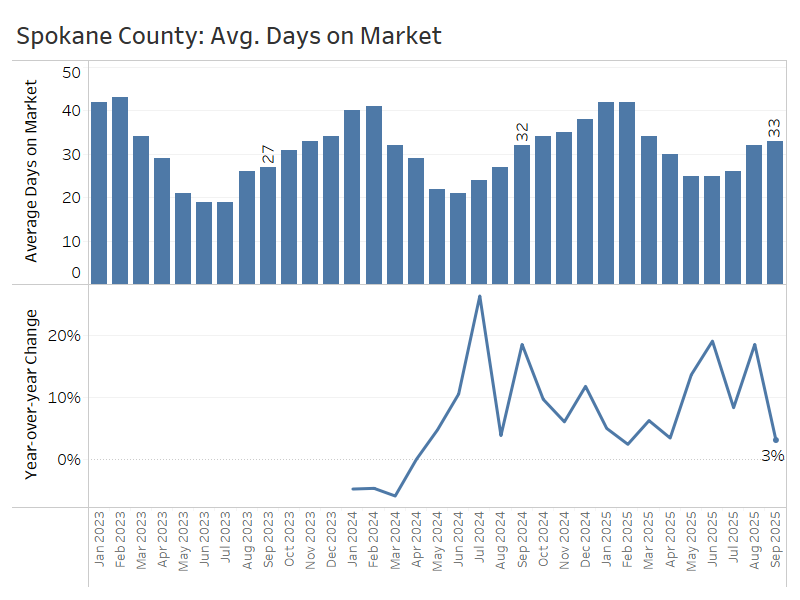
Unlike some of the other markets in this report, Spokane has seen only modest increases in the number of days it takes to sell a home, averaging 33 days this September, up from 32 during the same time last year.
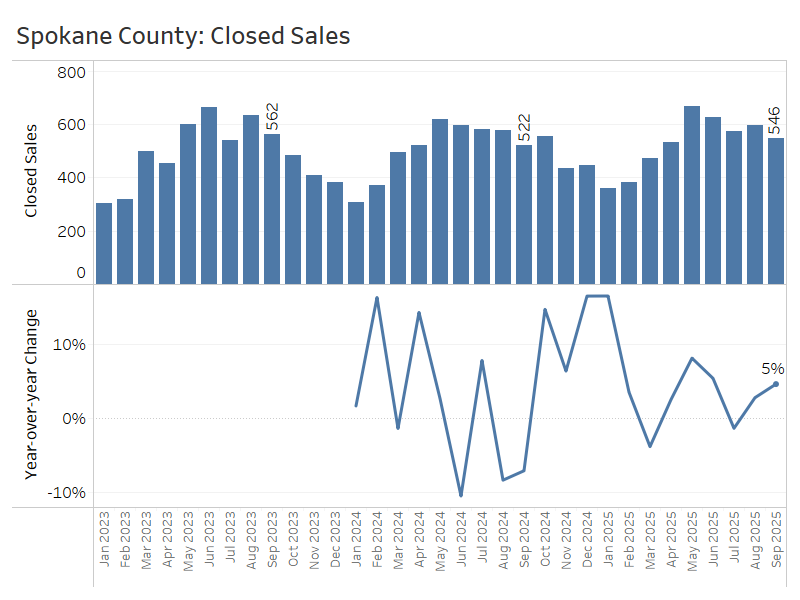
Closed sales in September were up 5% year over year, following a 3% increase in August and relatively flat sales in July.
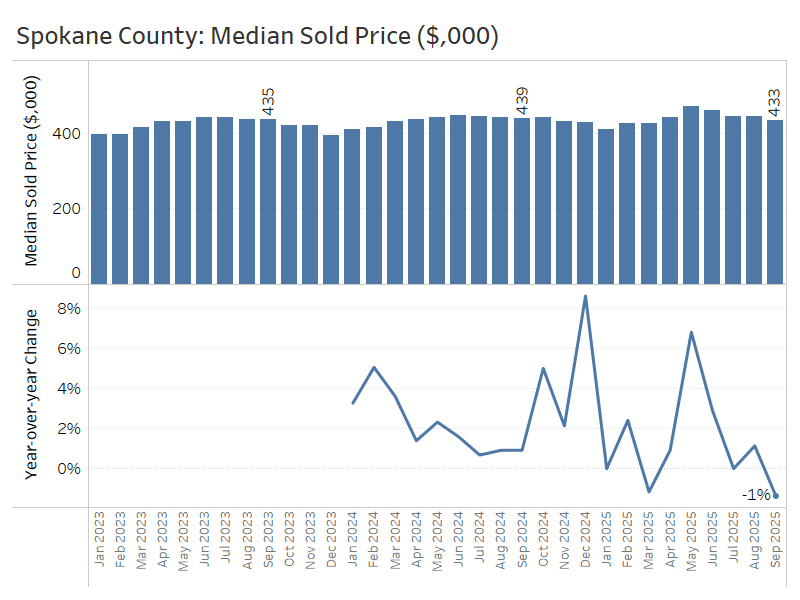
Compared to last year, median sale prices in September dipped by about 1%, from $439,000 to $433,000. Prices were relatively flat year over year in July and August.
Altogether, the more balanced market conditions in Spokane this summer began to yield more sales activity alongside flat to slightly lower prices— a healthy combination for the market right now.
Salt Lake County, Utah
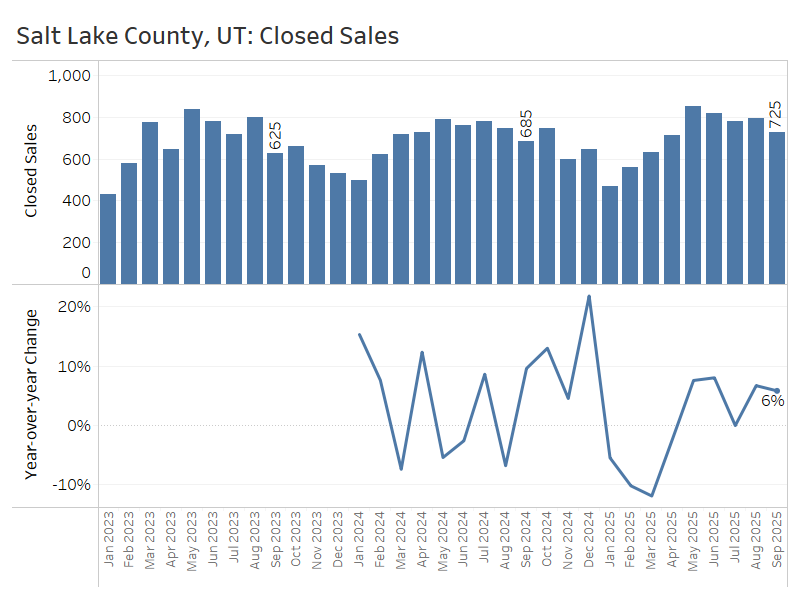
Earlier this year, Salt Lake County experienced an even sharper swing in buyers’ favor than the other markets in this report: higher inventory growth leading to modest price declines. Increasing sales growth in the third quarter shows that buyers have begun to take advantage of these conditions.
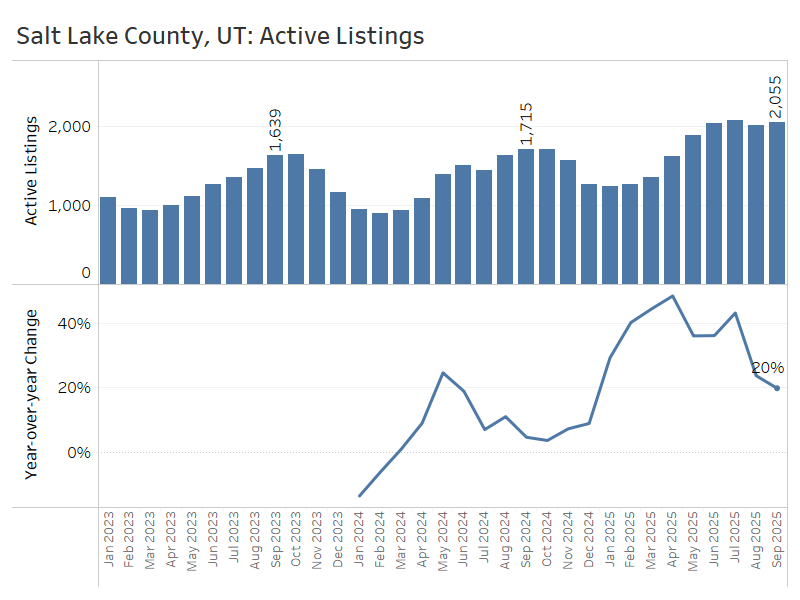
Active listings at the end of September stood at over 2,000 homes, up 20% from a year ago—a major slowdown from 43% inventory growth in July.
Salt Lake County saw substantial year-over-year growth in new listings earlier this spring, exceeding 20% in March and April, but only 3% growth in September. Selling enthusiasm seems to have faded this summer after the buildup of inventory in late spring.

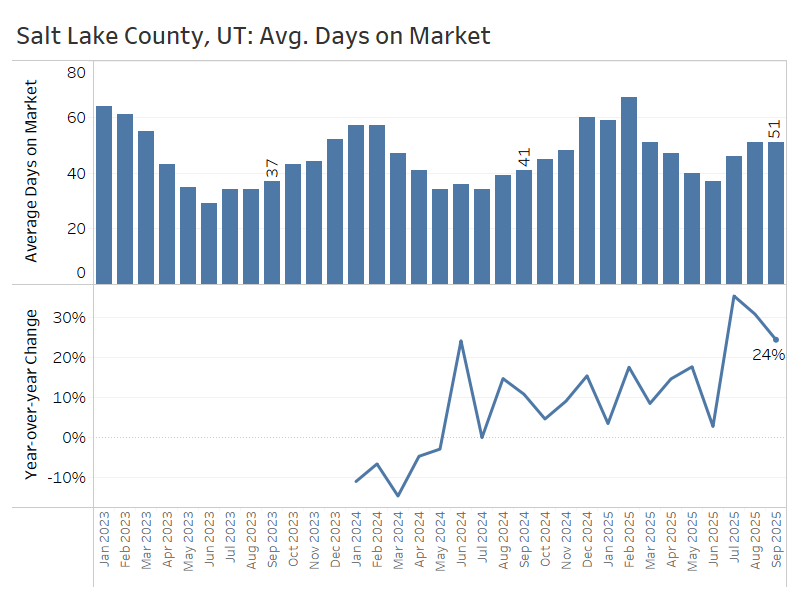
The average number of days it took to sell a home in Salt Lake County was up substantially throughout the third quarter, ending at 51 days in September compared to 41 days the previous year.
Closed sales climbed 6% from a year ago in September, after a 7% increase in August. This is a promising early sign that buyers are responding to improved inventory and mortgage rate conditions.
In September, the median sale price rose 3% year over year—from $620,000 to $637,000. This uptick, along with August’s gain, broke a streak of modest price declines seen earlier in the summer.
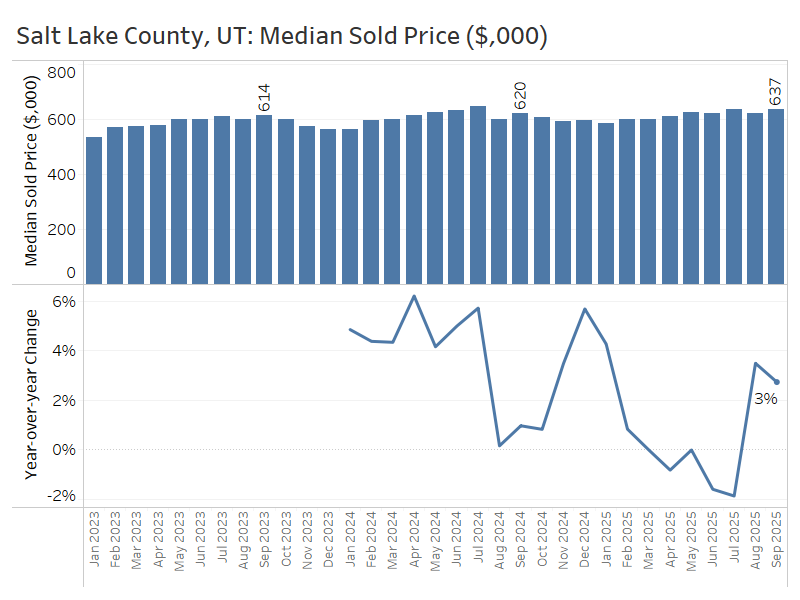
All in all, Salt Lake County has begun to show a bit more balance after swinging in buyers’ favor earlier this year: inventory gains slowed down, and rebounding demand showed up in both rising sale counts and prices.
Conclusion:
All of the markets covered in this report have shifted into balanced or buyer-friendly territory, so it’s a good time to plan accordingly.
A consistent theme across the regions is the rise in inventory, paired with flat home sales and relatively flat prices compared to a year ago. This environment offers prospective buyers several advantages: more homes to choose from, greater leverage to negotiate, and less pressure to rush into a decision or compete in bidding wars.
For sellers, it’s important to be aware that the market has changed. Unlike the last several years, buyers now have more options, and home prices have leveled off. Success in today’s market depends on setting a realistic list price and presenting the home in its best possible light. With the right strategy, many homes are still selling quickly—and even above asking price—in every market highlighted in this report.
Sources: TrendGraphix analysis of NWMLS, RMLS, Spokane MLS, MetroList MLS, and Wasatch Front MLS data.
As Principal Economist for Windermere Real Estate, Jeff Tucker is responsible for analyzing and interpreting economic data and its impact on the real estate market on both a local and national level. Jeff has over 10 years of experience as an economist at companies such as Zillow, Amazon, and AirDNA.
")


