
 Facebook
 X
X
 Pinterest
 Copy Link

This is the latest in a series of videos with Windermere Principal Economist Jeff Tucker, where he delivers the key economic numbers to follow to keep you well-informed about what’s going on in the real estate market.
This month I’ll take a closer look at inventory, which is our best barometer of whether the market is trending in sellers’ or buyers’ favor. Nationwide, inventory is still working its way back up toward pre-pandemic levels, but at a somewhat moderating pace.
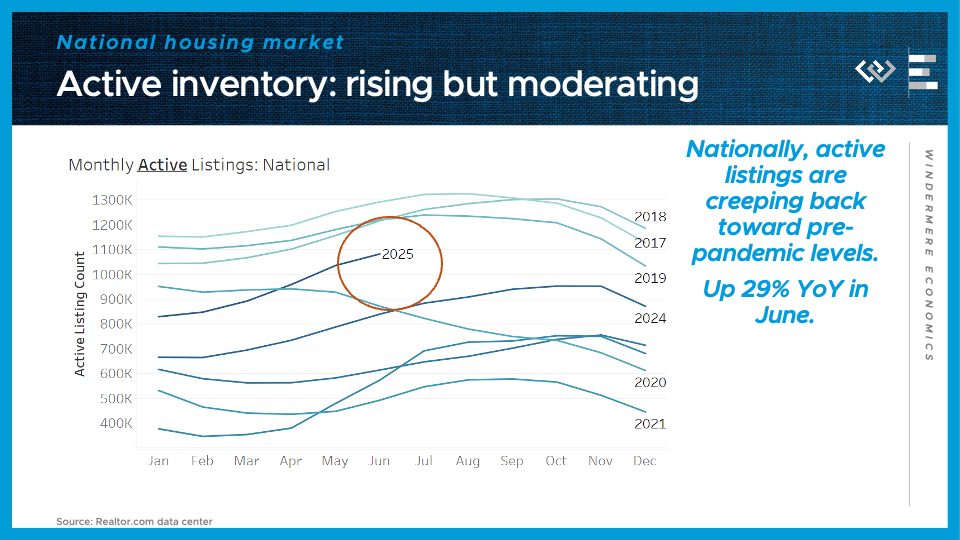
At the end of June, there were about 1 million, 83 thousand active listings on the market, or 29% more than last year. That IS substantial growth, but it’s a step down from the 32% year-over-year gain we saw in May – which marks the first deceleration in this metric since December 2024. This could be a blip, or it could be an inflection point where we see the inventory growth start to slow back down.
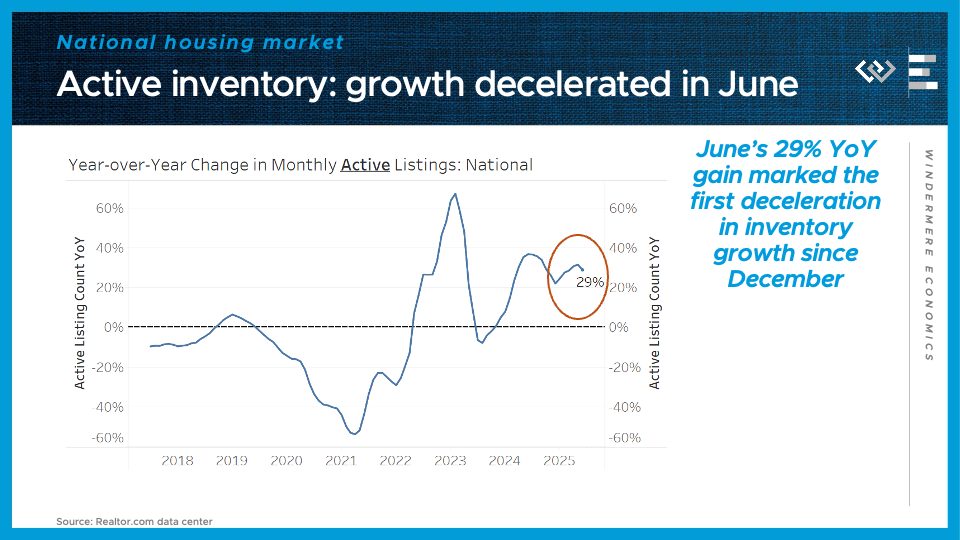
That inventory growth has been swinging the pendulum of negotiating power in buyers’ favor, putting downward pressure on sale prices. Now if inventory growth stalls out, that could help to prevent prices from dropping much below year-ago levels.
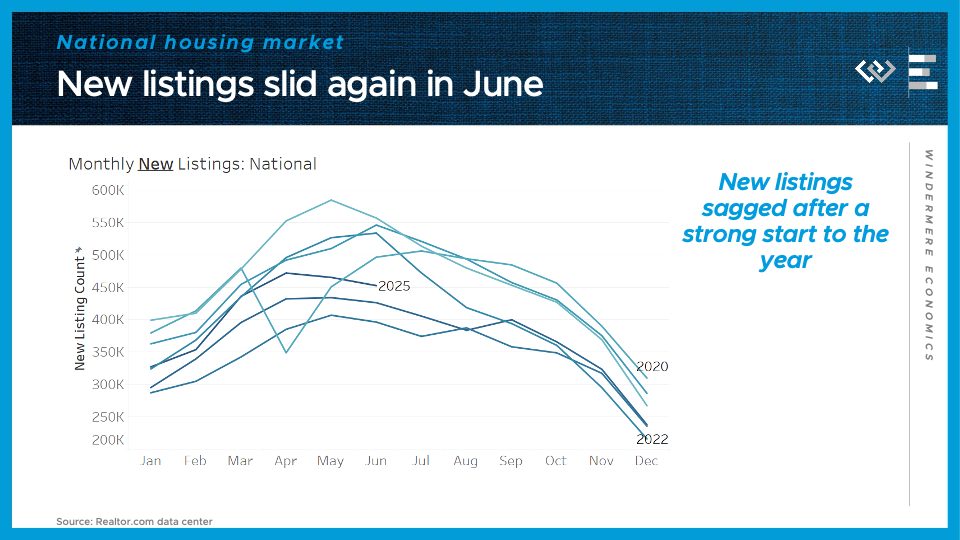
The reason WHY inventory growth has begun to slow seems to lie with sellers: they came roaring in to 2025 with a healthy rebound of new listings, but they’ve dropped off over the course of Q2.
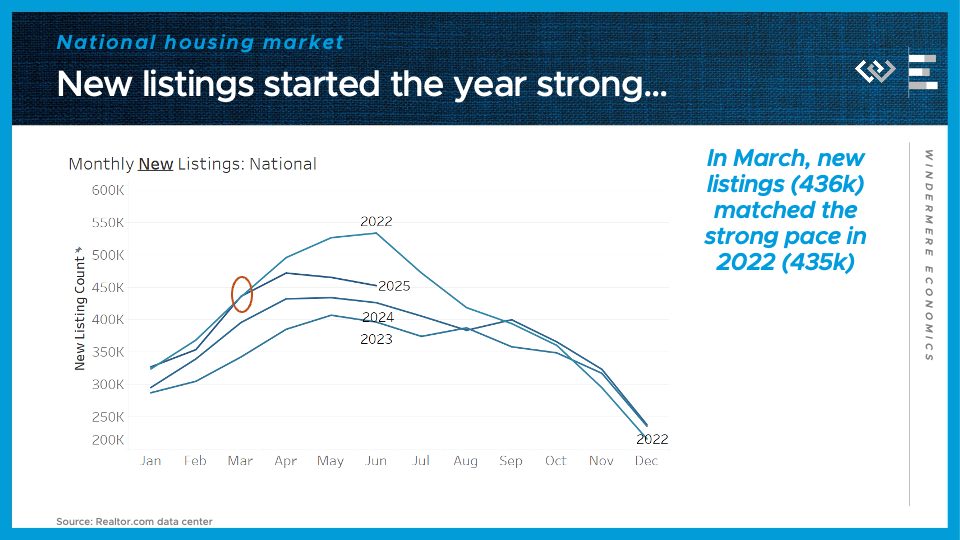
If we just keep the last few years on this chart of new listings, we can see the year started as strong as 2022… but now owners have pulled back from listing as much. It’s not a total sellers’ strike, but in June there were 15% fewer new listings than in June 2022, or only about 6% more than this time last year.
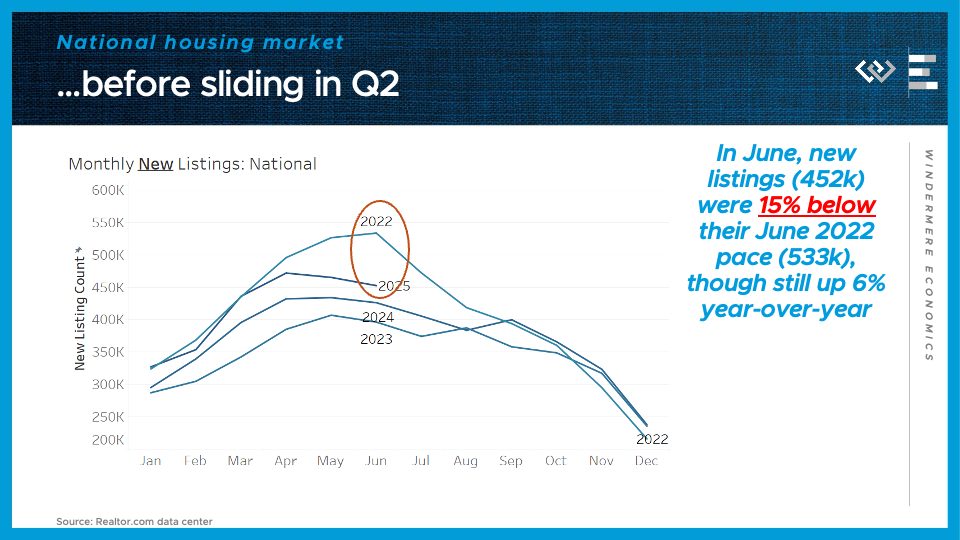
If this trend continues – sellers backing away from the market – it could insulate prices from declining, but at the cost of fewer transactions in the second half of the year.
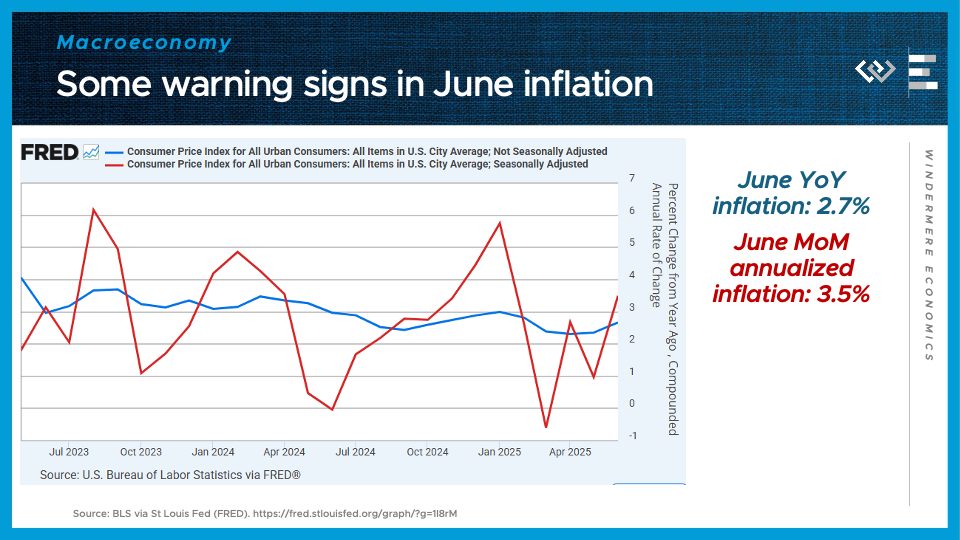
Turning to the macroeconomy, the CPI report for inflation in June started to raise some yellow flags. The annualized monthly growth rate of prices jumped to 3.5%, and the year-over-year change in CPI from last June was only 2.7%.
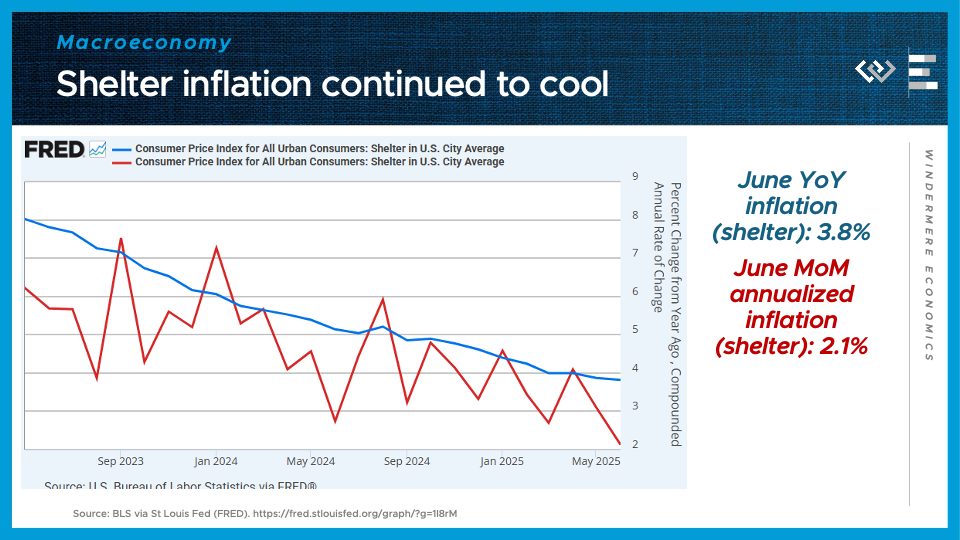
Now, shelter inflation HAS been a major contributor to elevated inflation for the last few years, but it has been decelerating, and that continued in June: in fact, shelter inflation ticked down to its lowest monthly pace in years, at just 2.1% annualized.
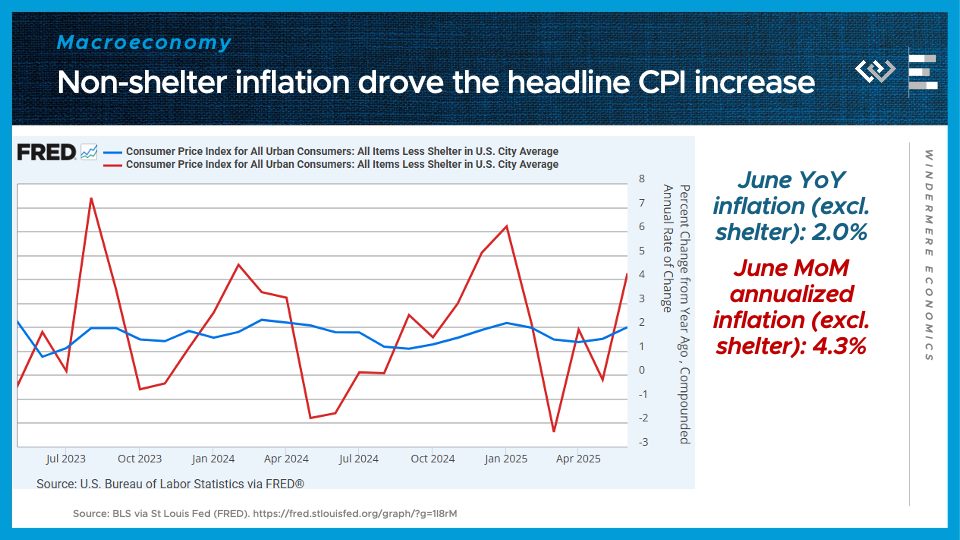
The rest of the CPI basket, excluding shelter, is what drove inflation higher: back up to just over 2% for the first time in months. The rise in non-shelter inflation, especially inflation for other services, could lead the Fed to keep their rate cut plans on hold.
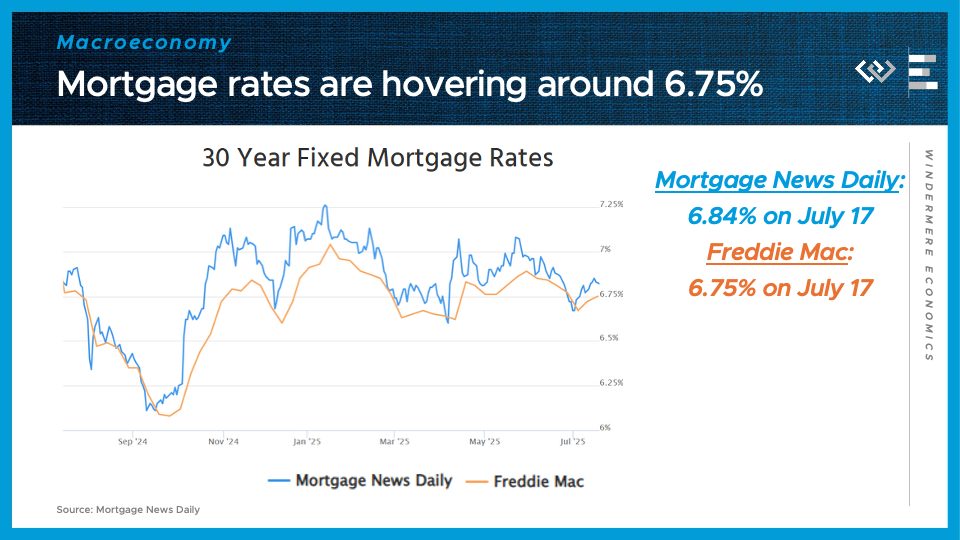
Speaking of interest rates, it still feels like Groundhog Day, with 30-year mortgage rates bouncing around 6 and three-quarters percent. There was a modest decline late in June, but that was erased by mid-July. Between strong economic growth, rebounding inflation, and higher debt issuance by the Treasury, I just don’t see much reason to expect mortgage rates to fall dramatically, until some of those factors change. This is still a higher-for-longer world when it comes to long-term interest rates.
")


