
 Facebook
 X
X
 Pinterest
 Copy Link
Local Look: Western Washington Housing Update 5/7/25

Last month I said our local real estate market was on a roller coaster, and that proved true again, this month, as sales trends turned sharply downward after a strong March.
Pending sales fell below last month’s, and last year’s levels, as many buyers pressed “Pause” on their home purchase decisions, in the face of rising economic uncertainty and stock market volatility.
Here are the four key metrics I watch to track supply and demand in the market: closed and pending sales, which tell us a lot about demand; and listings – new and active – which tell us a lot about supply.
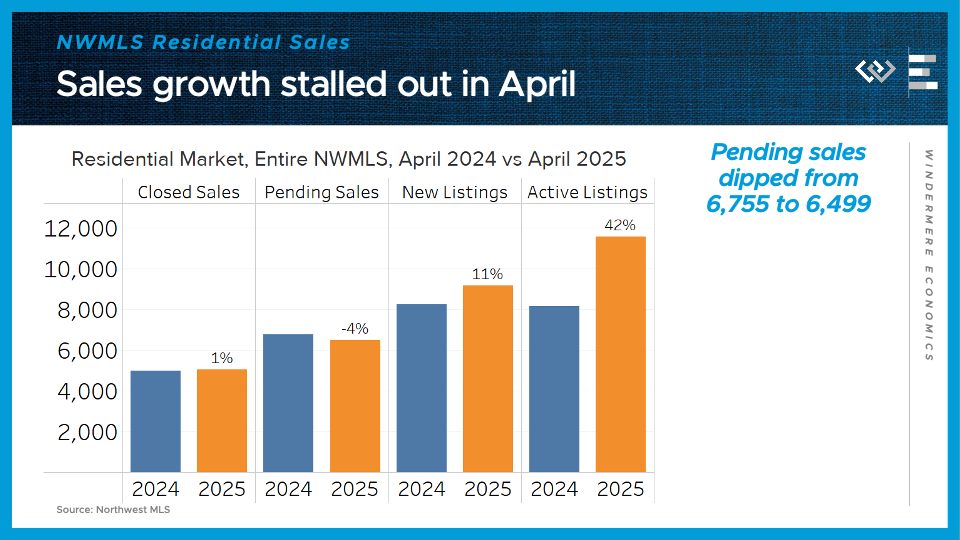
Across the Northwest MLS, closed sales of single-family homes grew just 1% in April from their year-ago levels, after growing 5% in March. Pending sales, which are more of a real-time demand indicator, dipped 4% from last year, a disappointing reversal after climbing 7% in March.
On the supply side, about 11% more new listings hit the market this April, and the tally of active listings ended the month 42% higher than April 2024’s inventory. Buyers are still seeing a lot more options than they had last spring.
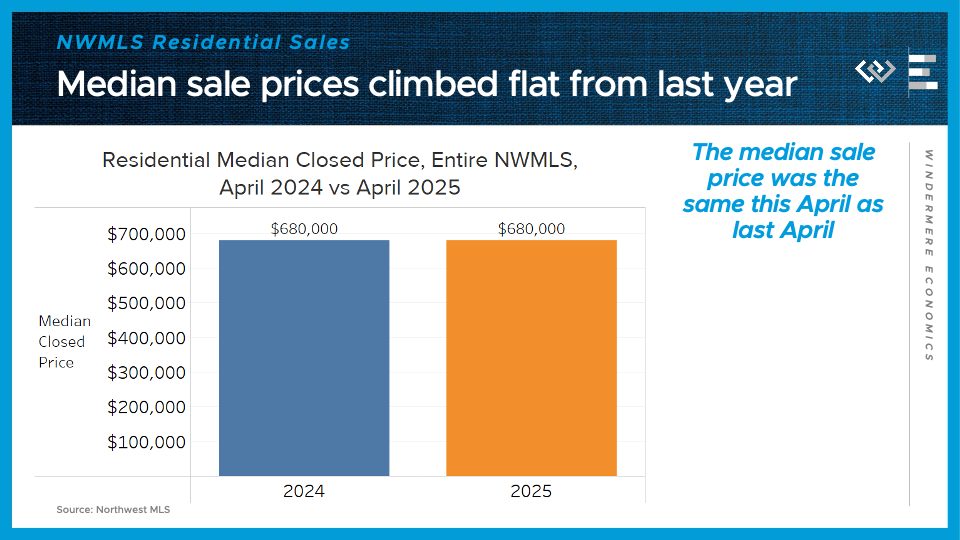
Finally: the median price for those closed single-family home sales was exactly the same this April as last year: $680,000. The extra inventory and cautious buyers seem to have brought price growth to a halt, for now.
Putting it all together: the market is looking pretty balanced across Washington, now that buyers took a step back in April, as they’re taking time to digest the impact of tariffs and stock market volatility.
Now I’ll dig into the four counties encompassing the greater Seattle area, where buyers pulled back even more.
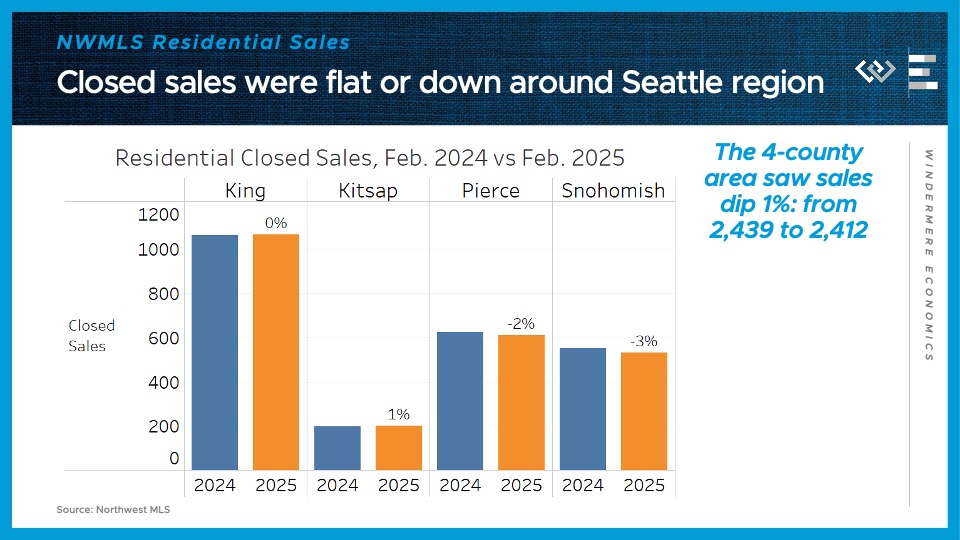
Residential closed sales dipped 1% year over year here in the 4-county region, largely due to a 2% drop in King County. Closed sales dipped 1% in Kitsap County; climbed 2% in Pierce County, including Tacoma; and were flat in Snohomish County, including Everett.
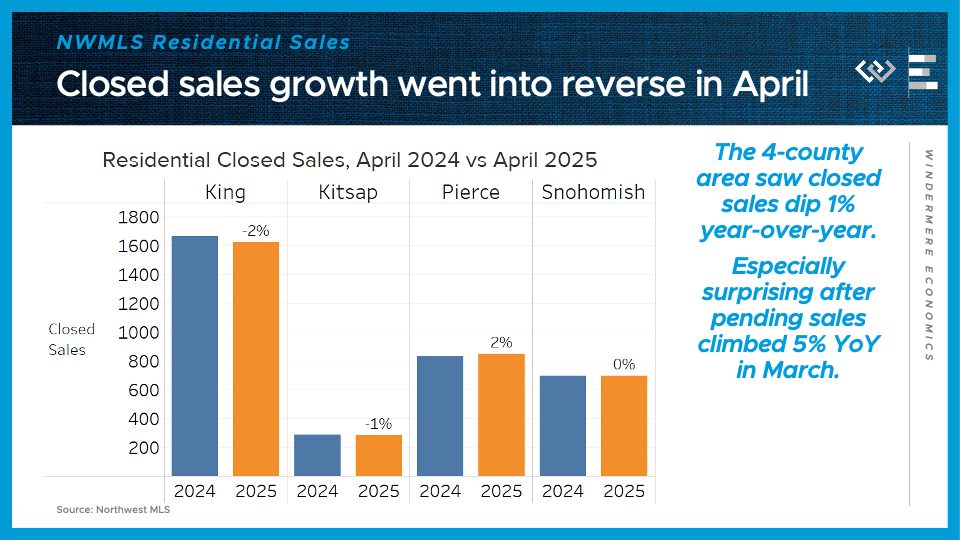
This is especially surprising because there was healthy pending sales growth around the region in March, suggesting either more cancellations, or that this dropoff happened mostly in the end of the month of April.
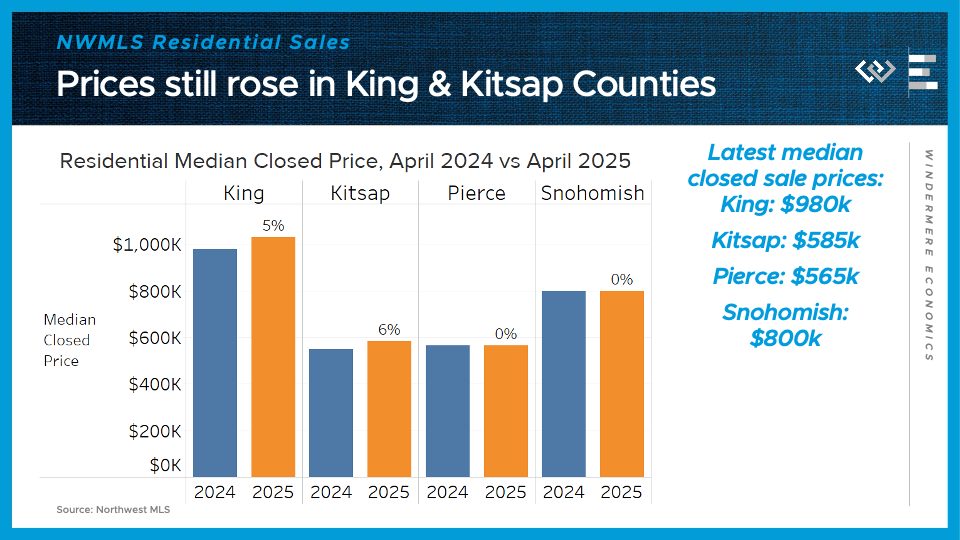
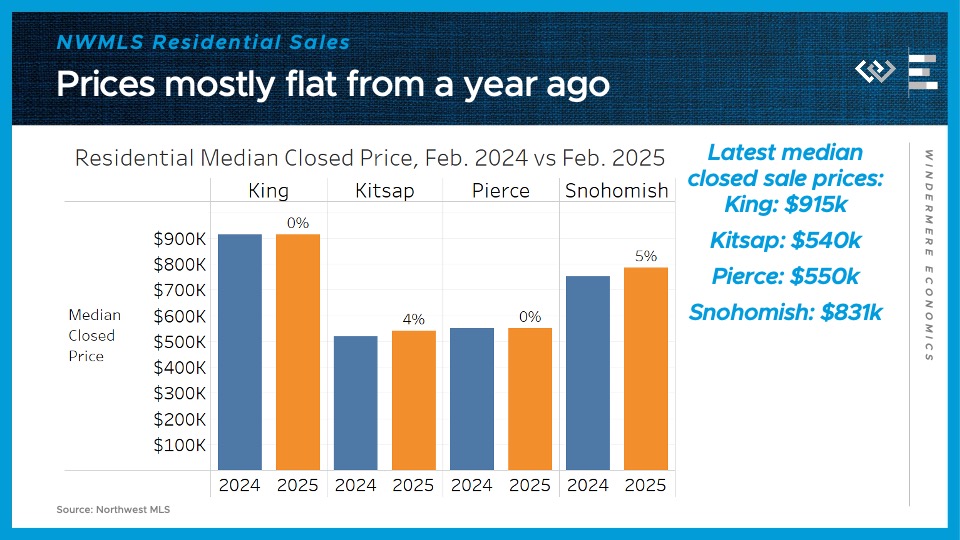
The median sale price kept marching upward in King and Kitsap Counties, by 5-6%, while prices were flat year-over-year in Pierce and Snohomish Counties.
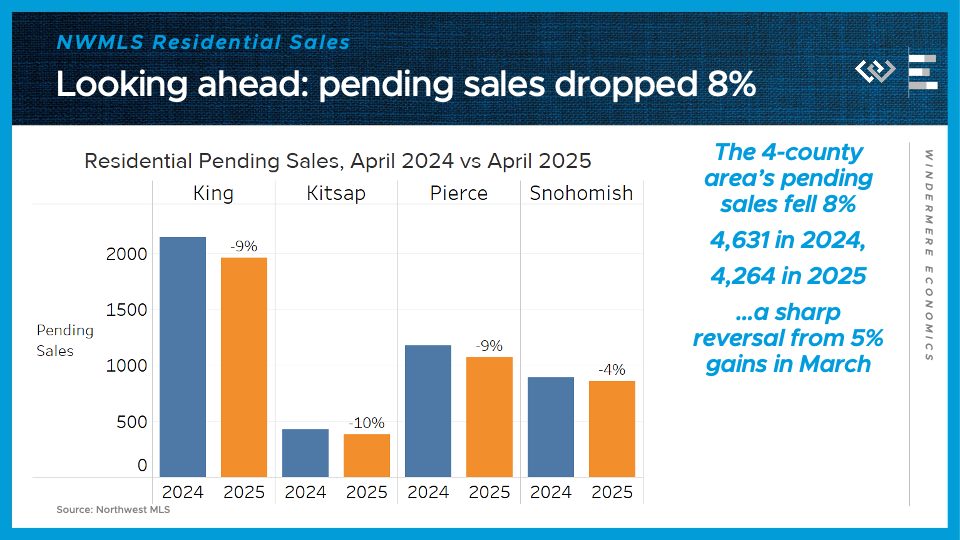
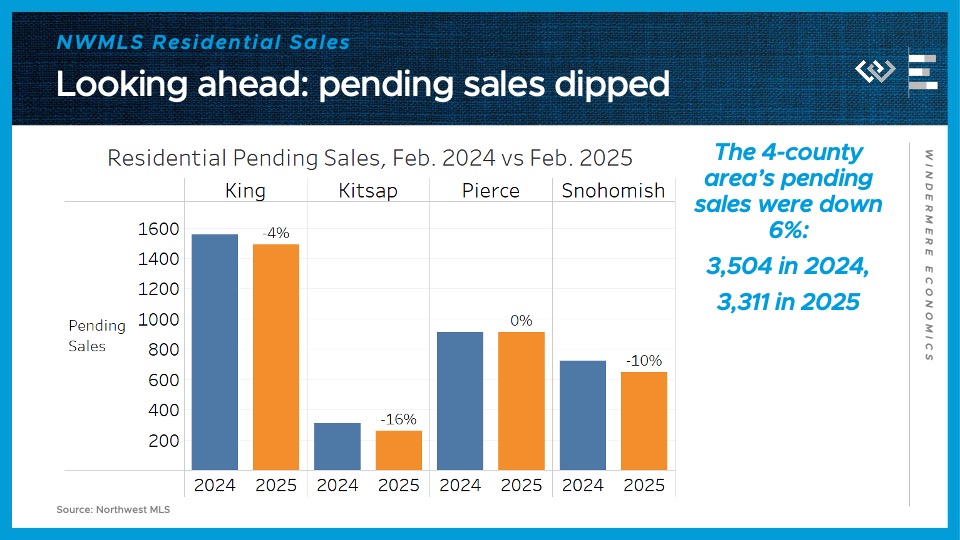
Looking ahead, pending sales dropped 8% in the 4-county area: down 9% in King, down 10% in Kitsap, down 9% in Pierce, and down 4% in Snohomish County. This is a sharp reversal from March’s gains, and suggests we will see closed sales slide in May.
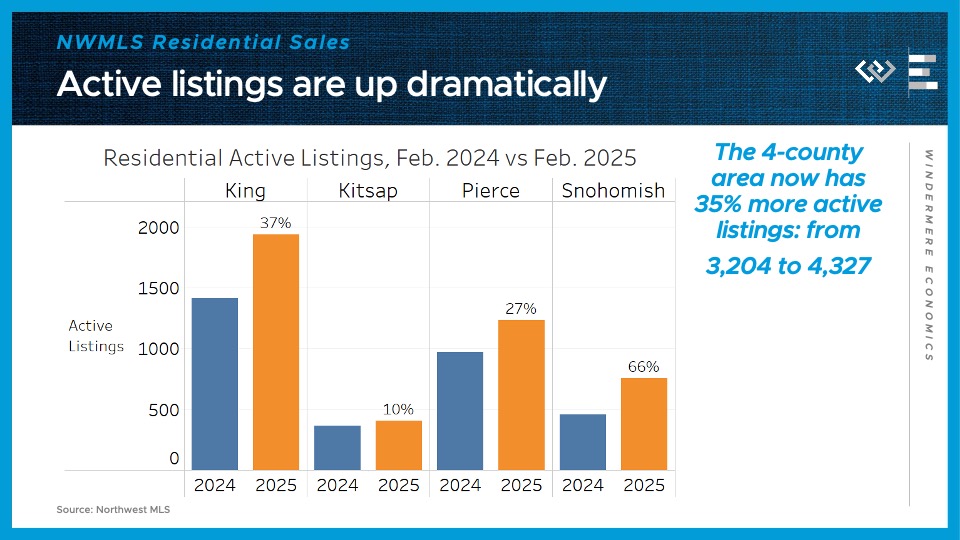
On the supply side, the 4-county greater Seattle area had just over 6,000 active listings at the end of April, up about half from the same time last year. Just like in March, the inventory growth is especially dramatic in King and Snohomish Counties, where listings are up 50% and 79% respectively.
All in all, these indicators from April show that the forward momentum in sales we saw in March has fizzled out for now, at least, because buyers have been hit by economic uncertainty and stock market volatility that’s caused some of them to pause their home buying search. Looking ahead, we saw stock markets actually end April about where they started, after a wild ride down and back up, so that may be cause for optimism that April’s negative shocks start to fade in the rear-view mirror. What comes next depends on whether the economic outlook and stock market movements stabilize and firm up.
Local Look: Western Washington Housing Update 4/7/25
Hi. I’m Jeff Tucker, principal economist at Windermere Real Estate, and this is a Local Look at the March 2025 data from the Northwest MLS.
Our local real estate roller coaster turned back up in March, after a couple soft months to start the year. Pending sales actually climbed YoY in March, around Washington and especially the Puget Sound region, as buyers seemed to respond to the decline in mortgage rates over the month. This is still not a red-hot spring selling season but it’s not exactly a buyer’s market either.
Here are the four key metrics I watch to track supply and demand in the market: closed and pending sales, which tell us a lot about demand; and listings – new and active – which tell us a lot about supply.
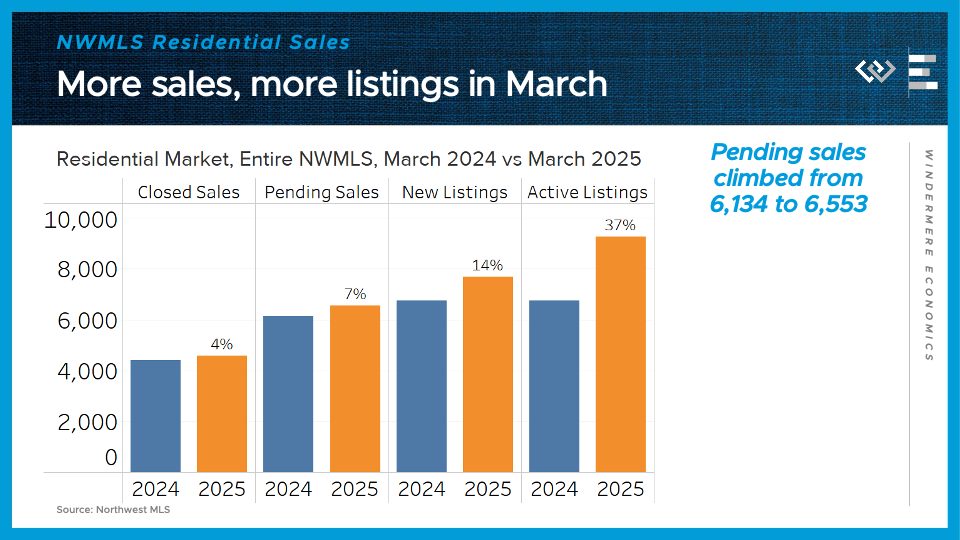
Across the Northwest MLS, closed sales of single-family homes grew 4% in March from their year-ago levels, after flatlining in February. Pending sales, which are more of a real-time demand indicator, climbed 7% from last year. That’s a strong reversal from February’s dip in pending sales.
On the supply side, about 14% more new listings hit the market this March, and the tally of active listings ended the month 37% higher than March 2024’s inventory. Buyers are seeing a lot more options than they had last spring.

The final key metric to check in on: the median price for those closed single-family home sales climbed just 2% year-over year in March, from about $655,000 to $666,000. That’s another month of decelerating price growth after Q4 was particularly hot.
Putting it all together, we’ve got more supply meeting more demand this spring – more buyers are finding a match; sales are picking up; but all that inventory has kept a lid on price growth.
Now I’ll dig into the four counties encompassing the greater Seattle area, which mostly had similar trends to Washington as a whole.
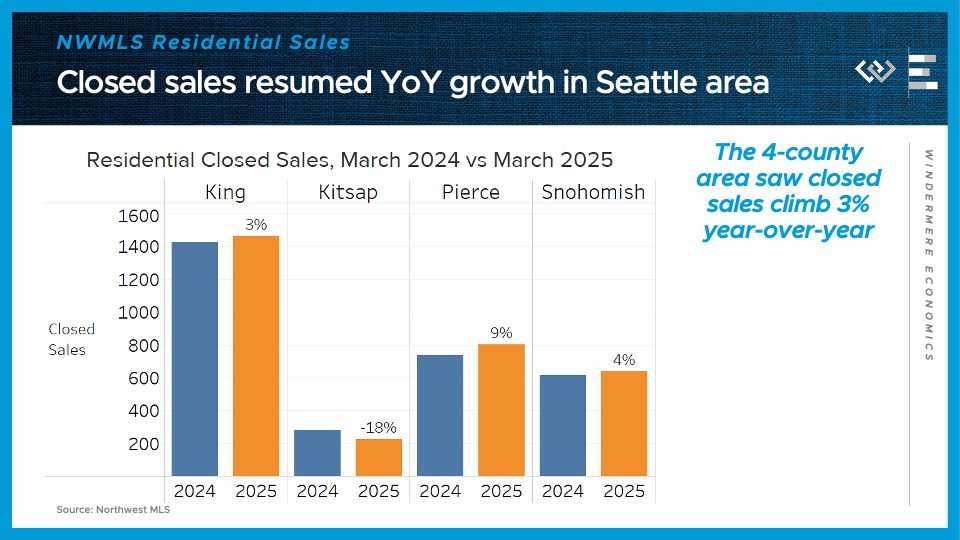
Residential closed sales climbed 3% year over year here in King County, and for the whole 4-county region; they dropped 18% in Kitsap County; climbed 9% in Pierce County, including Tacoma; and rose 4% in Snohomish County, including Everett. Not huge growth but it is a turnaround from February, when sales fell slightly from year-ago levels.
The median sale price climbed between 3 and 5%, locally: 3% change from last year in King County and Pierce County, up 5% in Kitsap County, and up 4% in Snohomish County.

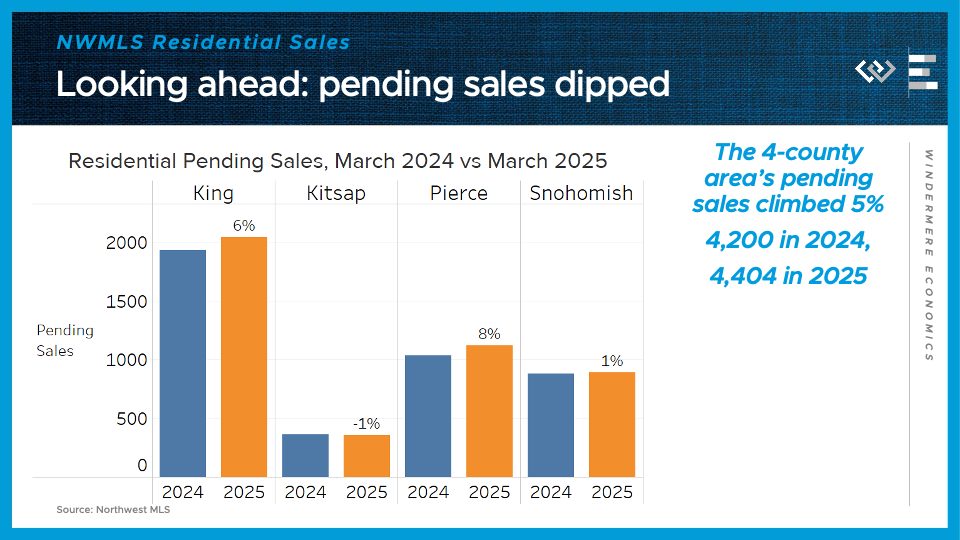
Looking ahead, pending sales climbed more than closed sales: up 6% in King, down 1% in Kitsap, up 8% in Pierce, and up 1% in Snohomish County. Altogether that makes 5% growth across the 4 counties, which should support further growth in closings in April. That’s the biggest piece of evidence I see that buyers are coming back to the market this spring.
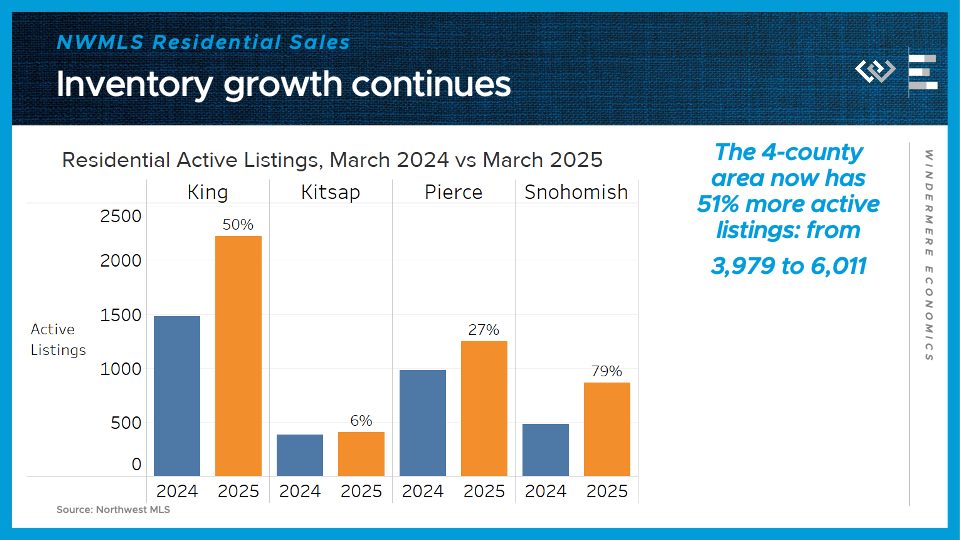
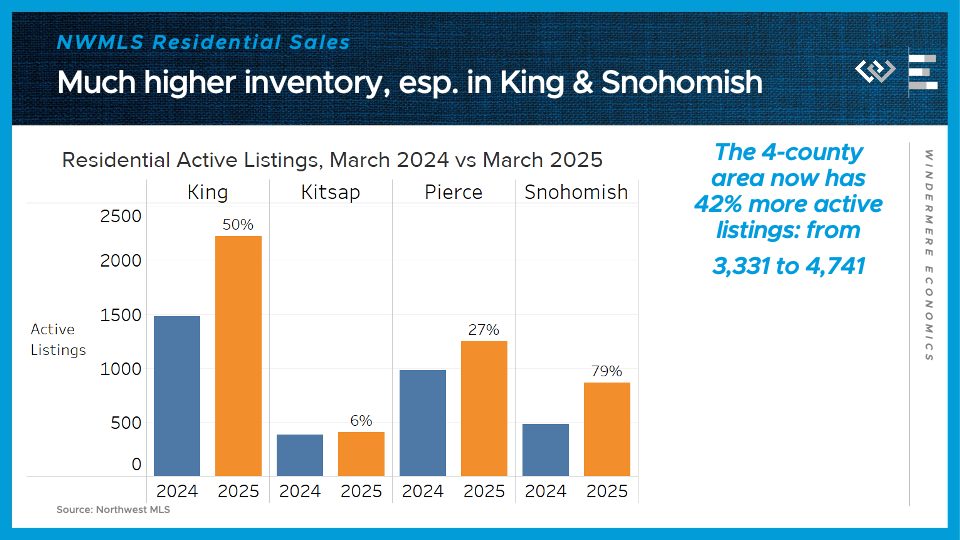
On the supply side, the 4-county greater Seattle area had about 42% more active listings at the end of March than the same time last year. The inventory growth is especially dramatic in King and Snohomish Counties, where listings are up 50% and 79% respectively.
So while there’s more purchase activity, these inventory gains are helping to keep it a pretty balanced market. Barring any big negative shocks, I’m expecting stronger year-over-year sales growth in April and May, because last year mortgage rates spiked upward starting in mid-April, which sent buyers back into hibernation. This spring, interest rates are declining modestly, which is the silver lining of a diminished outlook for economic growth.
Local Look: Western Washington Housing Update 3/6/25

Hi. I’m Jeff Tucker, principal economist at Windermere Real Estate, and this is a Local Look at the February 2025 data from the Northwest MLS.
Hi. I’m Jeff Tucker, principal economist at Windermere Real Estate, and this is a Local Look at the February 2025 data from the Northwest MLS.
After an impressive Q4, and a decent start to the year in January, this February saw buyer activity – and listing activity – slow down a bit relative to last year. I think the rise in mortgage rates back to around 7% this winter has finally cooled off some of the buyer enthusiasm we saw in Q4.
Here are the four key metrics I watch to track supply and demand in the market: closed and pending sales, which tell us a lot about demand; and listings – new and active – which tell us a lot about supply.
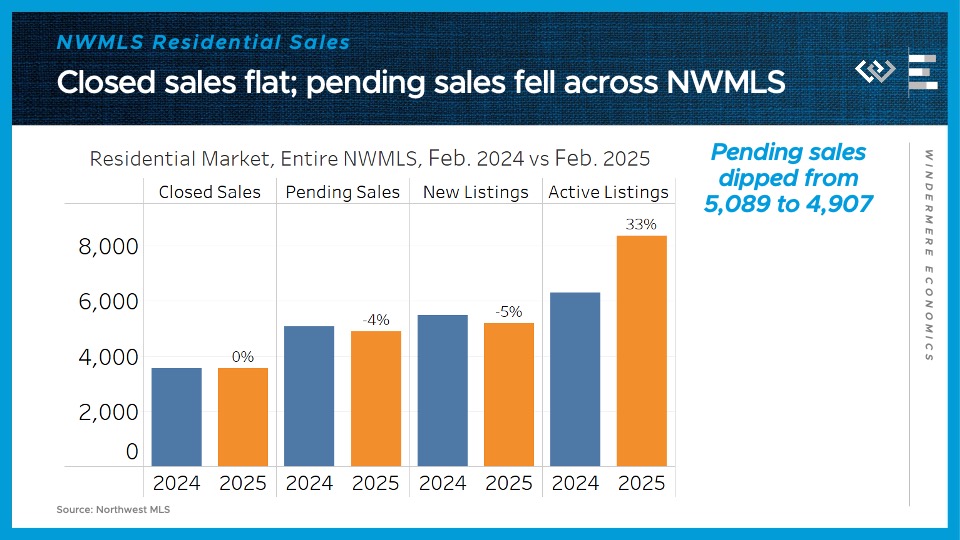
Across the Northwest MLS, closed sales of single-family homes were almost exactly flat year-over-year, at 3,550 vs last year’s 3,553. Pending sales, which will mostly close in March, dropped 4% from the same month last year. One extenuating circumstance was we had 1 less business day this February, since last year was a leap year, but this is still looking like a cooler market in terms of demand than we saw in Q4.
On the supply side, about 5% fewer new listings hit the market this February compared to last year’s, while the pool of active listings in the reservoir ended the month 33% higher than February 2024’s inventory.
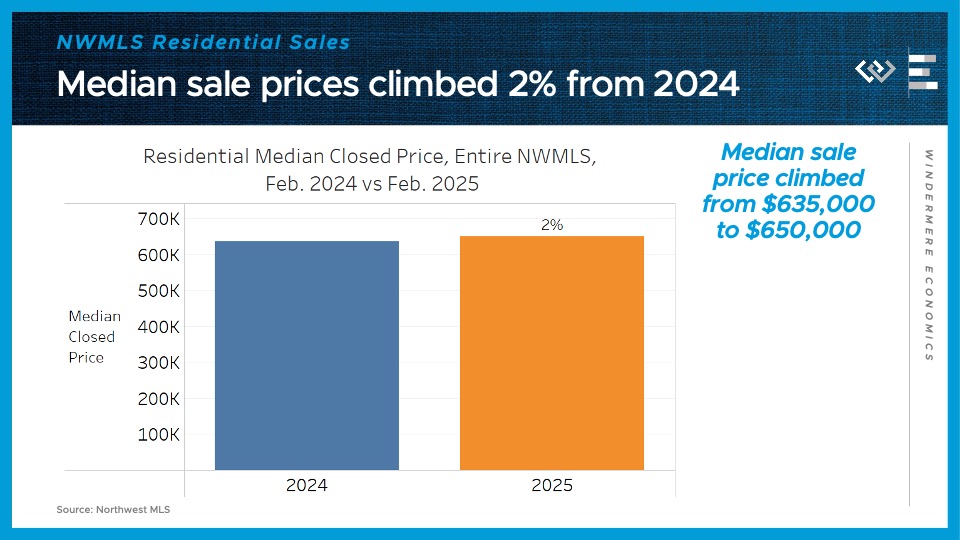
The final key metric to check in on: the median price for those closed single-family home sales climbed just 2% year-over year in February, from about $635,000 to $650,000. That represents a further cooldown from median price growth we’d seen in Q4, and it seems to indicate that the higher levels of inventory are putting some competitive pressure on sellers, preventing prices from rising too much.
Putting it all together, this looks like a market where the normal seasonal upswing in sales and prices has begun, but the year-over-year comparisons are looking a lot cooler than they were throughout Q4 and into January. I think that cooldown was mostly due to interest rates rebounding this winter, which discouraged buyers, so looking ahead, if we see the recent dip in interest rates in late February and early March actually stick, I could see some of that heat coming back into the market right as we hit the spring buying season.
Now I’ll dig into the four counties encompassing the greater Seattle area, where a similar cooldown played out in February.
Residential closed sales were flat year over year here in King County; inched up 1% across the Sound in Kitsap County; dipped 2% in Pierce County, including Tacoma; and fell 3% in Snohomish County, including Everett. So for the 4-county region as a whole, that’s a dip of 1% from the same month last year. Not bad but it is a slowdown after 6% growth in January.
The median sale price was mostly flat, locally: 0% change from last year in King County and Snohomish County, up 4% in Kitsap County, and up 5% in Pierce County.
Looking ahead, pending sales were flat or down locally: down 4% in King, down 16% in Kitsap, flat in Pierce, and down 10% in Snohomish County. Altogether that makes a 6% decline across the 4 counties, suggesting we’ll see closings continue to fall year-over-year in March.
On the supply side, the 4-county greater Seattle area had about 35% more active listings at the end of February than the same time last year. That inventory growth comes in spite of a 7% decline across the region in the flow of new listings this February. Again, that was potentially impacted by the slightly shorter month, but it does suggest that sellers haven’t been flocking to list their homes in greater numbers yet this year. It could also be due to sellers jumping the gun on listing: year to date, new listings are up 8%, thanks to very impressive new listings in January. Now I’ll be curious to see if the recent dip in rates can help re-start the listing pipeline locally.
Local Look: Western Washington Housing Update 1/7/25
Hi. I’m Jeff Tucker, principal economist at Windermere Real Estate, and this is a Local Look at the December 2024 data from the Northwest MLS.
After two very strong months of data covering October and November, we got one last month of strong closed sales data in December, but a slowdown in pending sales growth suggests we shouldn’t expect a boom in closings to start out the New Year.
Here are the four key metrics I watch to track supply and demand in the market: closed and pending sales, which tell us a lot about demand; and listings – new and active – which tell us a lot about supply.
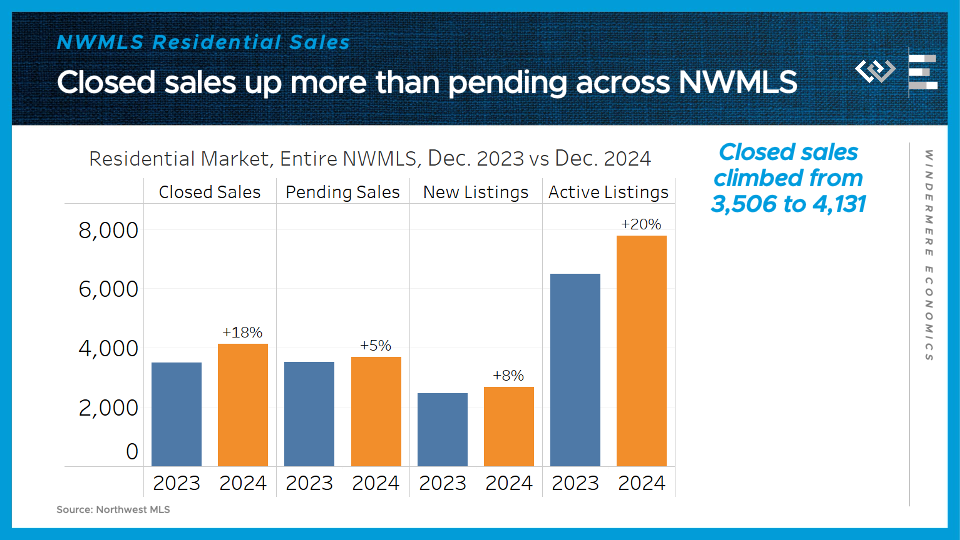
Closed sales of single-family homes climbed 18% year-over-year, from about 3500 to over 4100. Pending sales, which will mostly close in January, only climbed 5% from the same month last year.
On the supply side, about 8% more new listings hit the market this December compared to last one, while the level of inventory in the reservoir was 20% higher at the end of 2024 than at the end of 2023. Of course this is a quiet time of the year in the market, so we should expect all these measures of listings to pick up soon.
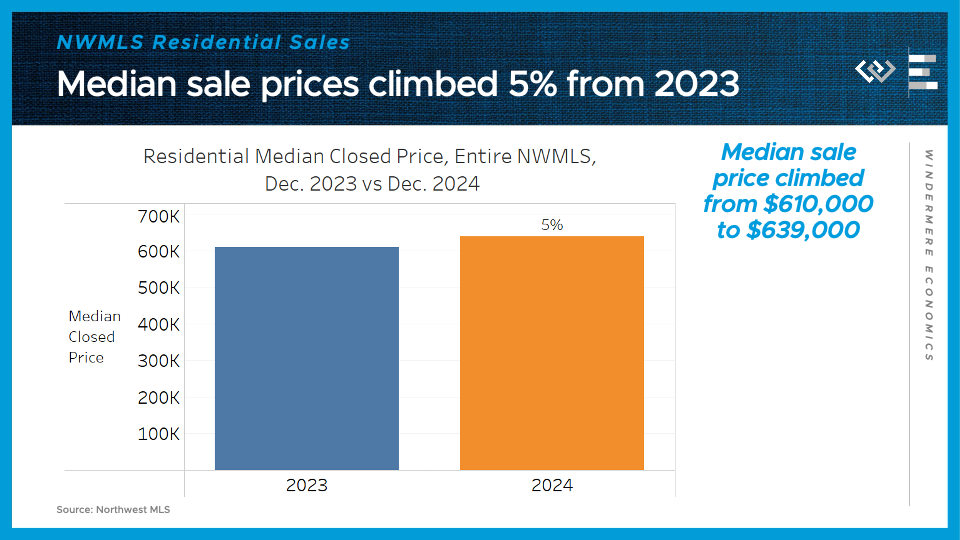
The final key metric to check in on: the median price for those closed single-family home sales climbed about 5% year-over year, from $610,000 to $639,000. That’s a bit of a cooldown from price growth in the previous couple of months, and it’s pretty similar to the pace I’m projecting for 2024.
Putting it all together, this looks like a market that had a surge of demand after the Fed began to cut rates in September, but where that demand bump is cooling off now that mortgage rates have stubbornly rebounded to nearly 7%.
Now I’ll dig into the three counties that comprise the Seattle metropolitan area, where we saw similar trends play out.
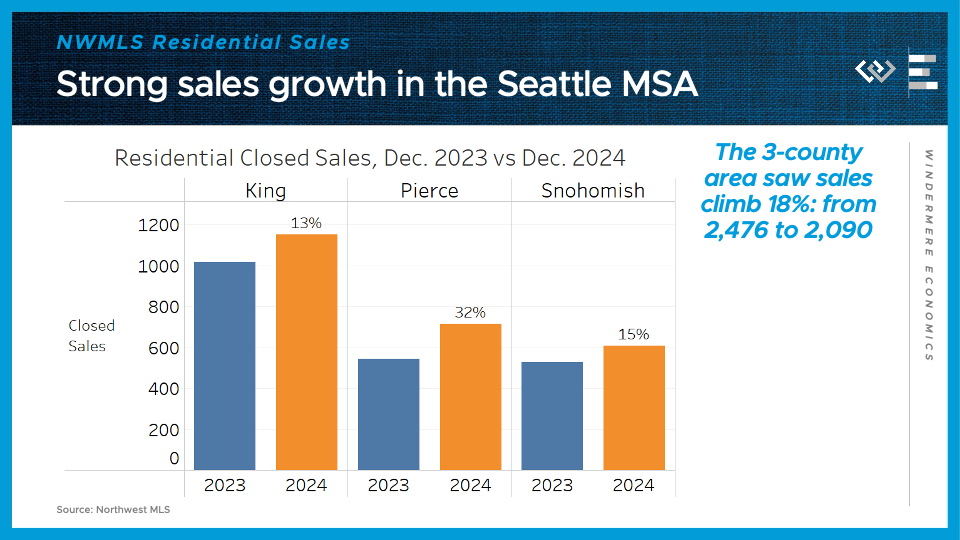
Residential closed sales climbed 13 percent year over year here in King County, which includes Seattle and Bellevue; a whopping 32% down in Pierce County, including Tacoma, and 15% up in Snohomish County, including Everett. So for the 3-county metropolitan area as a whole, that’s a gain of 18% from the same month last year. November, by comparison, saw a 30% increase for the whole MSA, so the sales gains are clearly decelerating.
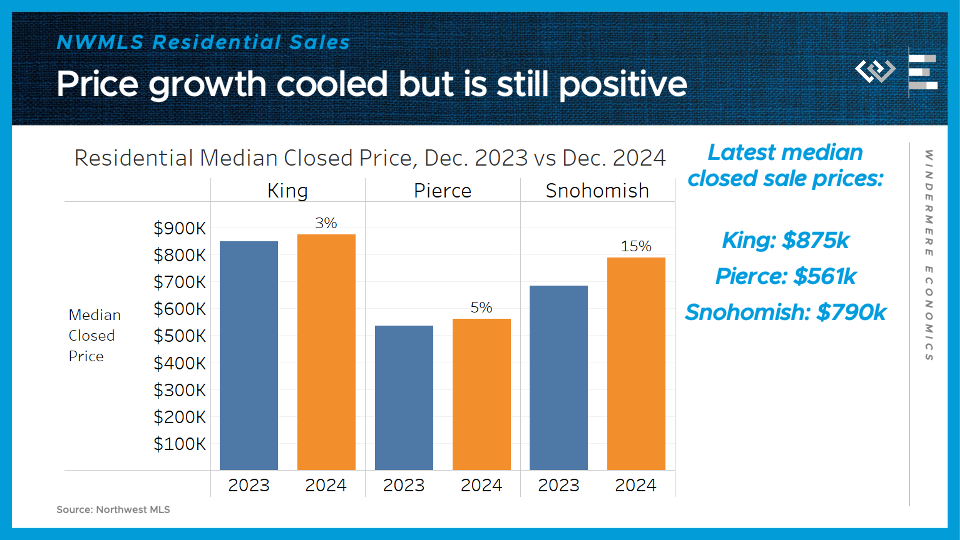
The median sale price climbed modestly: just 3% from last year in King County and 5% in Pierce County, but a whopping 15% in Snohomish. This statistic can get noisy when the sample size is small, like in December, so I think we won’t have a clear view of Snohomish price trends for another couple of months.
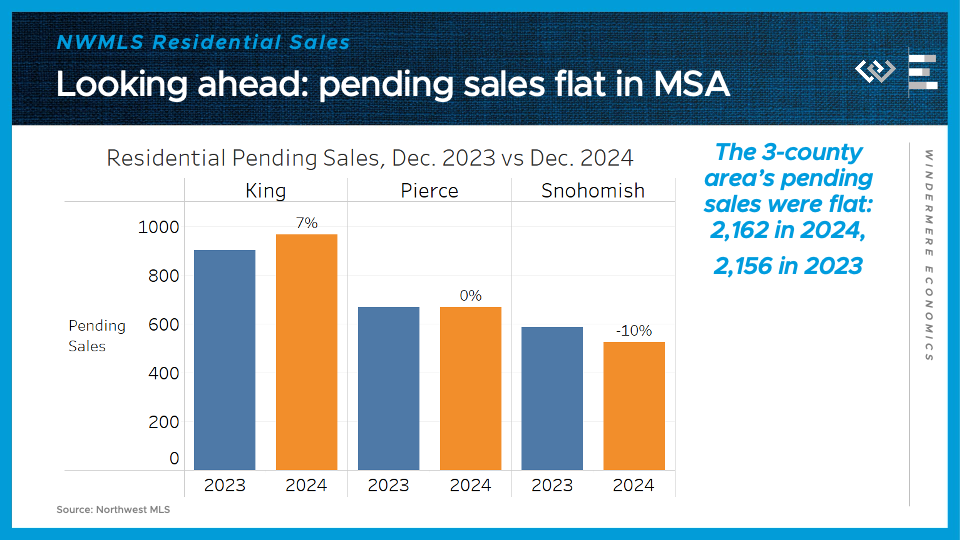
Looking ahead, there was a pretty different picture for pending sales in each of these counties: up 7% in King, flat year-over-year in Pierce, and down 10% in Snohomish. Again, sales in December are so thin that random noise can look like big changes, so I wouldn’t read too much into that data point for Snohomish County, but the broad picture for the 3-county area is that pending sales were essentially flat year-over-year in December.
On the supply side, the 3-county metro area had about 22% more active listings to end the year than there were at the end of 2023. That could give buyers more options as they start their house hunt in Q1, and could help keep price growth in check. But the biggest factor behind supply and demand this spring will be the number of new listings that come out of the woodwork, which will only start to come into focus in the months ahead.

Local Look: Western Washington Housing Update 12/11/24
Hi. I’m Jeff Tucker, principal economist at Windermere Real Estate, and this is a Local Look at the November 2024 data from the Northwest MLS.
After a blockbuster October report, this was another very strong month for the Washington housing market, especially for sales of single-family homes, and that’s the data I’ll be digging into today.
Here are the four key metrics I watch to track supply and demand in the market: closed and pending sales, which tell us a lot about demand; and listings – new and active – which tell us a lot about supply.
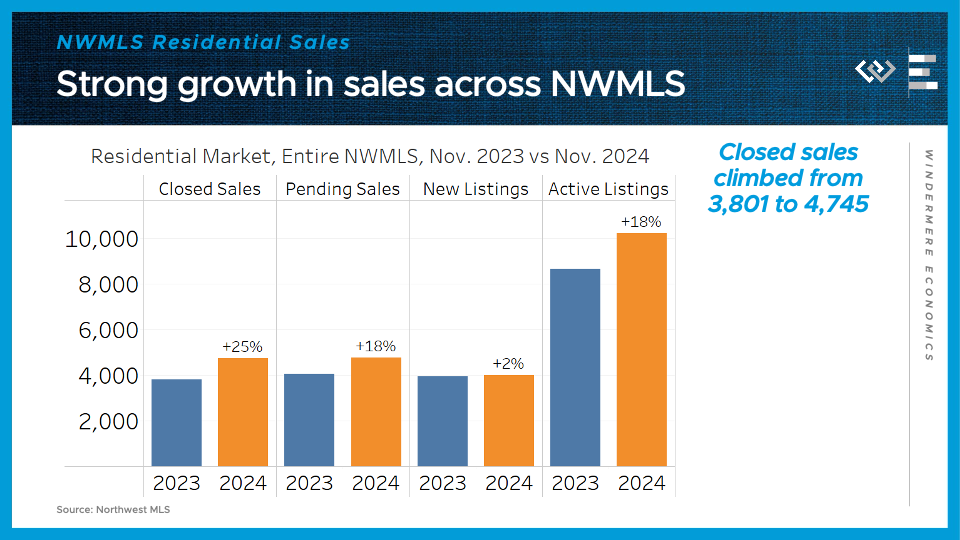
Closed sales of single-family homes climbed 25% year-over-year, from about 3800 to over 4700. Pending sales, which will mostly close in December, climbed a little less from last year, by 18%.
On the supply side, I think of listings as the reservoir of options for buyers to choose from: New listings, which represent the flow of new supply, were up only 2% in November, while the level of inventory in the reservoir was 18% higher than a year ago. Those are both more modest increases than we saw in October, which is a reassuring sign that the market isn’t headed for a glut.
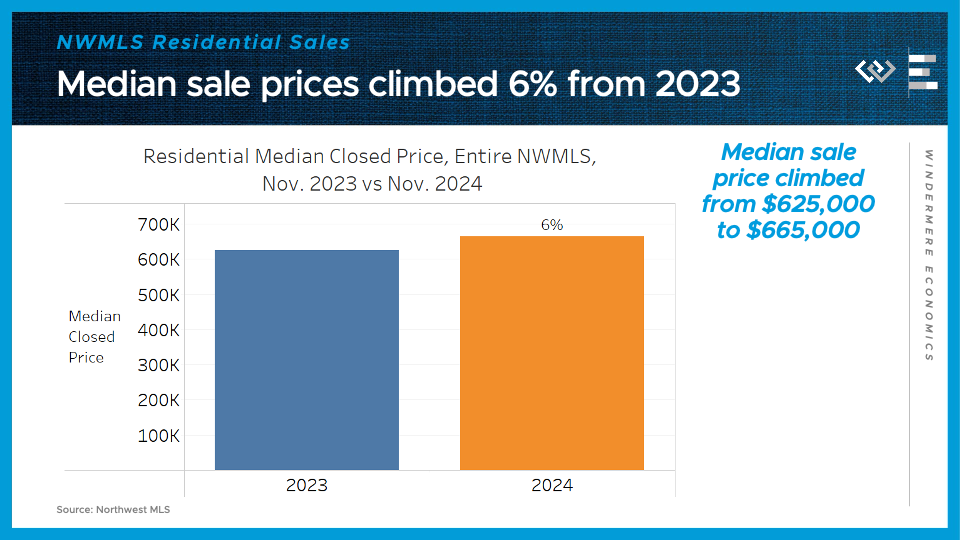
The final key metric to check in on: the median price for those closed single-family home sales climbed about 6% year-over year, from $625,000 to $665,000. That’s slightly lower than last month, which is normal for this time of year, and indicates that price growth is not accelerating in an unusual way. That’s important because affordability is still a key concern for the sustainability of the market throughout Washington.
The strength of closed sales, as well as sustained growth in pending sales, suggests to me that October wasn’t just a flash in the pan, of buyers jumping in because the Fed cut interest rates. Rather, I think that home sales are normalizing after staying extremely depressed for much of the last two years.
Now I’ll dig into the three counties that comprise the Seattle metropolitan area, where we saw similar trends play out.
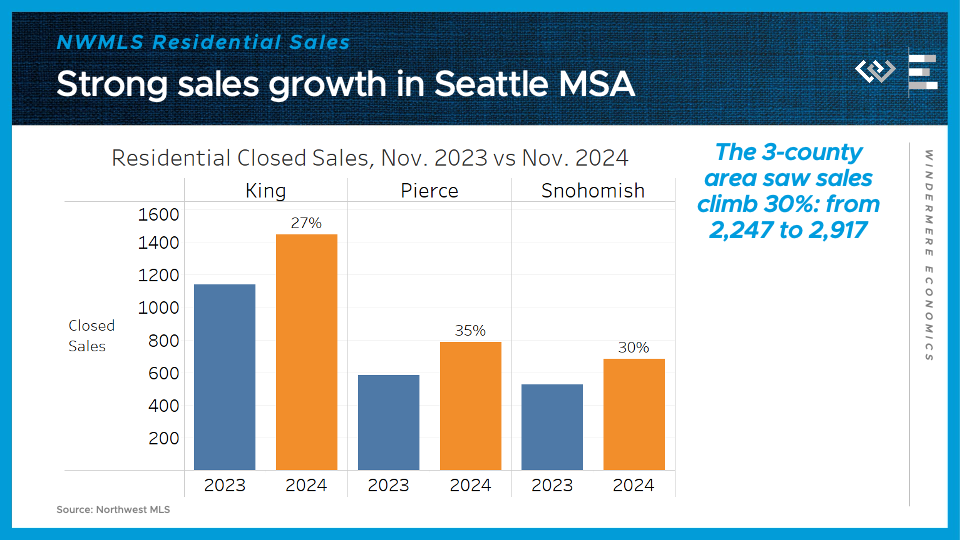
Residential closed sales jumped 27 percent year over year here in King County, which includes Seattle and Bellevue; a whopping 35% down in Pierce County, including Tacoma, and 30% up in Snohomish County, including Everett. So for the 3-county metropolitan area as a whole, that’s a gain of 30% from the same month last year.

The median sale price for those closed sales climbed a little less than last month, when it was closer to 10% annual gains. In November, closed prices climbed 4% in King County, up to $925,000; 5% in Pierce County, up to $565,000; and 8% in Snohomish County, up to $785,000.
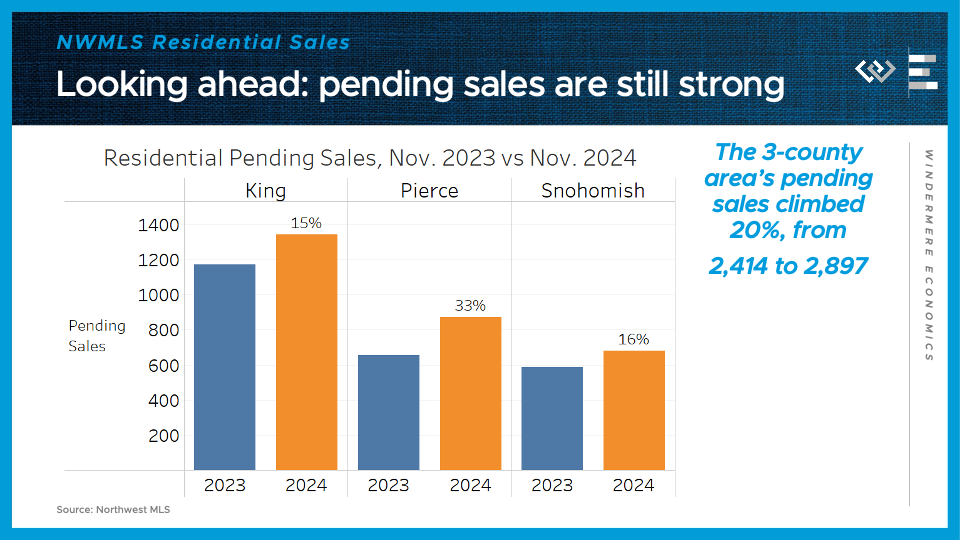
Looking ahead, each of these counties had solid, but somewhat lower annual growth in pending sales than they did in closed sales: 15% for King County; 33% in Pierce, and 16% in Snohomish County.
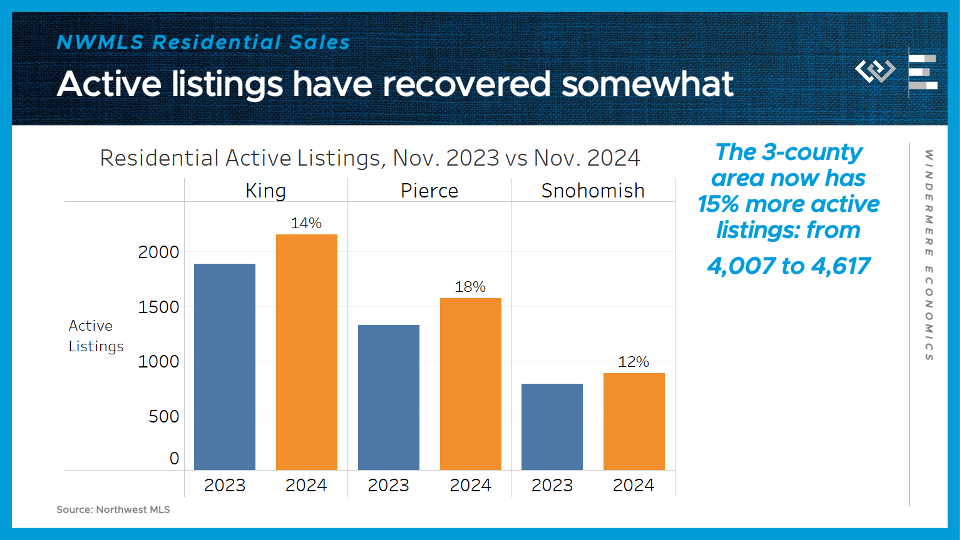
After all those sales, there’s still been a healthy increase in the active inventory of homes available to buy across the metro area, with about 14% more than last year in King County; 18% more in Pierce, and 12% more in Snohomish County, for an overall metro-wide increase of 15%. That’s substantially less than the increase in October, when the 3-county area had 26% more active listings than the year before.
All in all this was another encouraging report showing a much more active market than at the same time last year all around Washington, and it’s good evidence that buyers haven’t just rushed back into hibernation even though mortgage rates rebounded a bit last month.
Local Look: Western Washington Housing Update 11/7/24
This is the latest in a series of videos with Windermere Principal Economist Jeff Tucker titled Local Look where he delivers the key economic numbers to follow to keep you well-informed about what’s going on in the local real estate market.
Hi. I’m Jeff Tucker, principal economist at Windermere Real Estate, and this is a Local Look at the October 2024 data from the Northwest MLS.
All in all this was an incredibly strong report for the Washington housing market, especially in the single-family residential segment, which I’ll be focusing on today.
Here are the four key metrics I watch to get a sense of the market: sales, which tell us a lot about demand; and listings, which tell us about the state of supply.
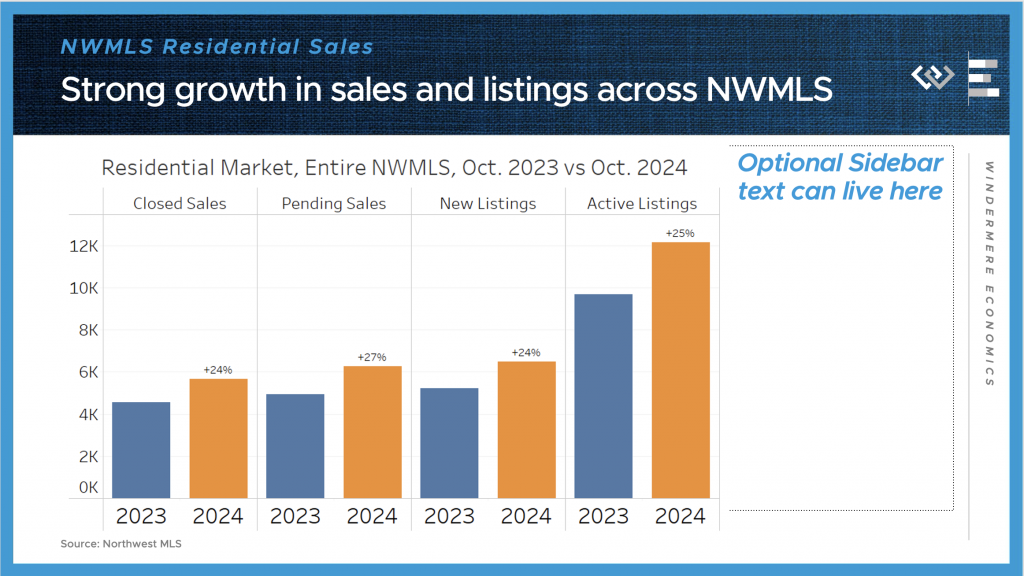
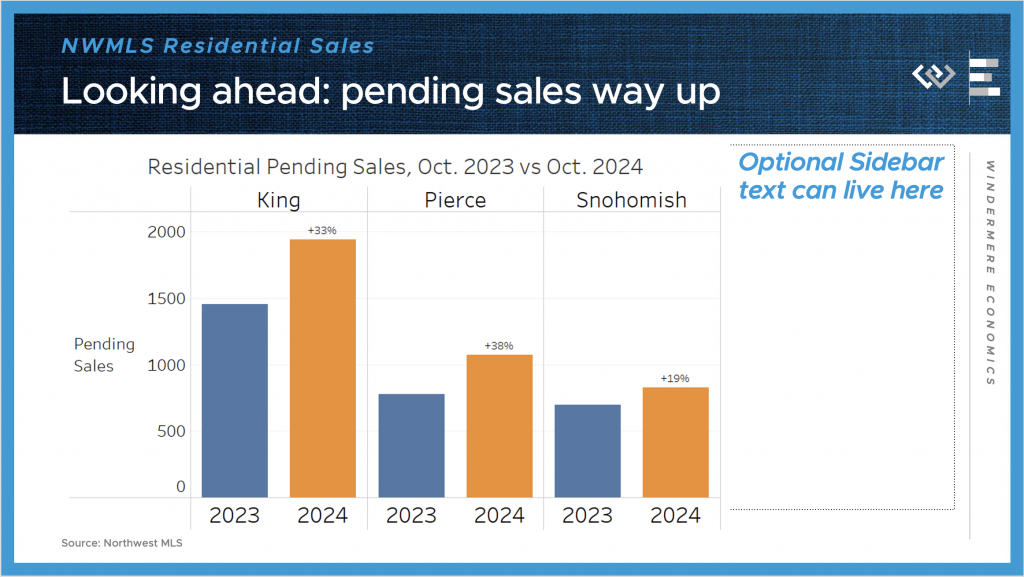
In total we saw residential closed sales climb by over a thousand from the same month last year, or 24%. And, as an important leading indicator for next month’s sales data, pending sales were up 27% year-over-year.
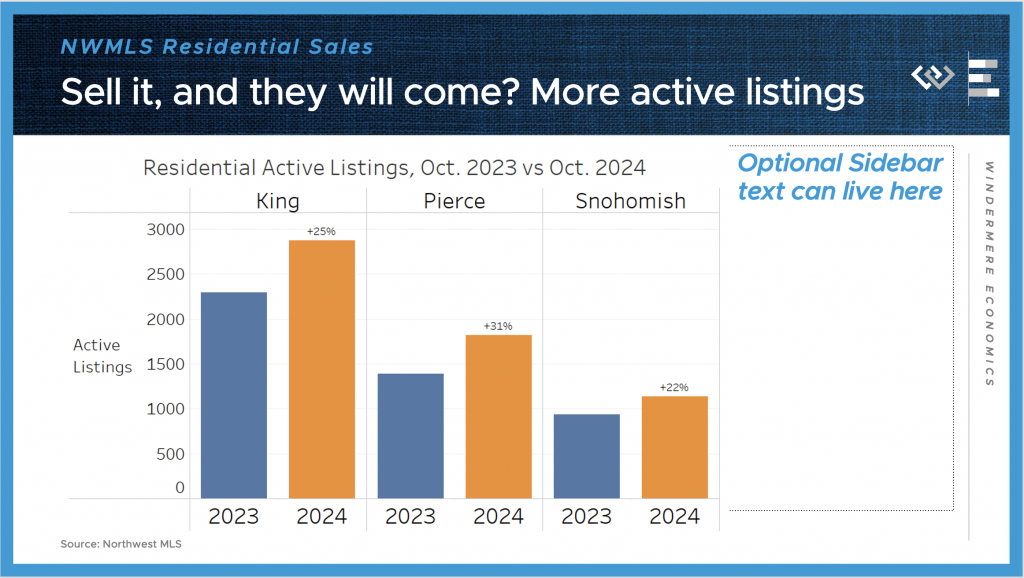
On the supply side, I think of listings as the reservoir of options for buyers to choose from: New listings, which represent the flow of supply, were up 24% in October, while the level of inventory in the reservoir climbed was 25% higher than a year ago. This looks like a market returning to a more healthy balance between buyers and sellers, although of course we expect the usual seasonal decline in inventory to begin any day now.
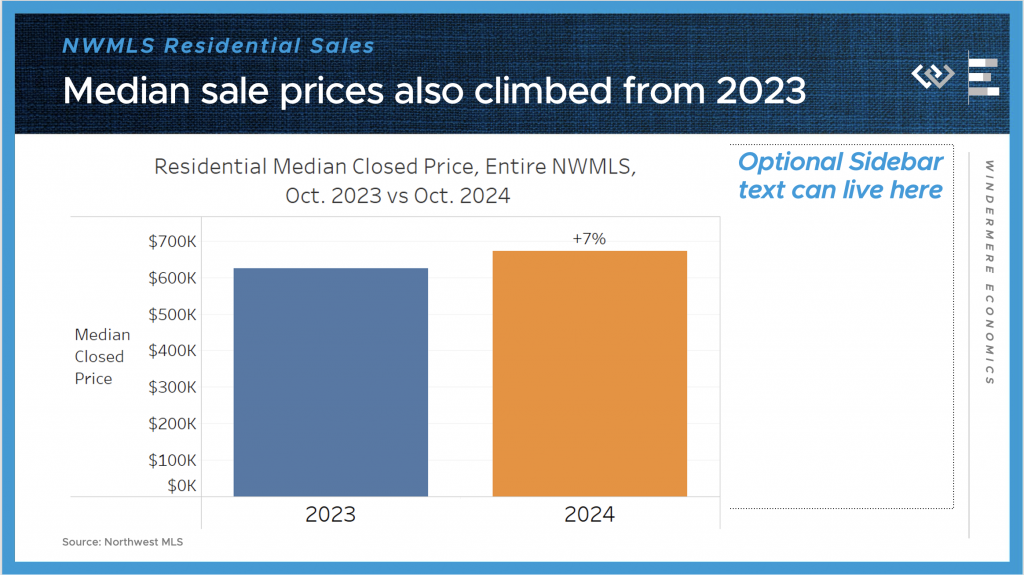
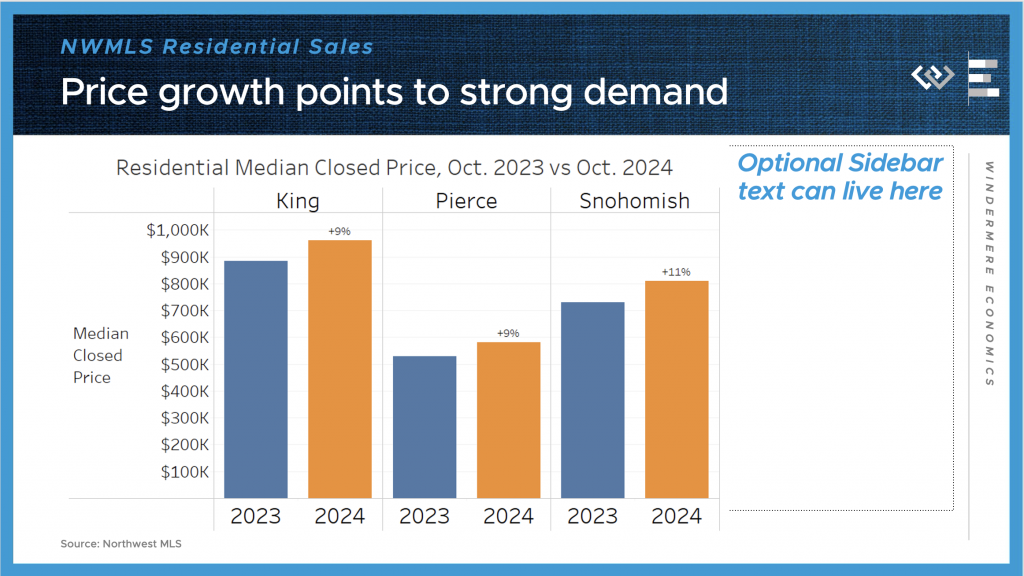
Also impressive to me: across the NWMLS, the median price for those closed single-family sales climbed more than 7% year-over year, from $625,000 to $671,500.
All in all it seemed that buyers finally responded in a big way, to the growth in active listings to choose from, as well as the decline in interest rates over the course of the summer. And while mortgage rates did rebound back up over the course of October, it seems like the news about how much downward progress they made, and the number of options to choose from, all helped to entice buyers to forge ahead with purchasing plans last month.
I can’t get into every local market, but just digging into the three counties that comprise the Seattle MSA, we saw similar trends play out, with especially high activity in King County, which includes Seattle and Bellevue.

Residential closed sales jumped a whopping 33 percent here in King County, and a still impressive 26% down in Pierce County, including Tacoma, and 20% up in Snohomish, including Everett.
The median sale price for those closed sales climbed 9% in King County, up to $960,000; 9% in Pierce County, up to $580,000; and 11% in Snohomish County, up to $730,000.
Looking ahead there’s not much sign of a slowdown, as pending sales were up 33% again for King County; 38% in Pierce, and 19% in Snohomish County.
Even after all those sales, there are still a lot more single-family houses on the market around the 3-county region than this time last year, with about 25% more in King County; 31% more in Pierce, and 22% more in Snohomish County.
All in all this was a very encouraging report showing signs of life returning to the local housing markets around Washington, and maybe most importantly, a proof of concept that when mortgage rates fall, even just to near 6%, activity in the market picks up and people get back to moving, buying and selling.
Q3 2023 Western Washington Real Estate Market Update

The following analysis of select counties of the Western Washington real estate market is provided by Windermere Real Estate. We hope that this information may assist you with making better-informed real estate decisions. For further information about the housing market in your area, please don’t hesitate to contact your Windermere Real Estate agent.
Regional Economic Overview
The pace of job growth continues to slow in Western Washington, as the region added only 21,907 new positions over the past 12 months. This represented a growth rate of 1.4%, which was the lowest pace of new jobs added since the pandemic ended.
The regional unemployment rate in August was 5.8%, which was marginally below the 6% rate we saw in the same quarter in 2022. A few smaller counties lost jobs over the past 12 months while King County’s employment levels rose a meager .4%, mainly due to job losses in the technology sector. I’ve said before that I’m not convinced that the U.S. is going to enter a recession; I still stand by that theory. Slowing job growth does not necessarily need to be a precursor to a recession, but I expect that we will see lackluster growth until next spring at the earliest.
Western Washington Home Sales
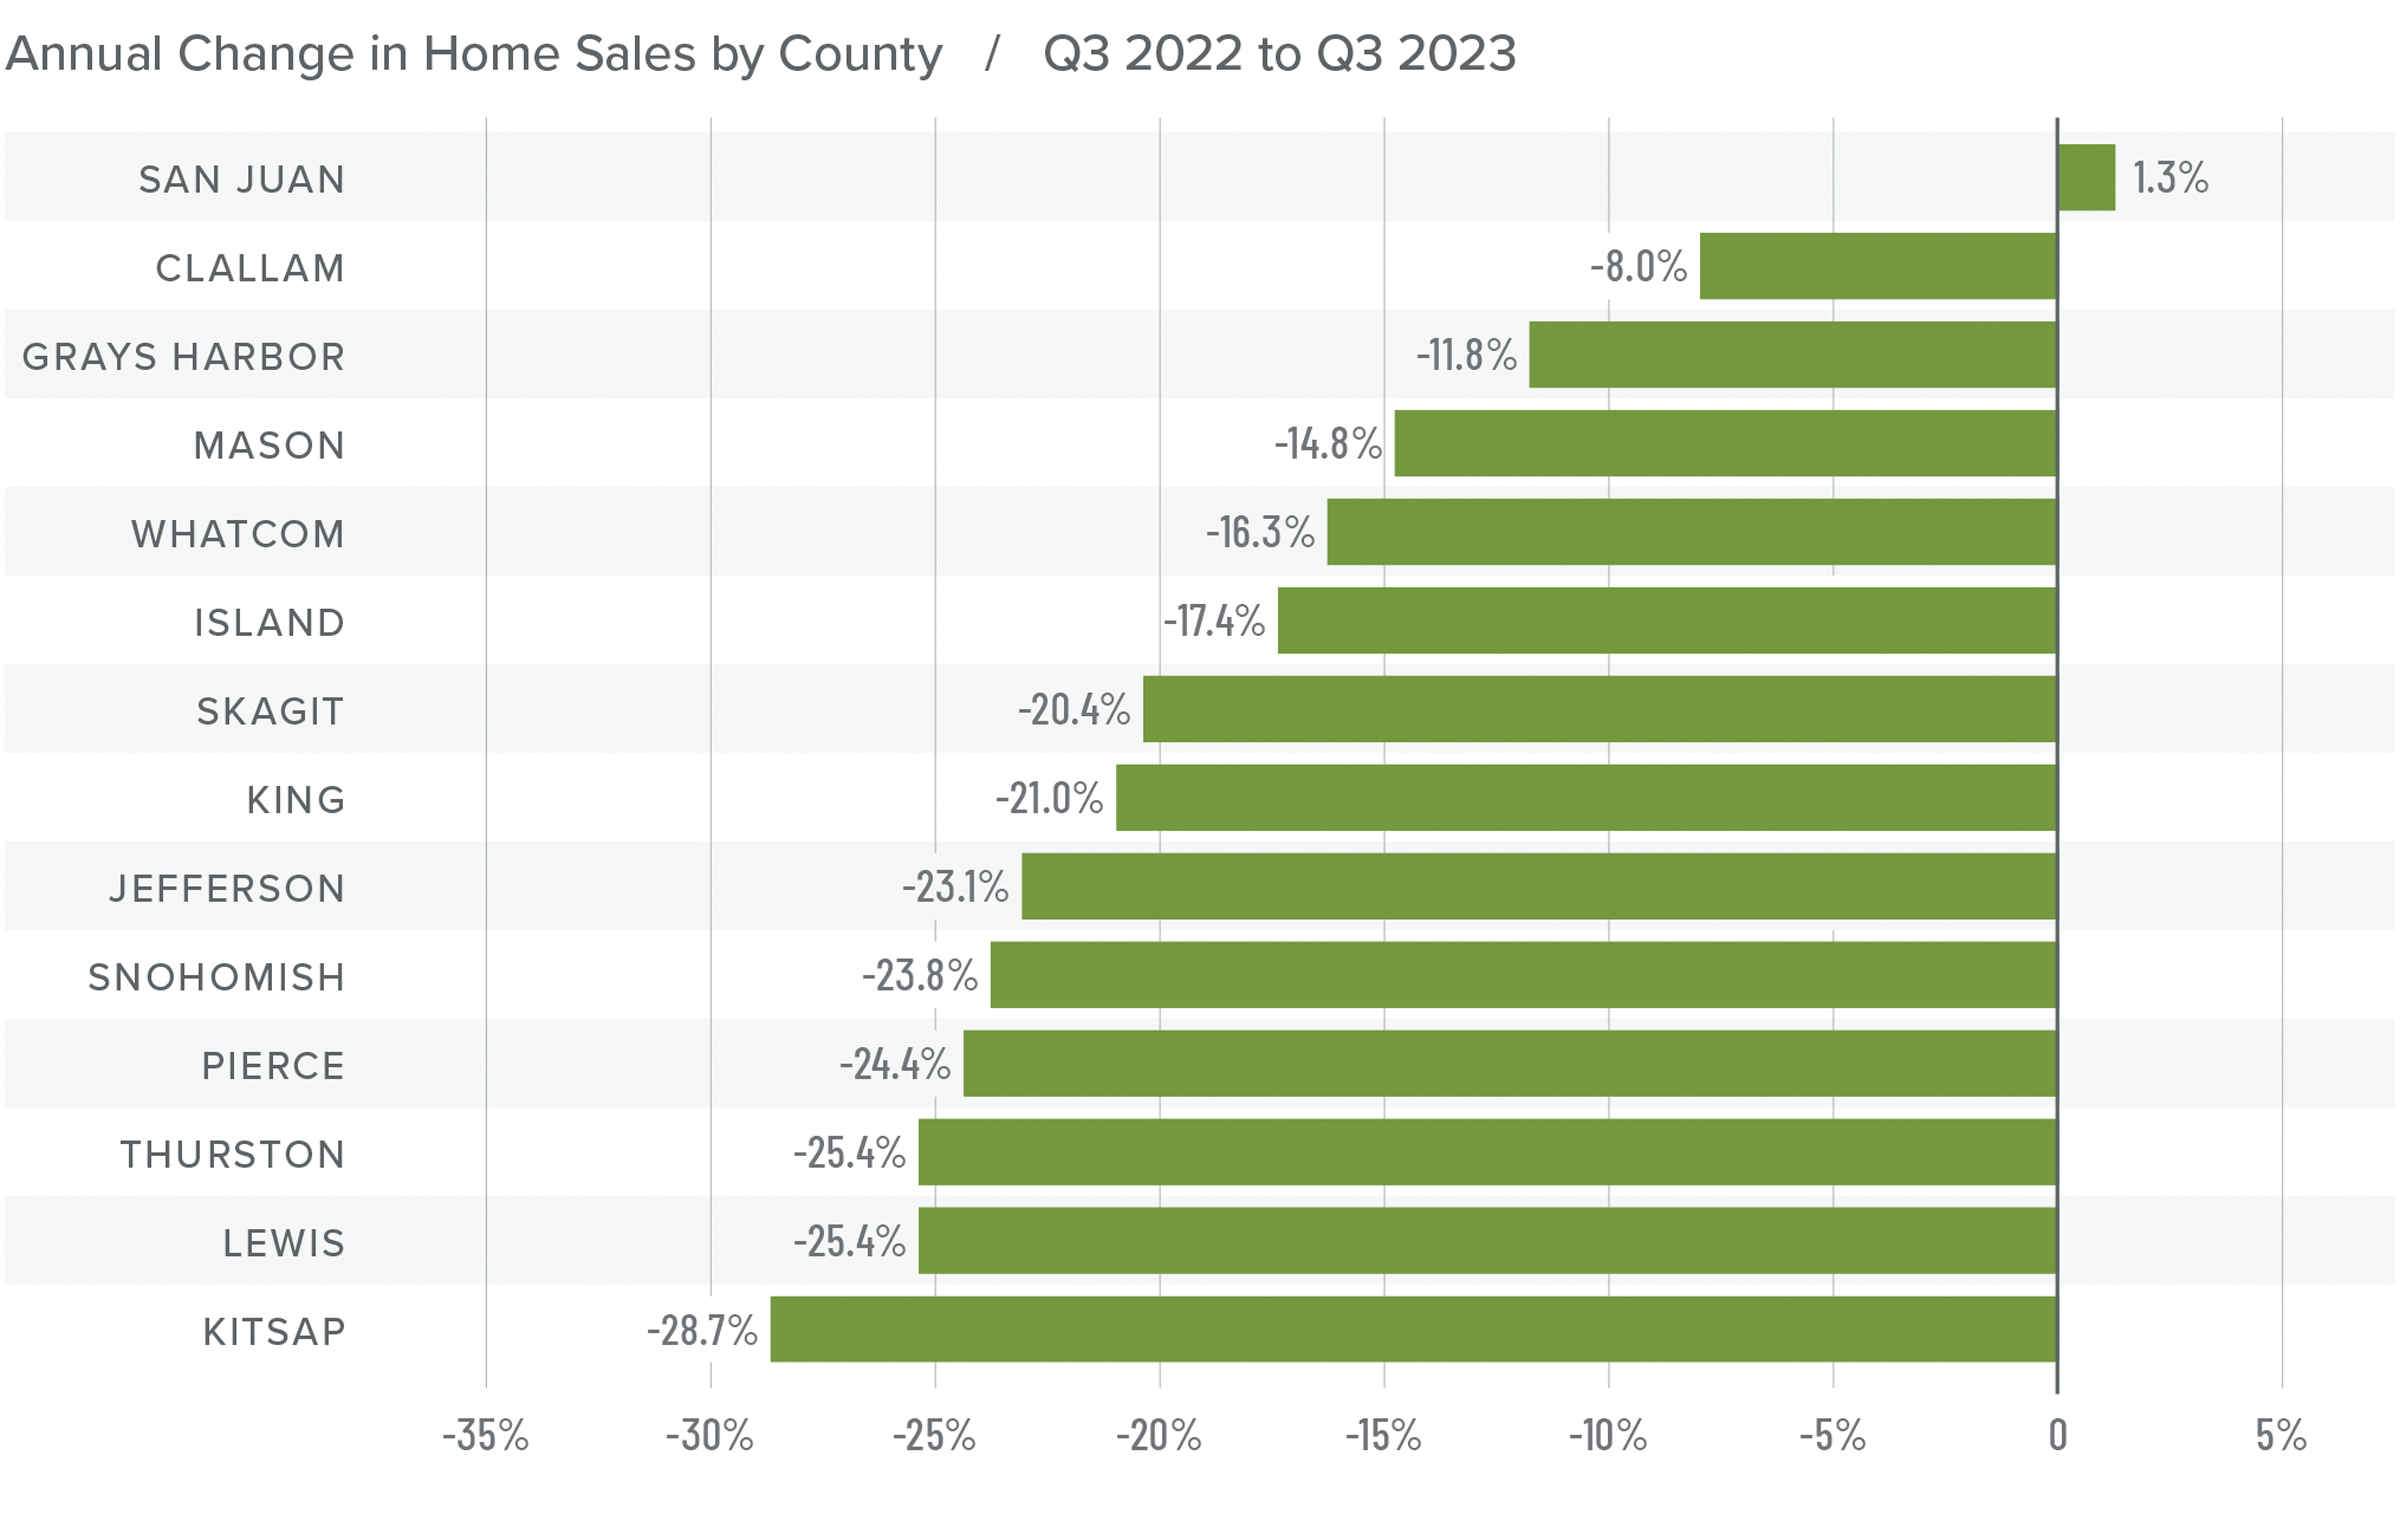
❱ In the third quarter of 2023, 14,970 homes sold. This was down 22% from the third quarter of 2022 and 1% lower than in the second quarter of this year.
❱ Sales fell even as the average number of homes for sale increased 29.5% from the second quarter. This is clearly a sign that significantly higher mortgage rates are having an impact on the market.
❱ Sales fell in all counties except San Juan compared to the third quarter of 2022. They were up in 9 of the 14 counties covered in this report compared to the second quarter of 2023. San Juan, Mason, Grays Harbor, and Whatcom counties saw significant increases.
❱ Pending sales fell 6% compared to the second quarter of this year, suggesting that closings in the upcoming quarter may be lackluster unless mortgage rates fall, which I think is highly unlikely.
Western Washington Home Prices
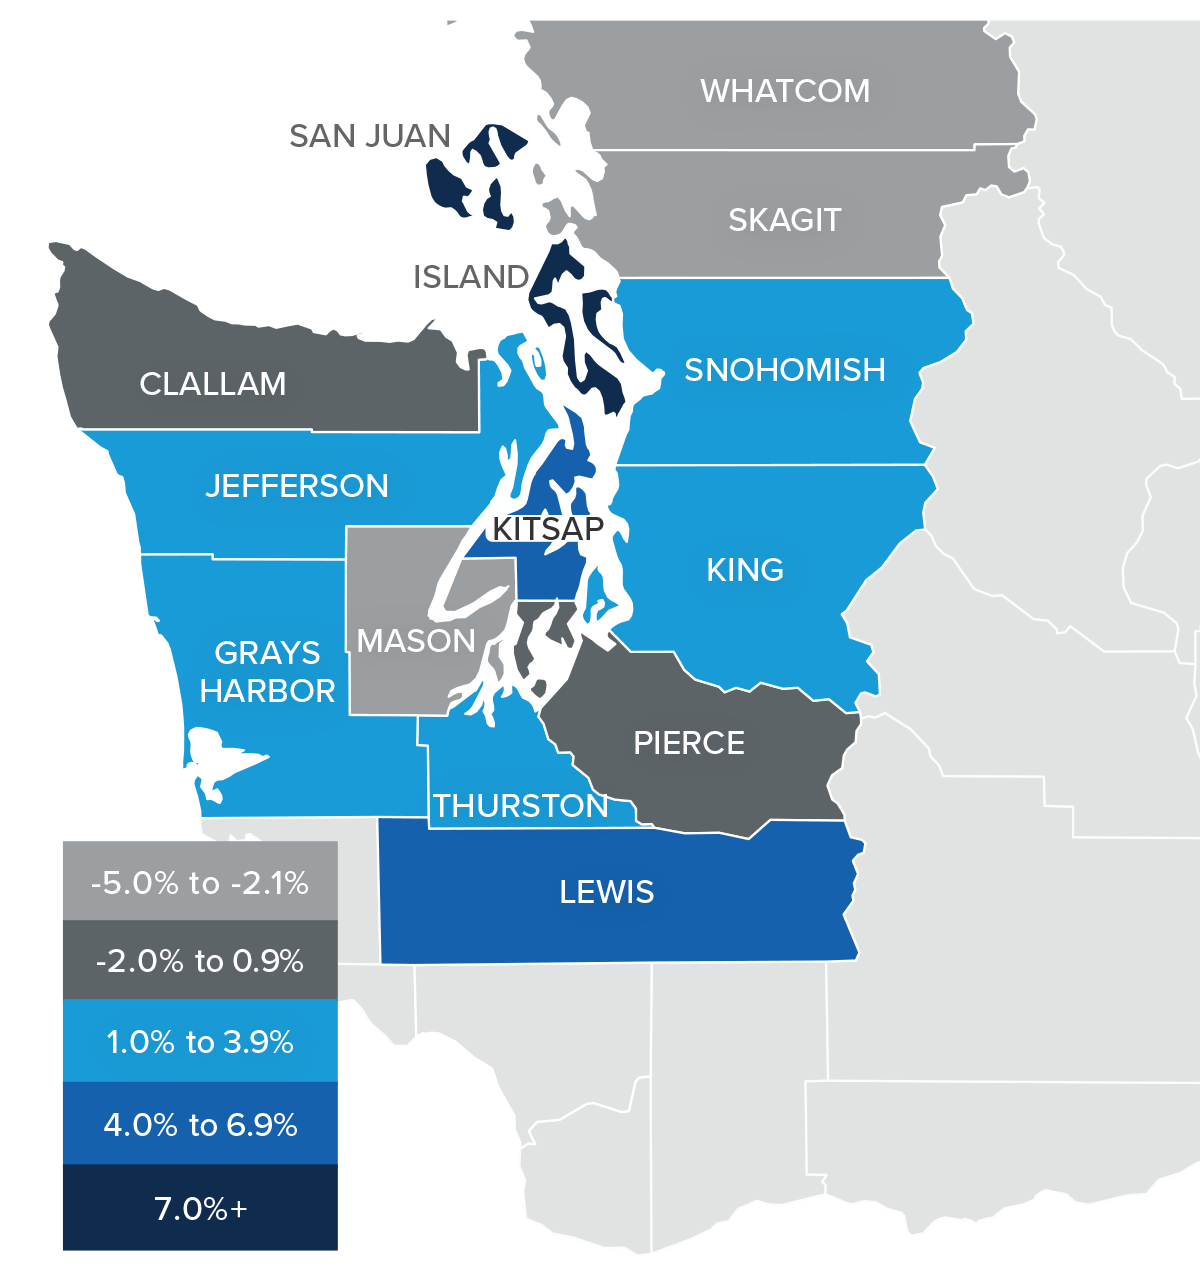
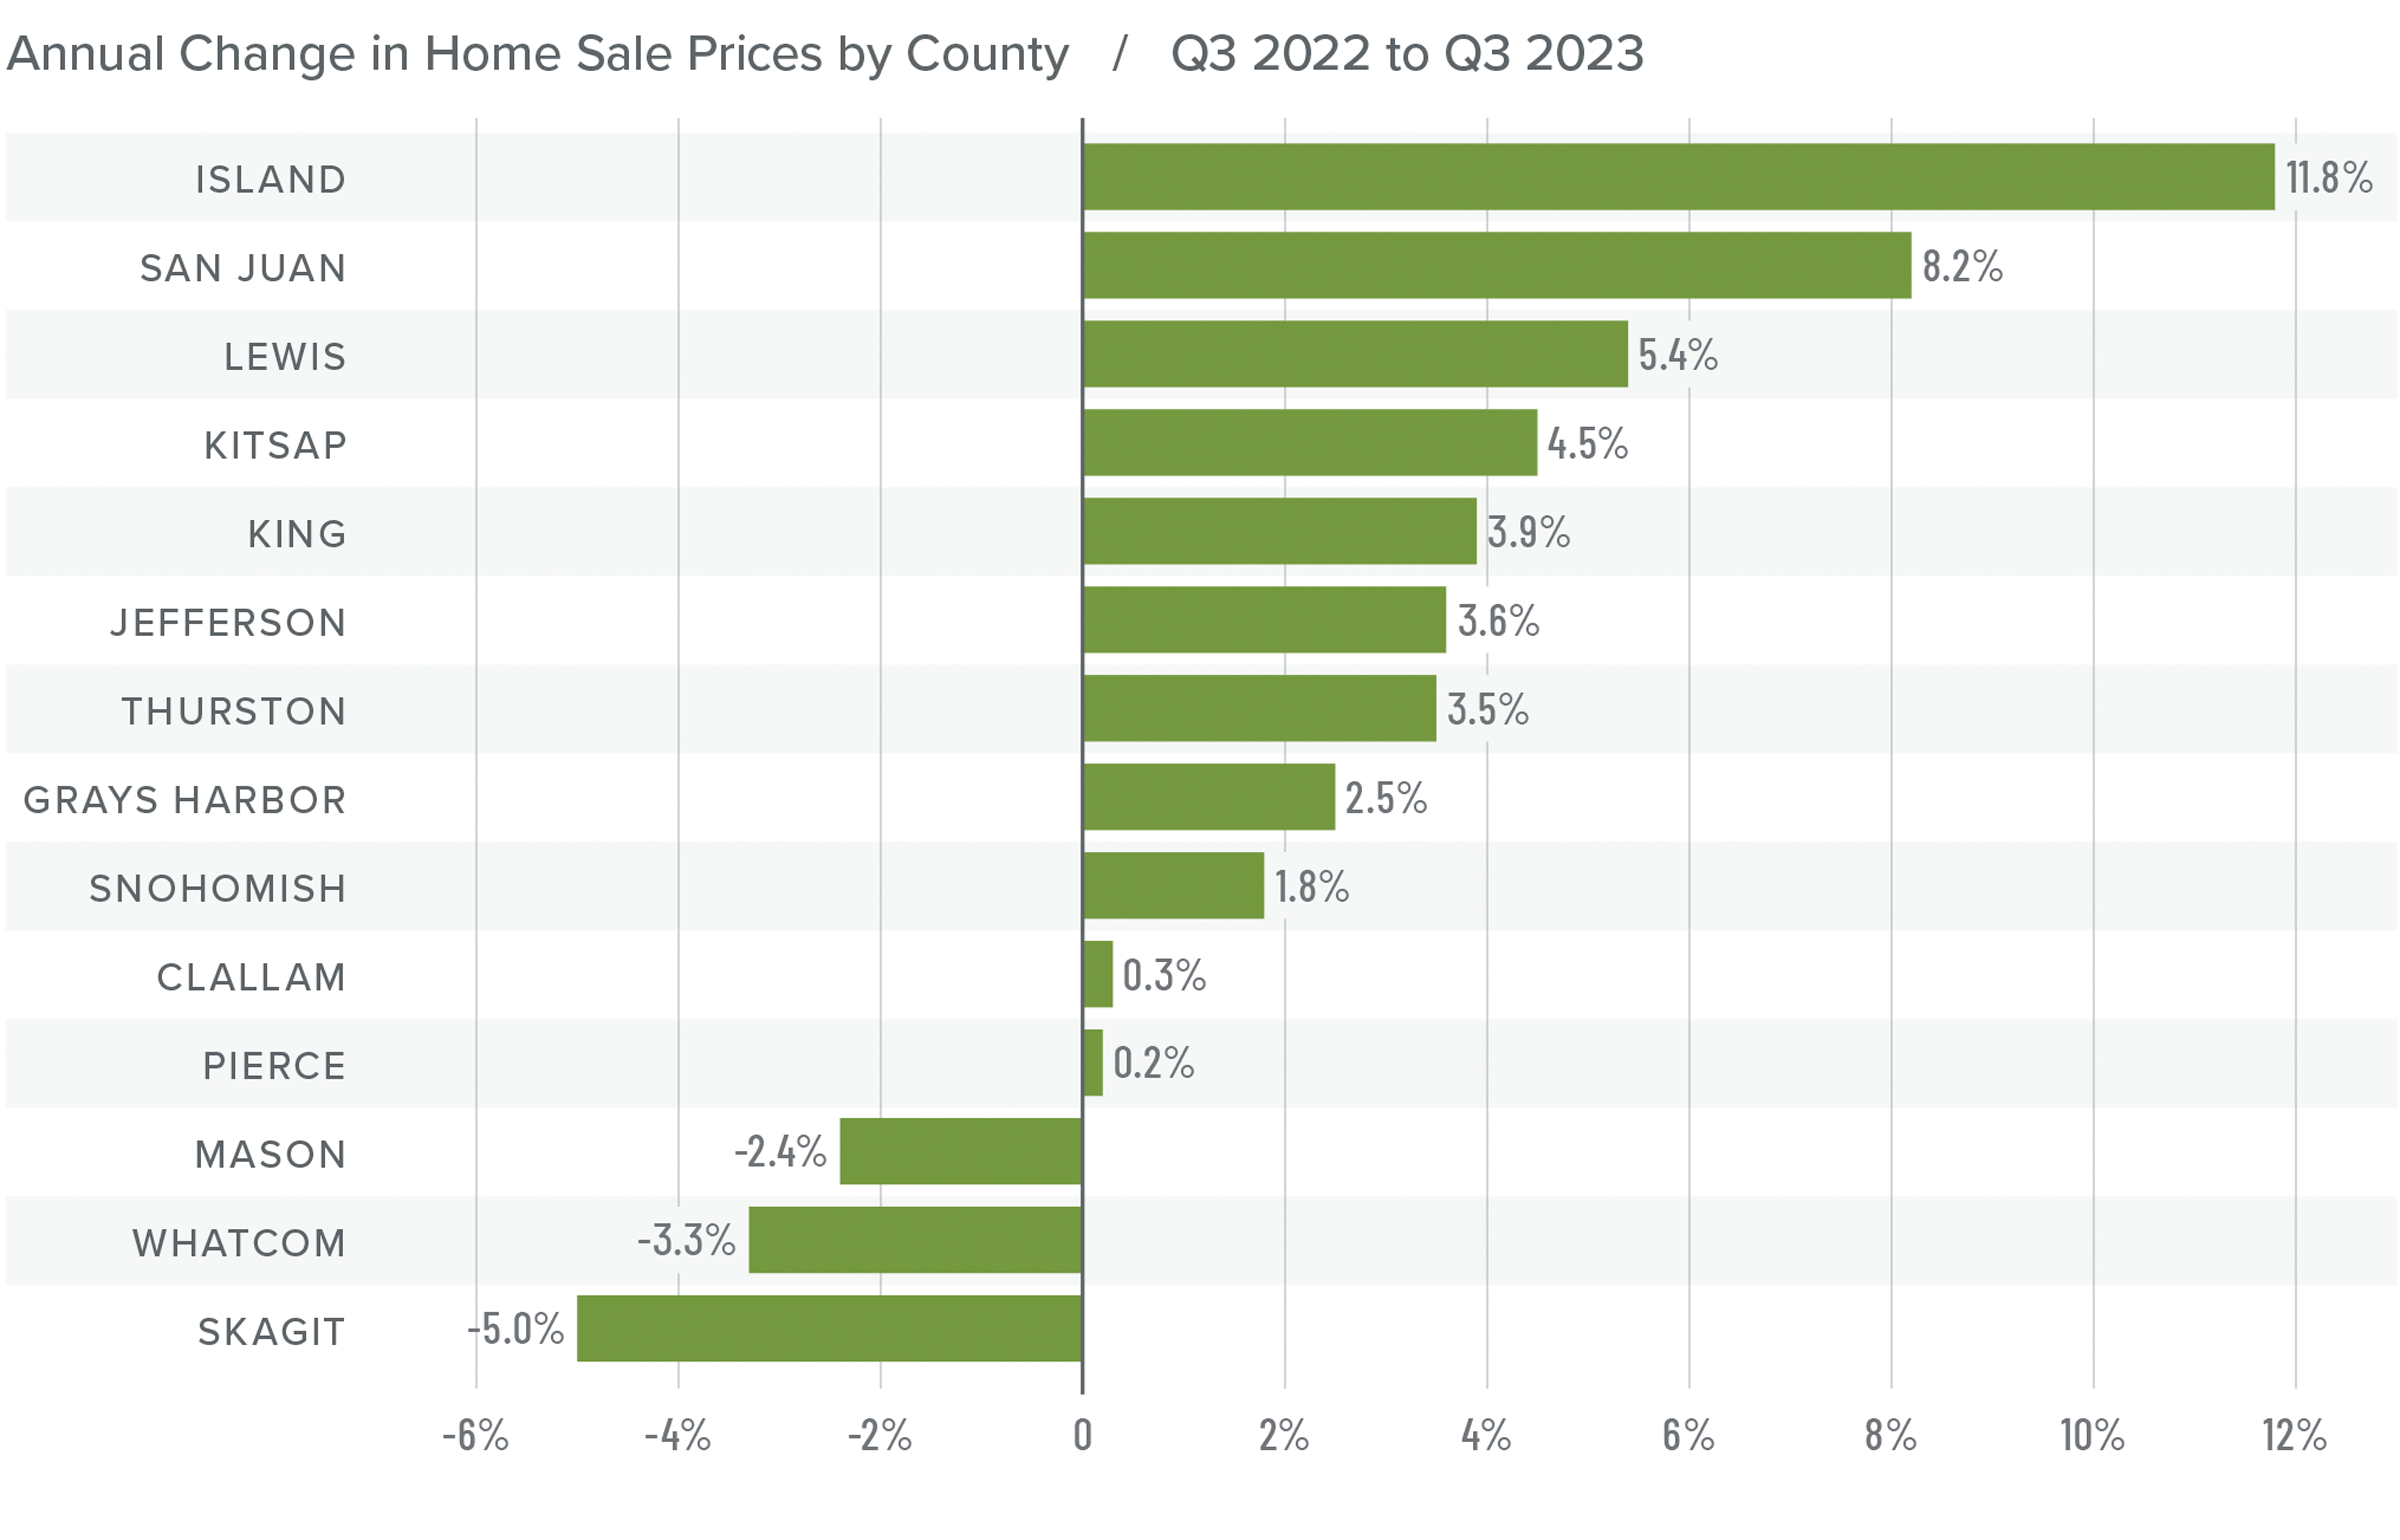
❱ Prices rose 2.8% compared to the third quarter of 2022 and were .6% higher than in the second quarter of this year. The average home sale price was $776,205.
❱ Compared to the second quarter of this year, sale prices were higher in all counties except Grays Harbor (-.5%), Kitsap (-1.5%), Clallam (-1.6%), Whatcom (-2.6%), and Skagit (-3%).
❱ Compared to the prior year, the pace of price growth slowed in the third quarter. This wasn’t too surprising given that the market was coming off record high
prices in the summer of 2022. But what was surprising was that prices rose over the previous quarter despite the fact that mortgage rates were above 7% for almost the entire quarter.
❱ I don’t expect prices to move far from current levels in the coming months, and they likely won’t rise again until mortgage rates start to fall. When prices do rise, I anticipate that the pace of growth will be far more modest than we have become accustomed to.
Mortgage Rates
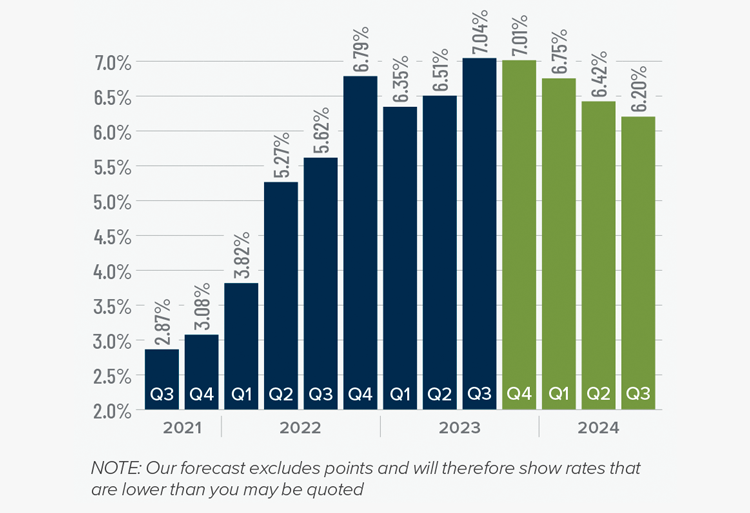
Mortgage rates continued trending higher in the third quarter of 2023 and are now at levels we have not seen since the fall of 2000. Mortgage rates are tied to the interest rate (yield) on 10-year treasuries, and they move in the opposite direction of the economy. Unfortunately for mortgage rates, the economy remains relatively buoyant, and though inflation is down significantly from its high, it is still elevated. These major factors and many minor ones are pushing Treasury yields higher, which is pushing mortgage rates up. Given the current position of the Federal Reserve, which intends to keep rates “higher for longer,” it is unlikely that home buyers will get much reprieve when it comes to borrowing costs any time soon.
With such a persistently positive economy, I have had to revise my forecast yet again. I now believe rates will hold at current levels before starting to trend down in the spring of next year.
Western Washington Days on Market
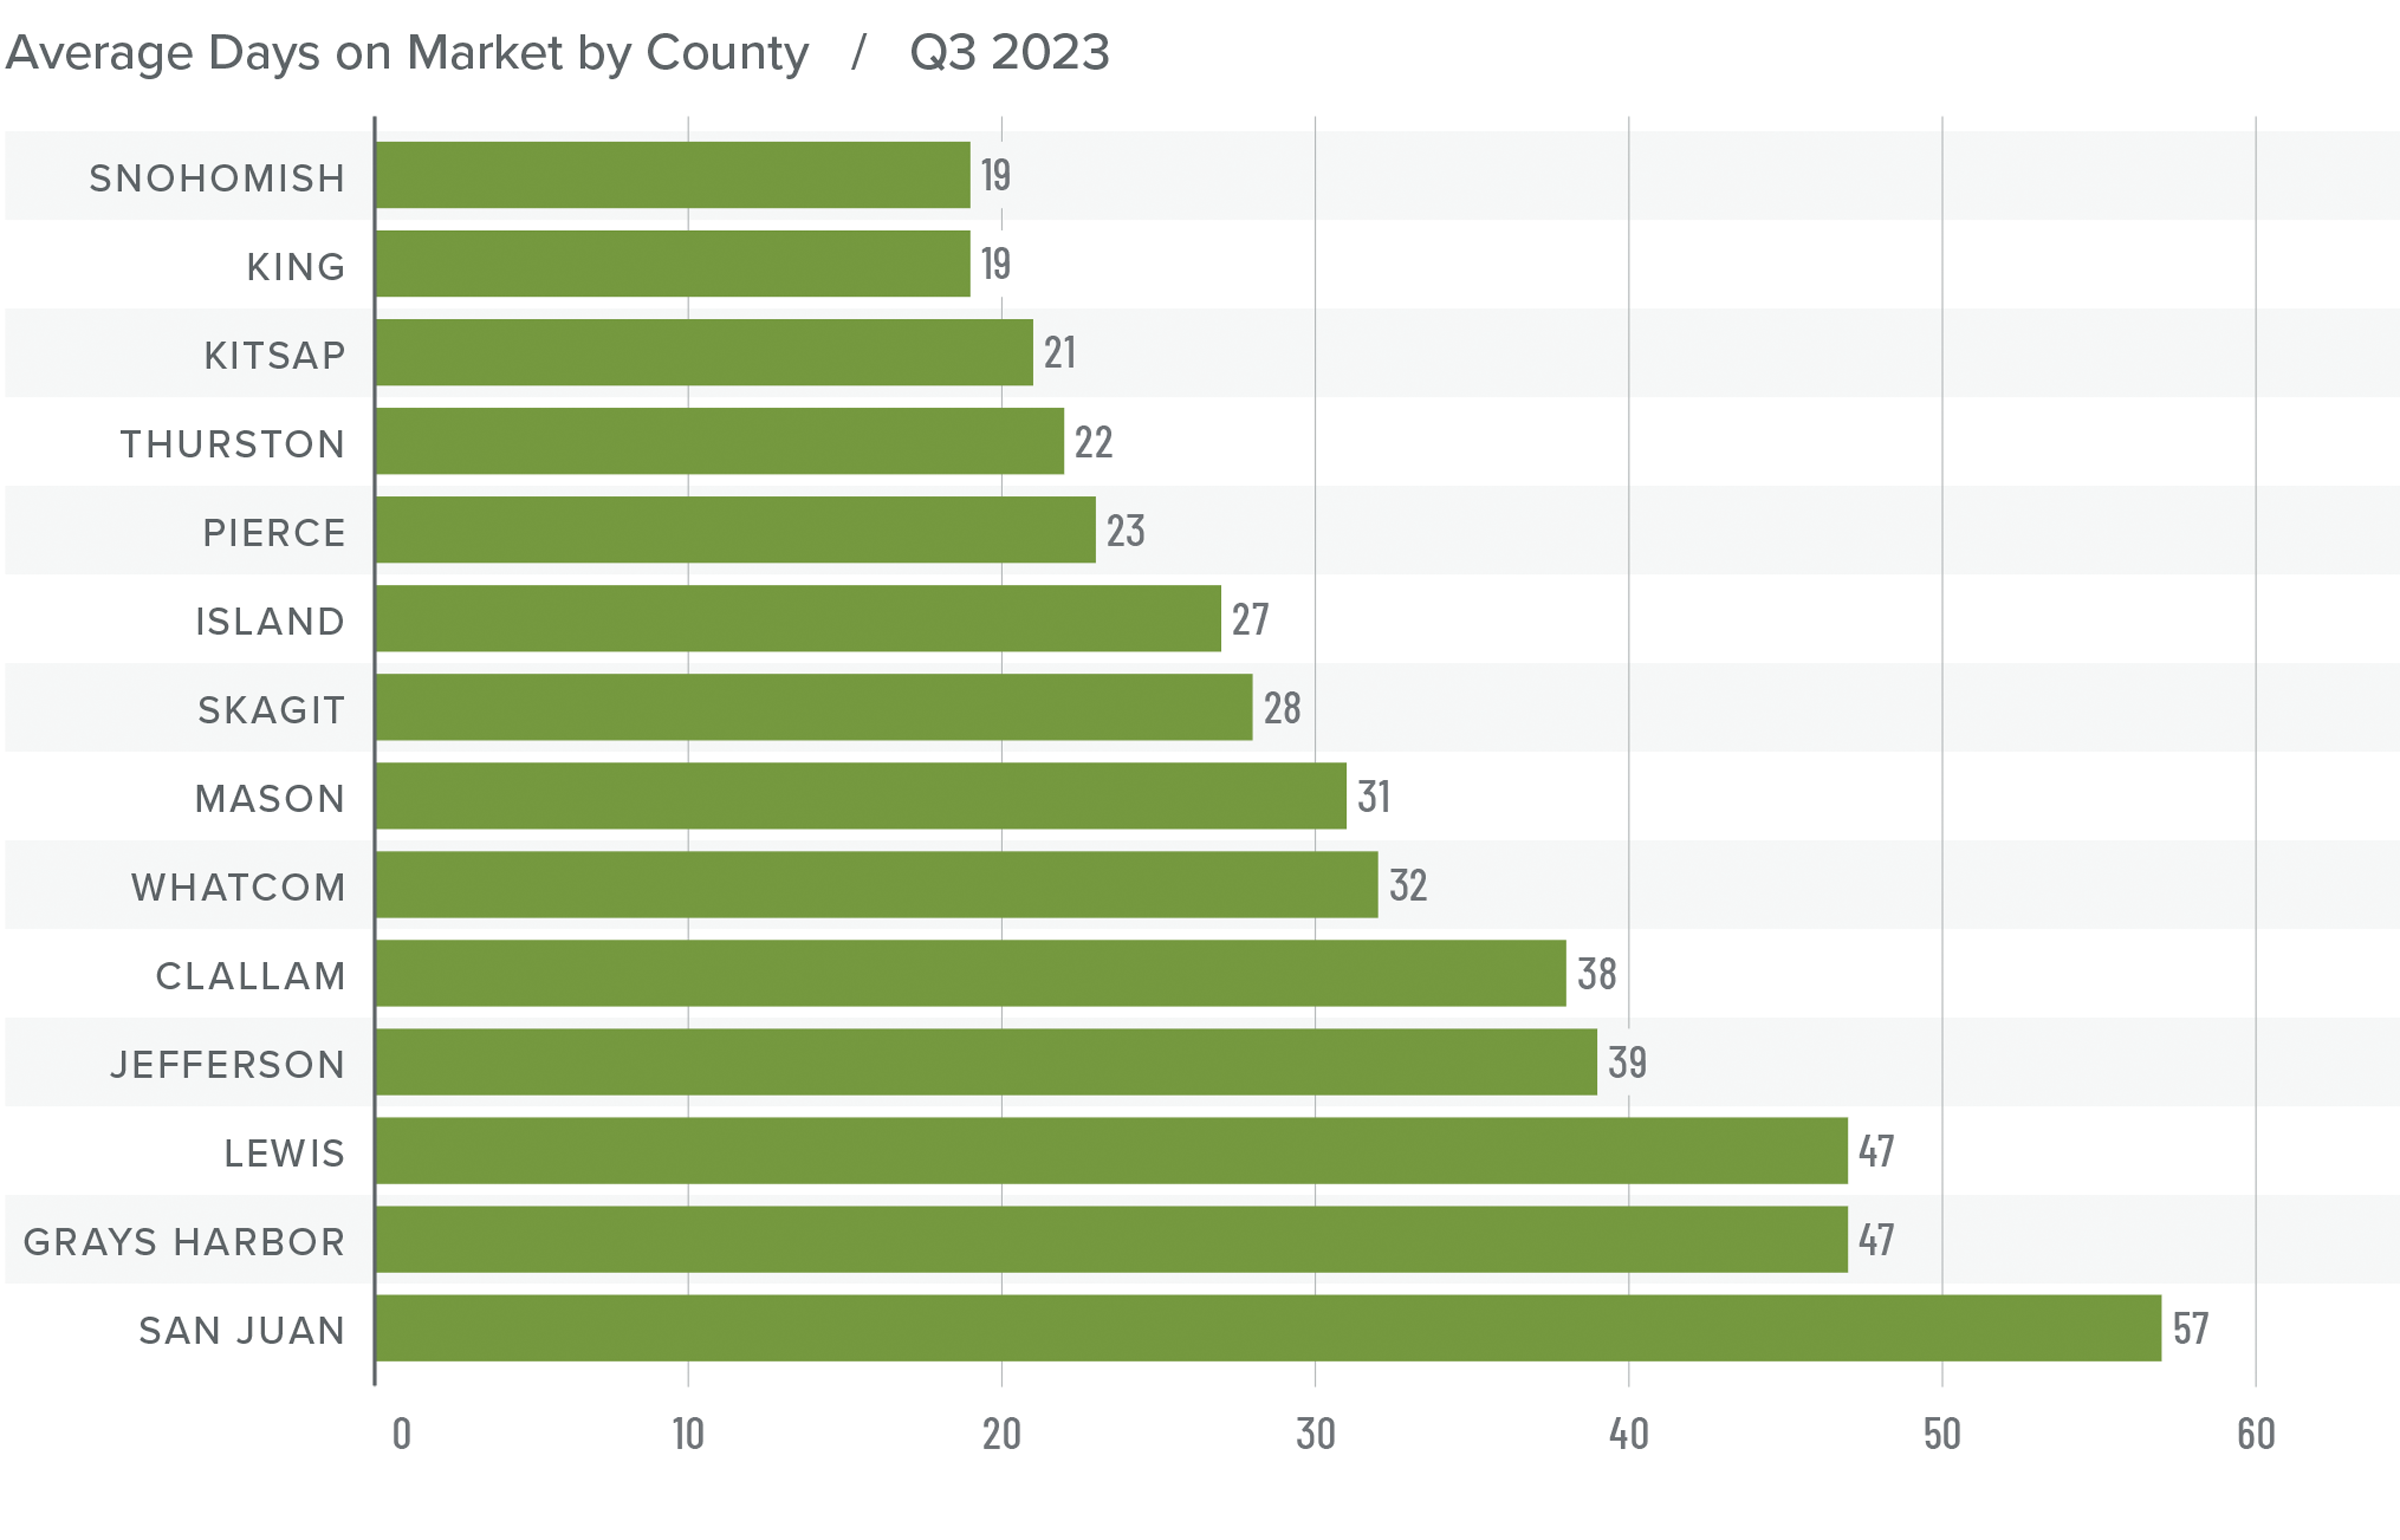
❱ It took an average of 32 days for homes to sell in the third quarter of 2023. This was 8 more days than in the same quarter of 2022, but 3 fewer days compared to the second quarter of this year.
❱ Snohomish and King counties were the tightest markets in Western Washington, with homes taking an average of only 19 days to find a buyer. Homes for sale in San Juan County took the longest time to find a buyer (57 days).
❱ All counties except Snohomish saw average days on market rise from the same period in 2022. Market time fell in 9 of the 14 counties compared to the prior quarter.
❱ The greatest fall in market time compared to the second quarter was in San Juan County, where market time fell 23 days.
Conclusions
This speedometer reflects the state of the region’s real estate market using housing inventory, price gains, home sales, interest rates, and larger economic factors.
Although it was good that listing activity rose in the third quarter, it still remains well below levels that can be considered normal. This is unlikely to change anytime soon given that over 86% of Washington homeowners with mortgages have an interest rate below 5% and more than a quarter have rates at or below 3%. There is little incentive for them to sell if they don’t have to.
More germane is the disconnect between what homeowners believe their homes are worth and what buyers can afford with mortgage rates in the mid-7% range. Most sellers appear to be getting their asking prices, or very close to it, which reflects their confidence in the market. However, home buyers are being squeezed by multi-decade high borrowing costs.
It is all quite a quandary. However, taking all the factors into consideration, sellers still have the upper hand but not enough to move the needle from the position it was in last quarter

Given all the factors discussed above, the needle stays in the same position as the last quarter. The market still heavily favors sellers, but if rates rise much further, headwinds will likely increase.
Q2 2023 Western Washington Real Estate Market Update

The following analysis of select counties of the Western Washington real estate market is provided by Windermere Real Estate Chief Economist Matthew Gardner. We hope that this information may assist you with making better-informed real estate decisions. For further information about the housing market in your area, please don’t hesitate to contact your Windermere Real Estate agent.
Regional Economic Overview
As discussed in the first quarter Gardner Report, job growth continues to slow. Even though Western Washington added 54,391 new jobs over the past 12 months, which represented a decent growth rate of 2.3%, the slowdown in the creation of new jobs is palpable. The regional unemployment rate in May was 3.7%, which is marginally above the 3.4% of a year ago. As we enter the summer months, I have started to ponder the economic outlook for the balance of this year as well as looking ahead to 2024. Although many are still suggesting a looming recession, I remain unconvinced. However, if enough people expect to see an economic contraction, it can become a self-fulfilling prophecy, which has happened in the past!
Western Washington Home Sales
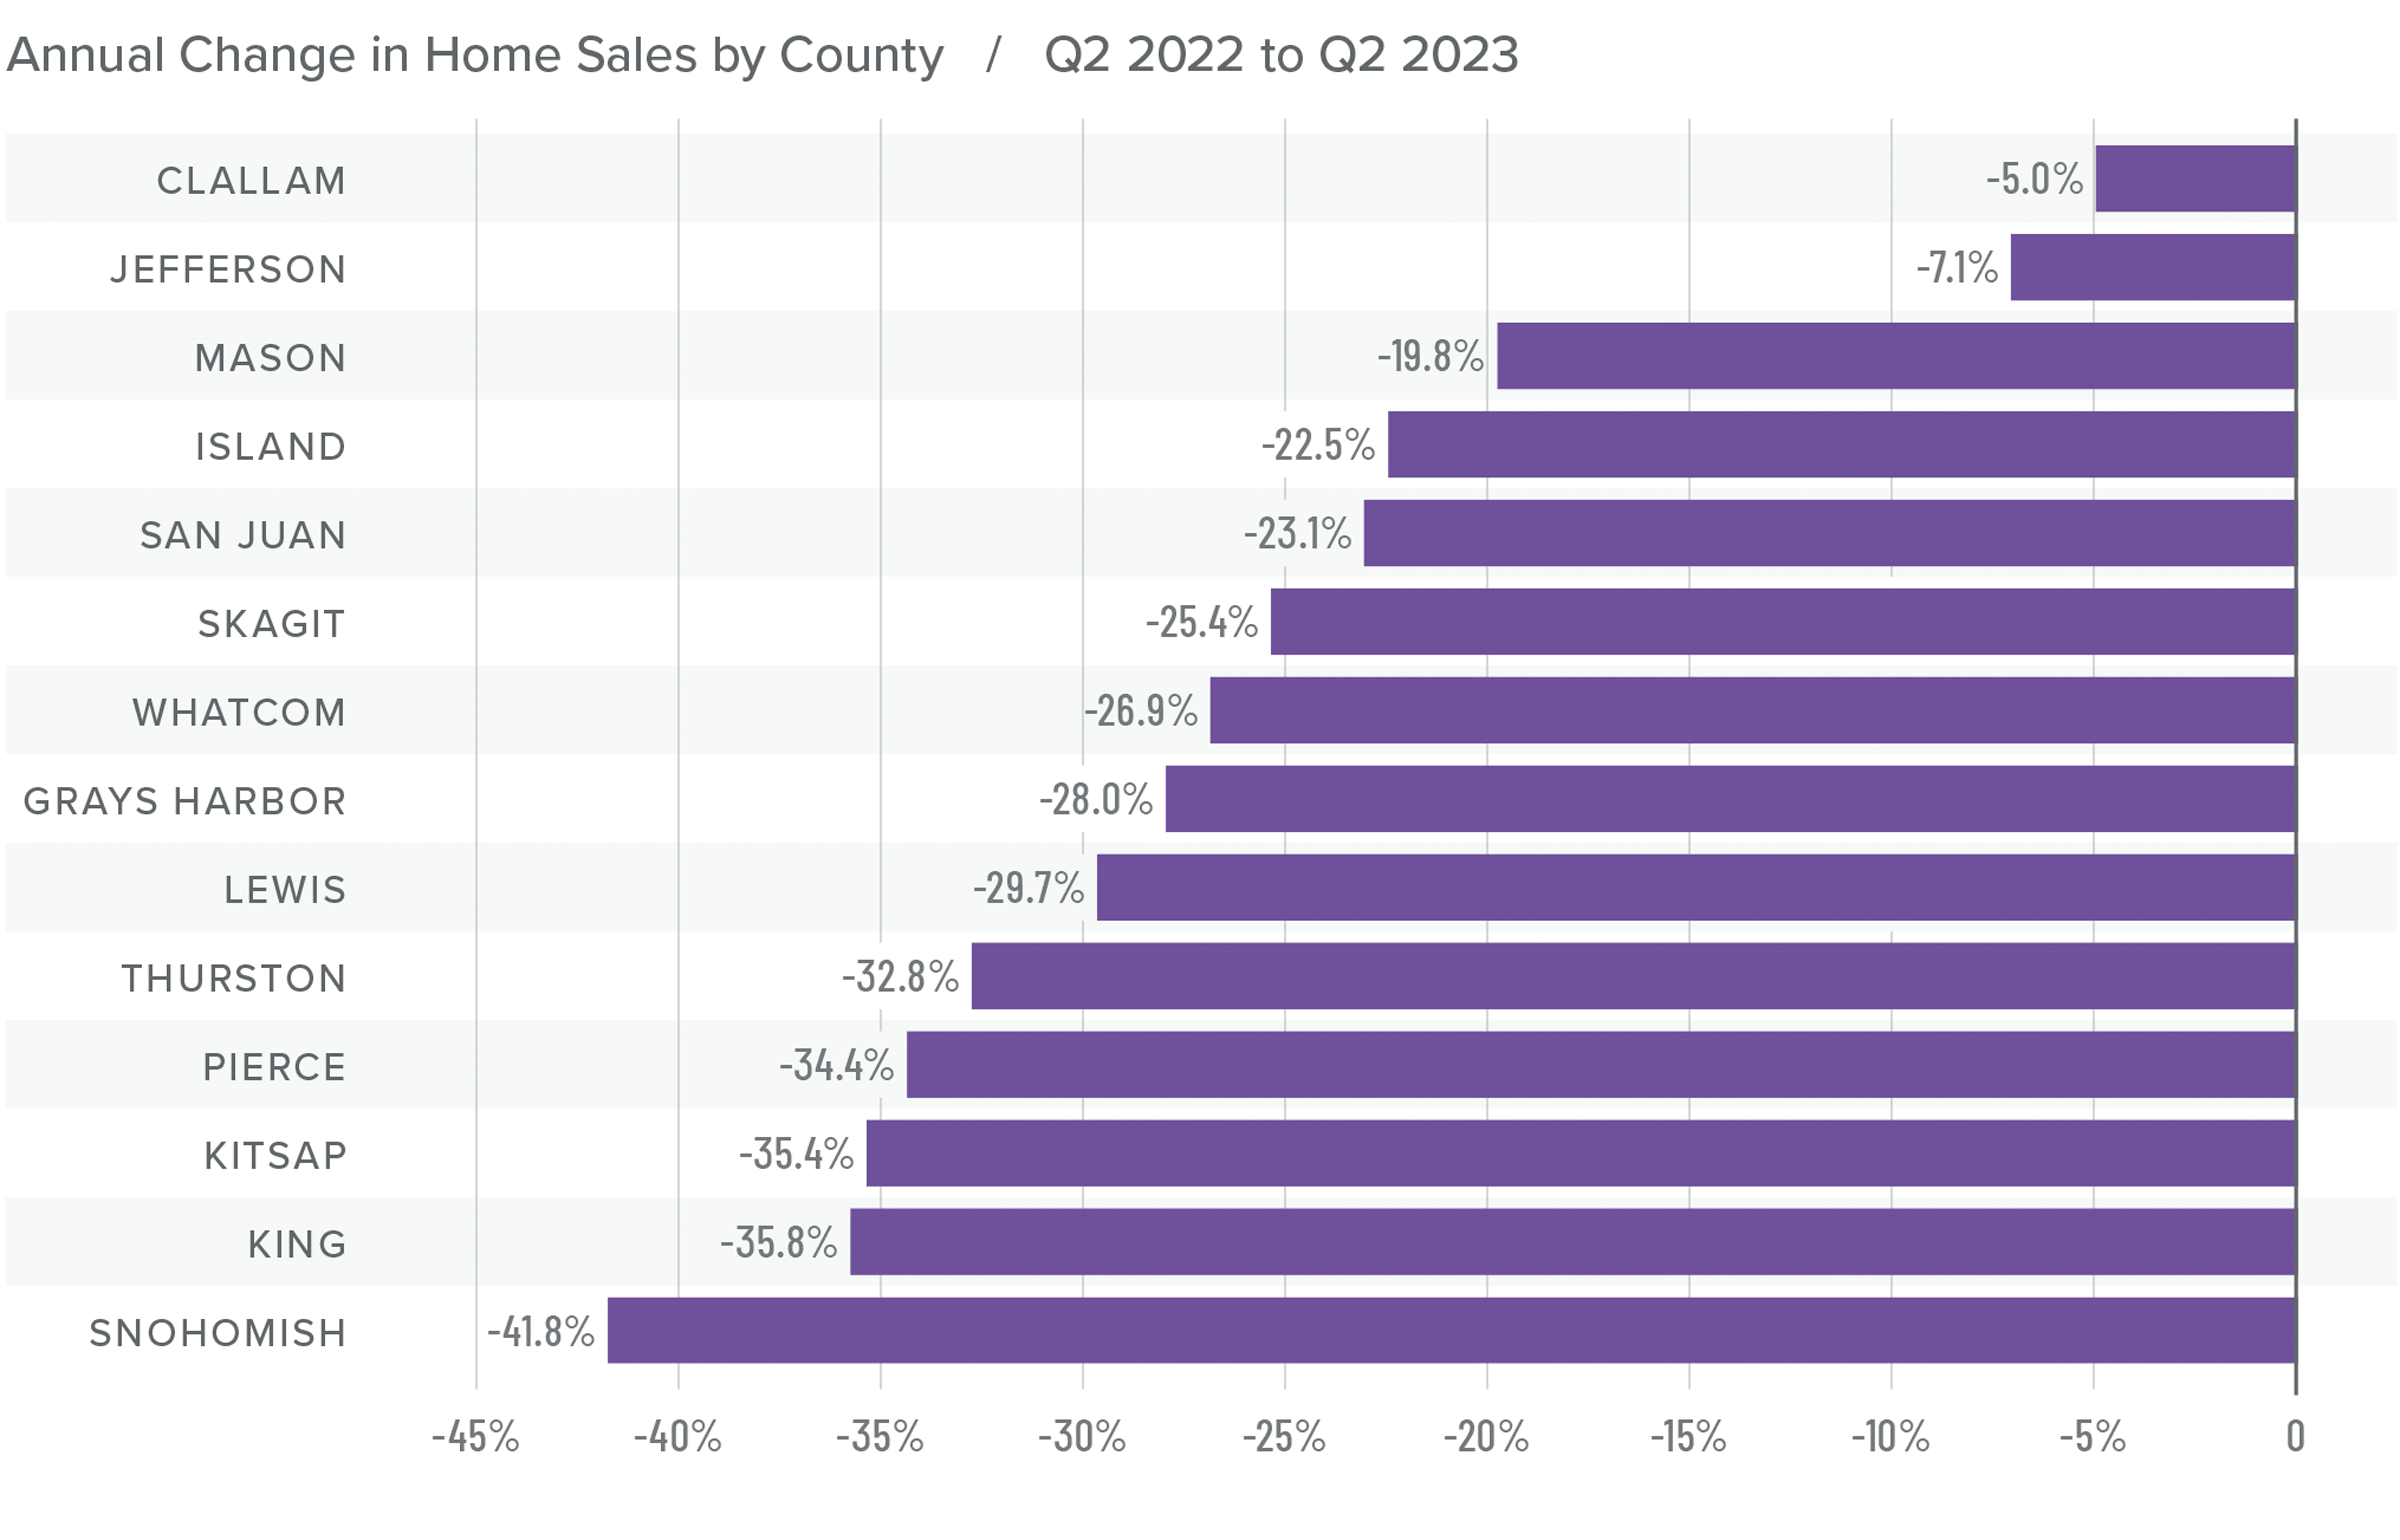
❱ In the second quarter of 2023, 14,997 homes sold. This was down 34.4% from the second quarter of 2022, but up 43.8% from the first quarter of 2023.
❱ The growth in quarter-over-quarter sales was due to the 21.7% increase in the number of homes for sale. While this is positive, it should be noted that inventory levels in the quarter were still 16% lower than a year ago.
❱ Sales fell across the board compared to the same quarter in 2022 but were up in all markets compared to the first quarter of 2023.
❱ Pending sales rose in all counties compared to the first quarter of this year, suggesting that sales in the upcoming quarter may show further improvement.
Western Washington Home Prices
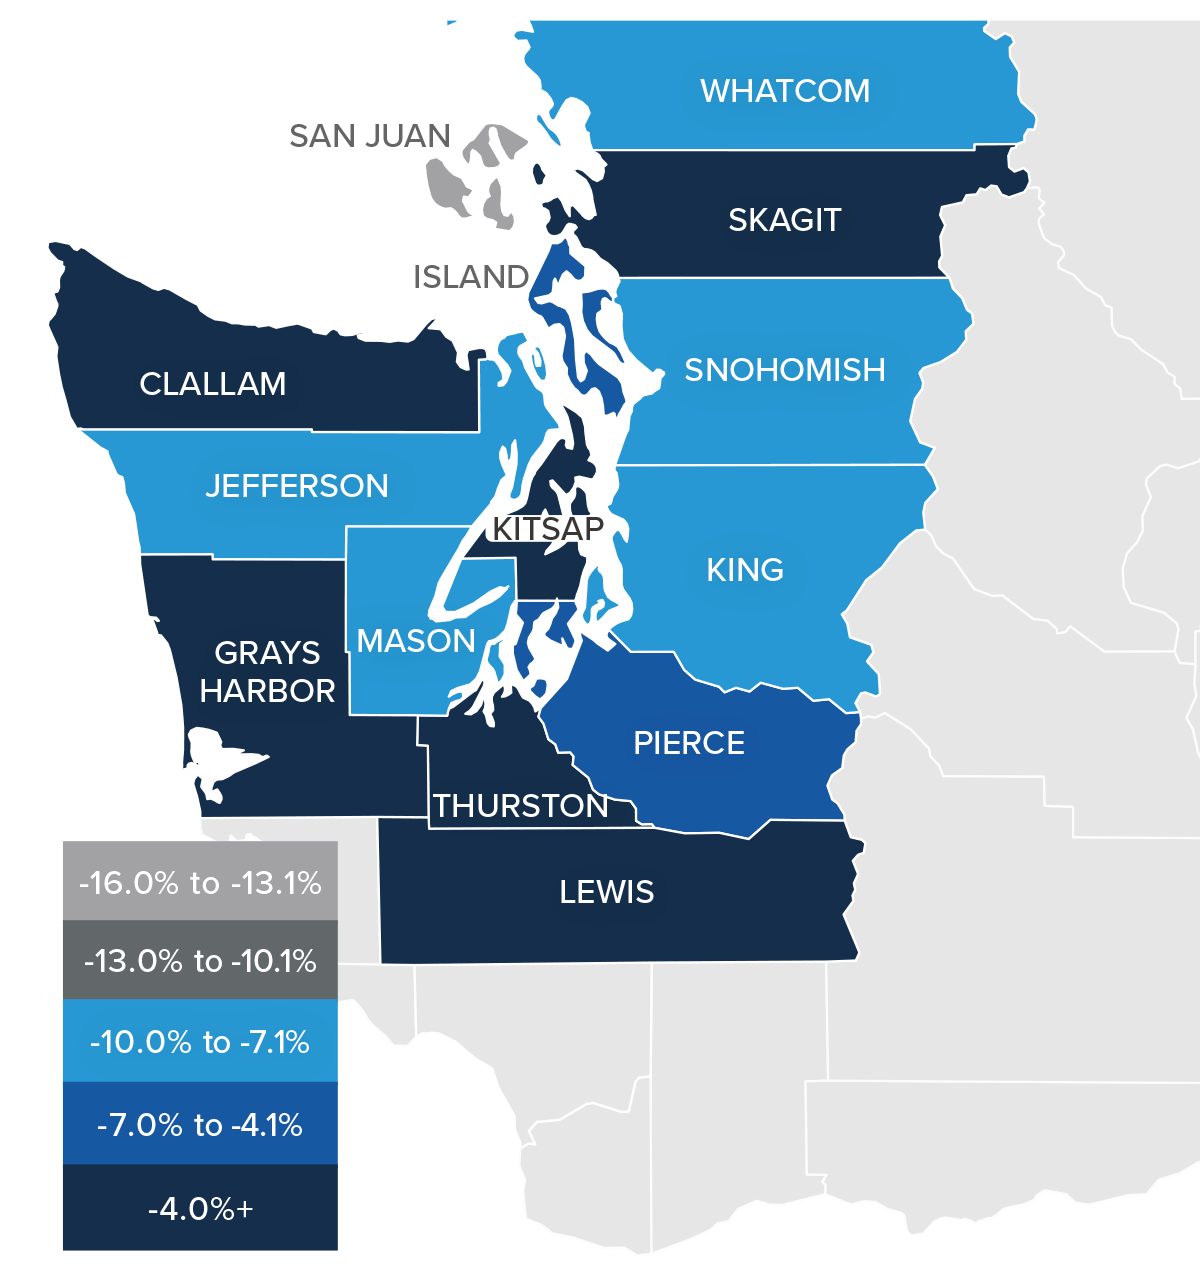
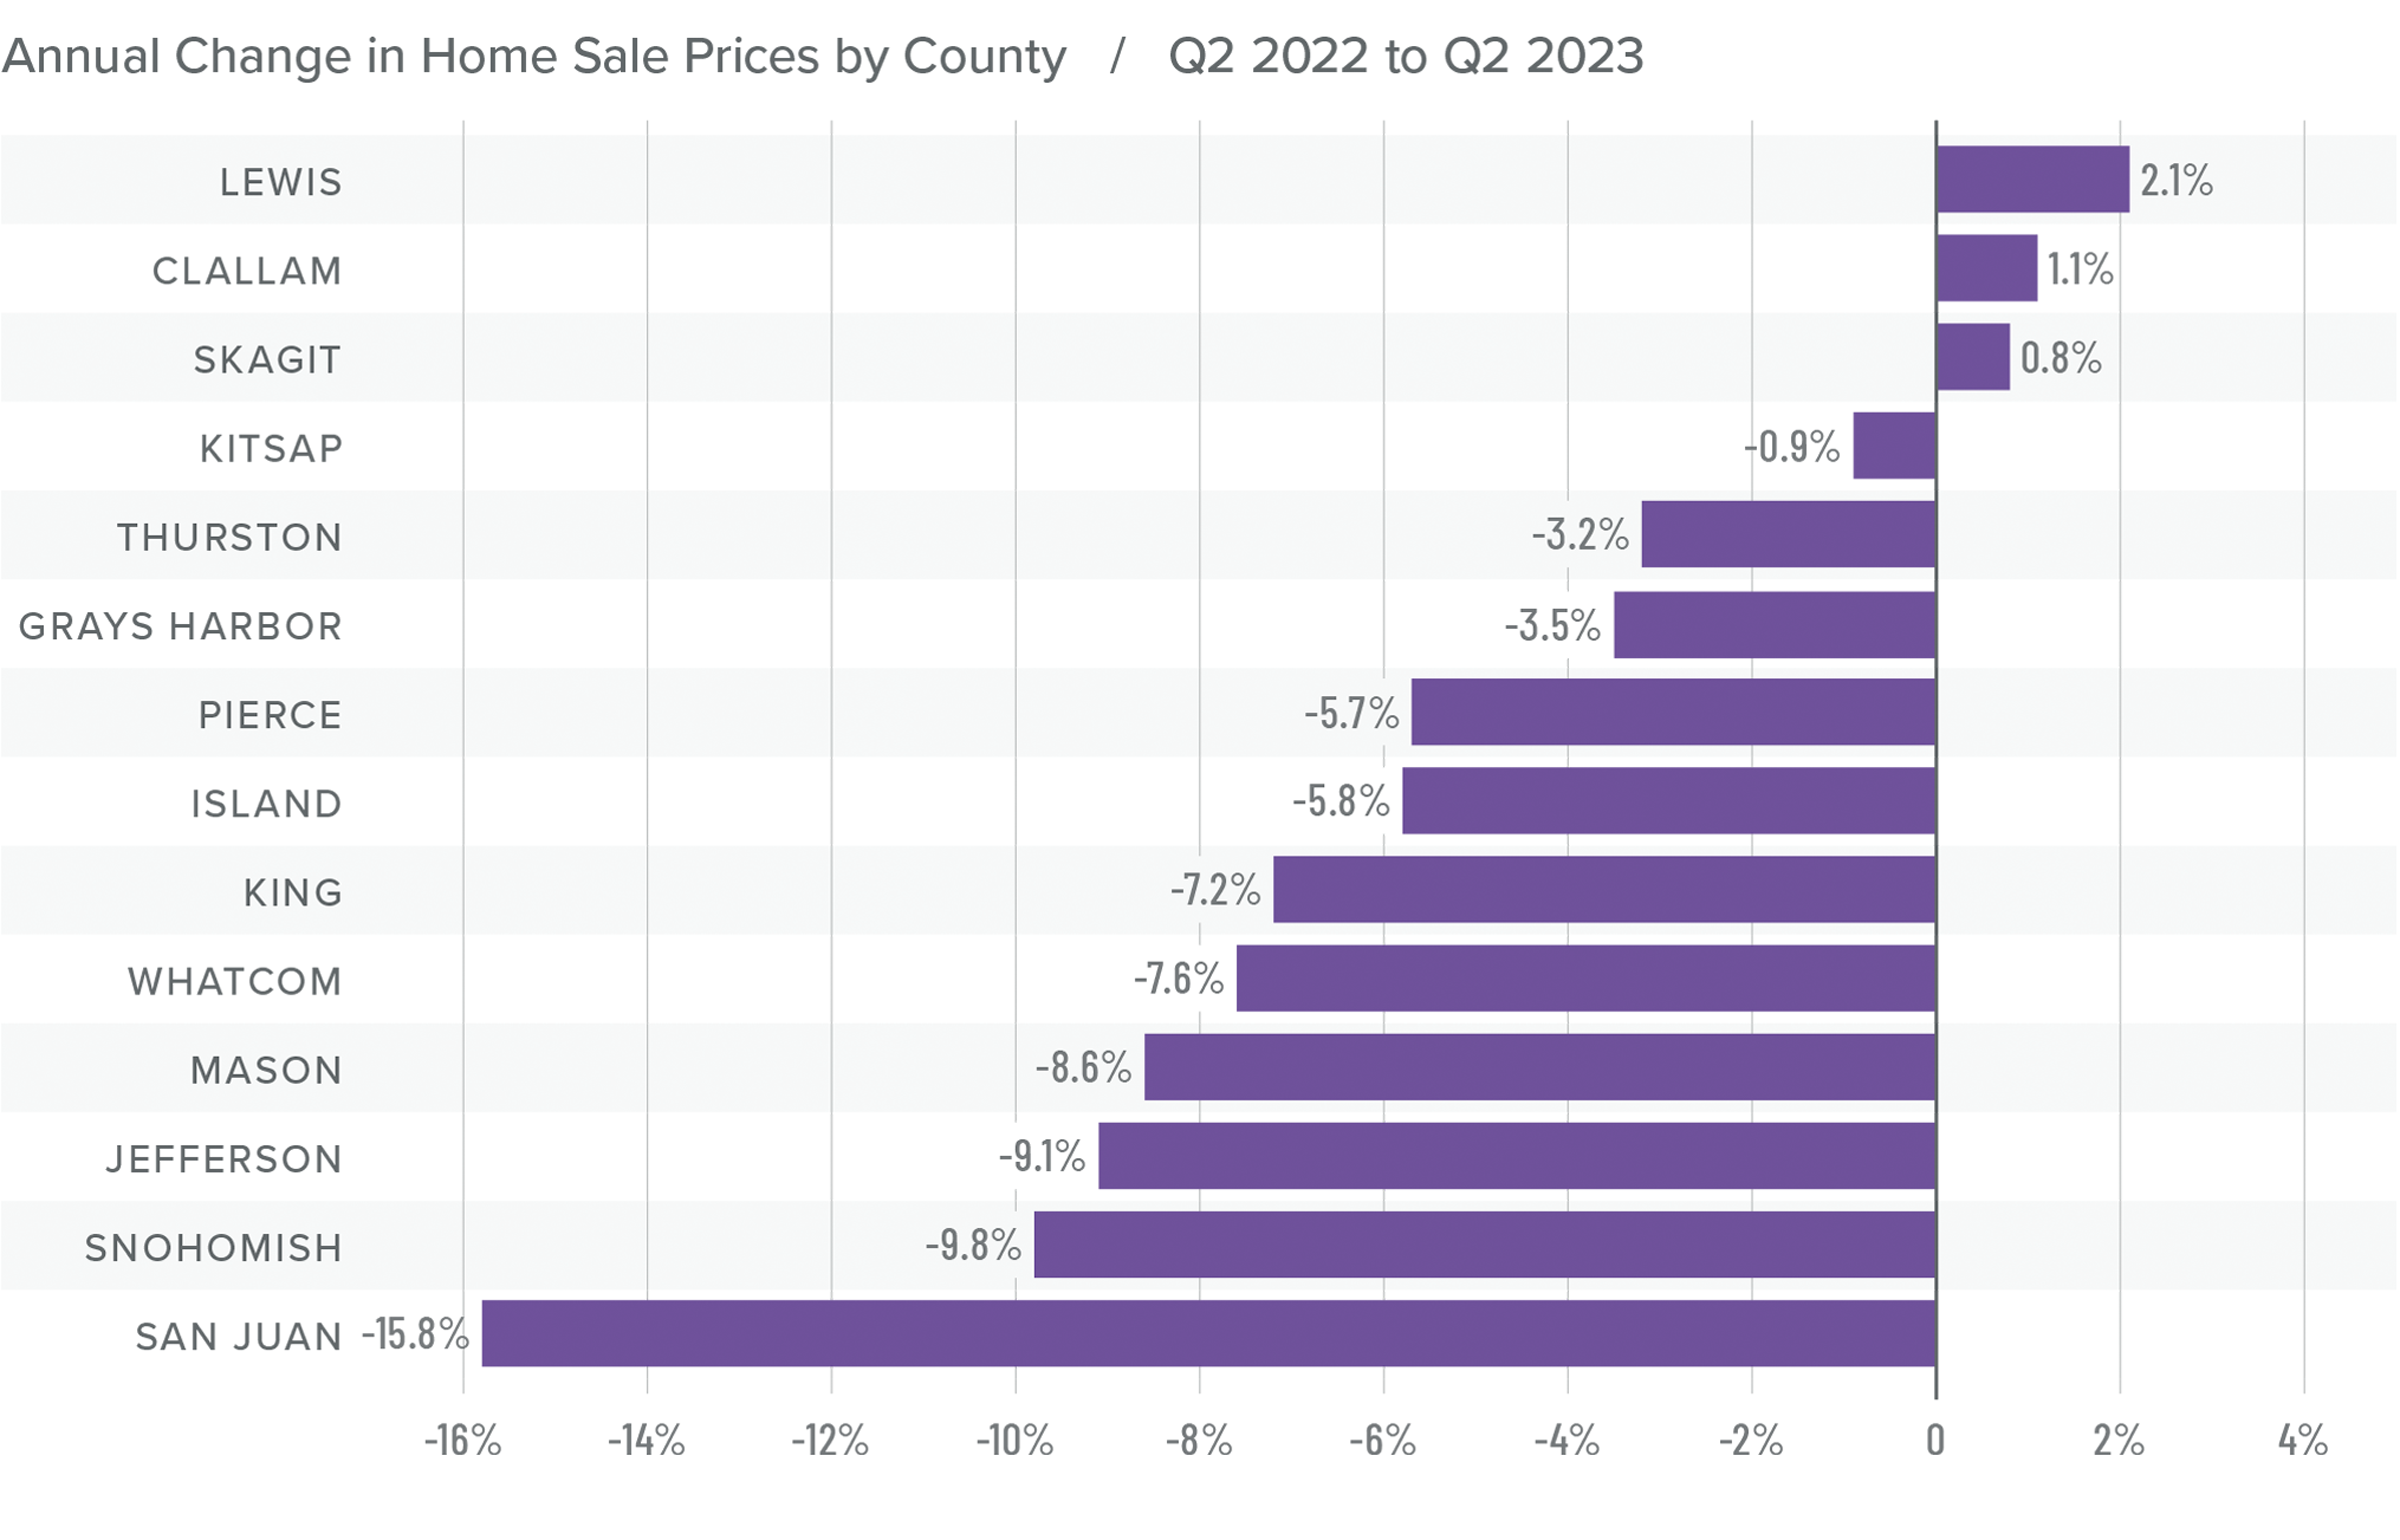
❱ Sale prices fell an average of 7.6% compared to the second quarter of 2022 but were 11.7% higher than in the first quarter of this year. The average home sale price was $773,343.
❱ Compared to the first quarter of this year, sale prices were higher in all counties except San Juan, which, as a small island county, is notorious for its extreme price swings.
❱ The year-over-year drop in sale prices was not a surprise given that the market was peaking due to rapidly rising mortgage rates. That said, prices in Lewis, Clallam, and Skagit counties exceeded those of a year ago.
❱ It was interesting to see list prices rising in all markets compared to the first quarter of the year. Even though inventory levels have risen, sellers still believe that they are in the driver’s seat.
Mortgage Rates
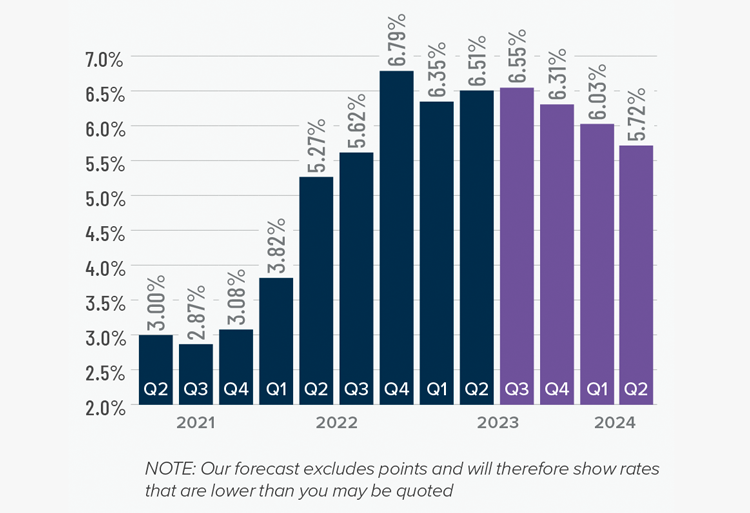
Although they were less erratic than the first quarter, mortgage rates unfortunately trended higher and ended the quarter above 7%. This was due to the short debt ceiling impasse, as well as several economic datasets that suggested the U.S. economy was not slowing at the speed required by the Federal Reserve.
While the June employment report showed fewer jobs created than earlier in the year, as well as downward revisions to prior gains, inflation has not sufficiently slowed. Until it does, rates cannot start to trend consistently lower. With the economy not slowing as fast as expected, I have adjusted my forecast: Rates will hold at current levels in third quarter and then start to trend lower through the fall. Although there are sure to be occasional spikes, my model now shows the 30-year fixed rate breaking below 6% next spring.
Western Washington Days on Market
❱ It took an average of 35 days for homes to sell in the second quarter. This was 20 more days than in the same quarter of 2022, but 21 fewer days compared to the first quarter of this year.
❱ Snohomish County became the tightest market in Western Washington, with homes taking an average of only 18 days to sell. Homes for sale in San Juan County took the longest time to sell at 81 days.
❱ All counties contained in this report saw average days on market rise from the same period in 2022. Market time fell across the board compared to the prior quarter.
❱ The greatest fall in days on market compared to the first quarter was in Clallam County, where market time fell 31 days. Also of note were Pierce, Thurston, and Whatcom counties, where market time fell 25 days.

Conclusions
This speedometer reflects the state of the region’s real estate market using housing inventory, price gains, home sales, interest rates, and larger economic factors.
The increase in listing activity, while pleasing, still leaves the market short of inventory. Even with mortgage rates well above levels we’ve seen over the past few years, demand for homes still exceeds supply. Given that over 86% of homeowners with mortgages have an interest rate below 5% and more than a quarter have a rate at or below 3%, I see little incentive for them to sell if they don’t have to. This tells me that supply levels are unlikely to improve enough to meet demand until rates drop significantly.
With this supply-demand imbalance, it’s no surprise that prices are rising again following the decline in the second half of 2022. I expect prices to rise modestly as we move through the second half of 2023. Rising list and sale prices, shorter time on market, and higher pending and closed sales all offset higher mortgage rates. Given these factors, I have moved the needle in favor of sellers.
About Matthew Gardner

As Chief Economist for Windermere Real Estate, Matthew Gardner is responsible for analyzing and interpreting economic data and its impact on the real estate market on both a local and national level. Matthew has over 30 years of professional experience both in the U.S. and U.K.
In addition to his day-to-day responsibilities, Matthew sits on the Washington State Governors Council of Economic Advisors; chairs the Board of Trustees at the Washington Center for Real Estate Research at the University of Washington; and is an Advisory Board Member at the Runstad Center for Real Estate Studies at the University of Washington where he also lectures in real estate economics.
Q1 2023 Western Washington Real Estate Market Update

The following analysis of select counties of the Western Washington real estate market is provided by Windermere Real Estate Chief Economist Matthew Gardner. We hope that this information may assist you with making better-informed real estate decisions. For further information about the housing market in your area, please don’t hesitate to contact your Windermere Real Estate agent.
Regional Economic Overview
The pace of employment growth in Western Washington continues to slow. The region added only 90,340 new jobs over the past 12 months. That said, the annual pace of employment growth was a respectable 3.6%. Three counties have not recovered completely from their pandemic job losses: Whatcom, Skagit, and Snohomish. However they are short by just under 10,000 jobs, which should be recovered by this fall. Regionally, the unemployment rate in February was 4.1%, which was marginally above the 3.8% level of a year ago. The employment outlook has improved modestly, with the likelihood of a recession in 2023 down to about 50%. That said, I expect the pace of job growth to continue to slow as businesses remain concerned about a contraction in consumer spending, as well as facing tighter credit conditions following recent bank failures.
Western Washington Home Sales
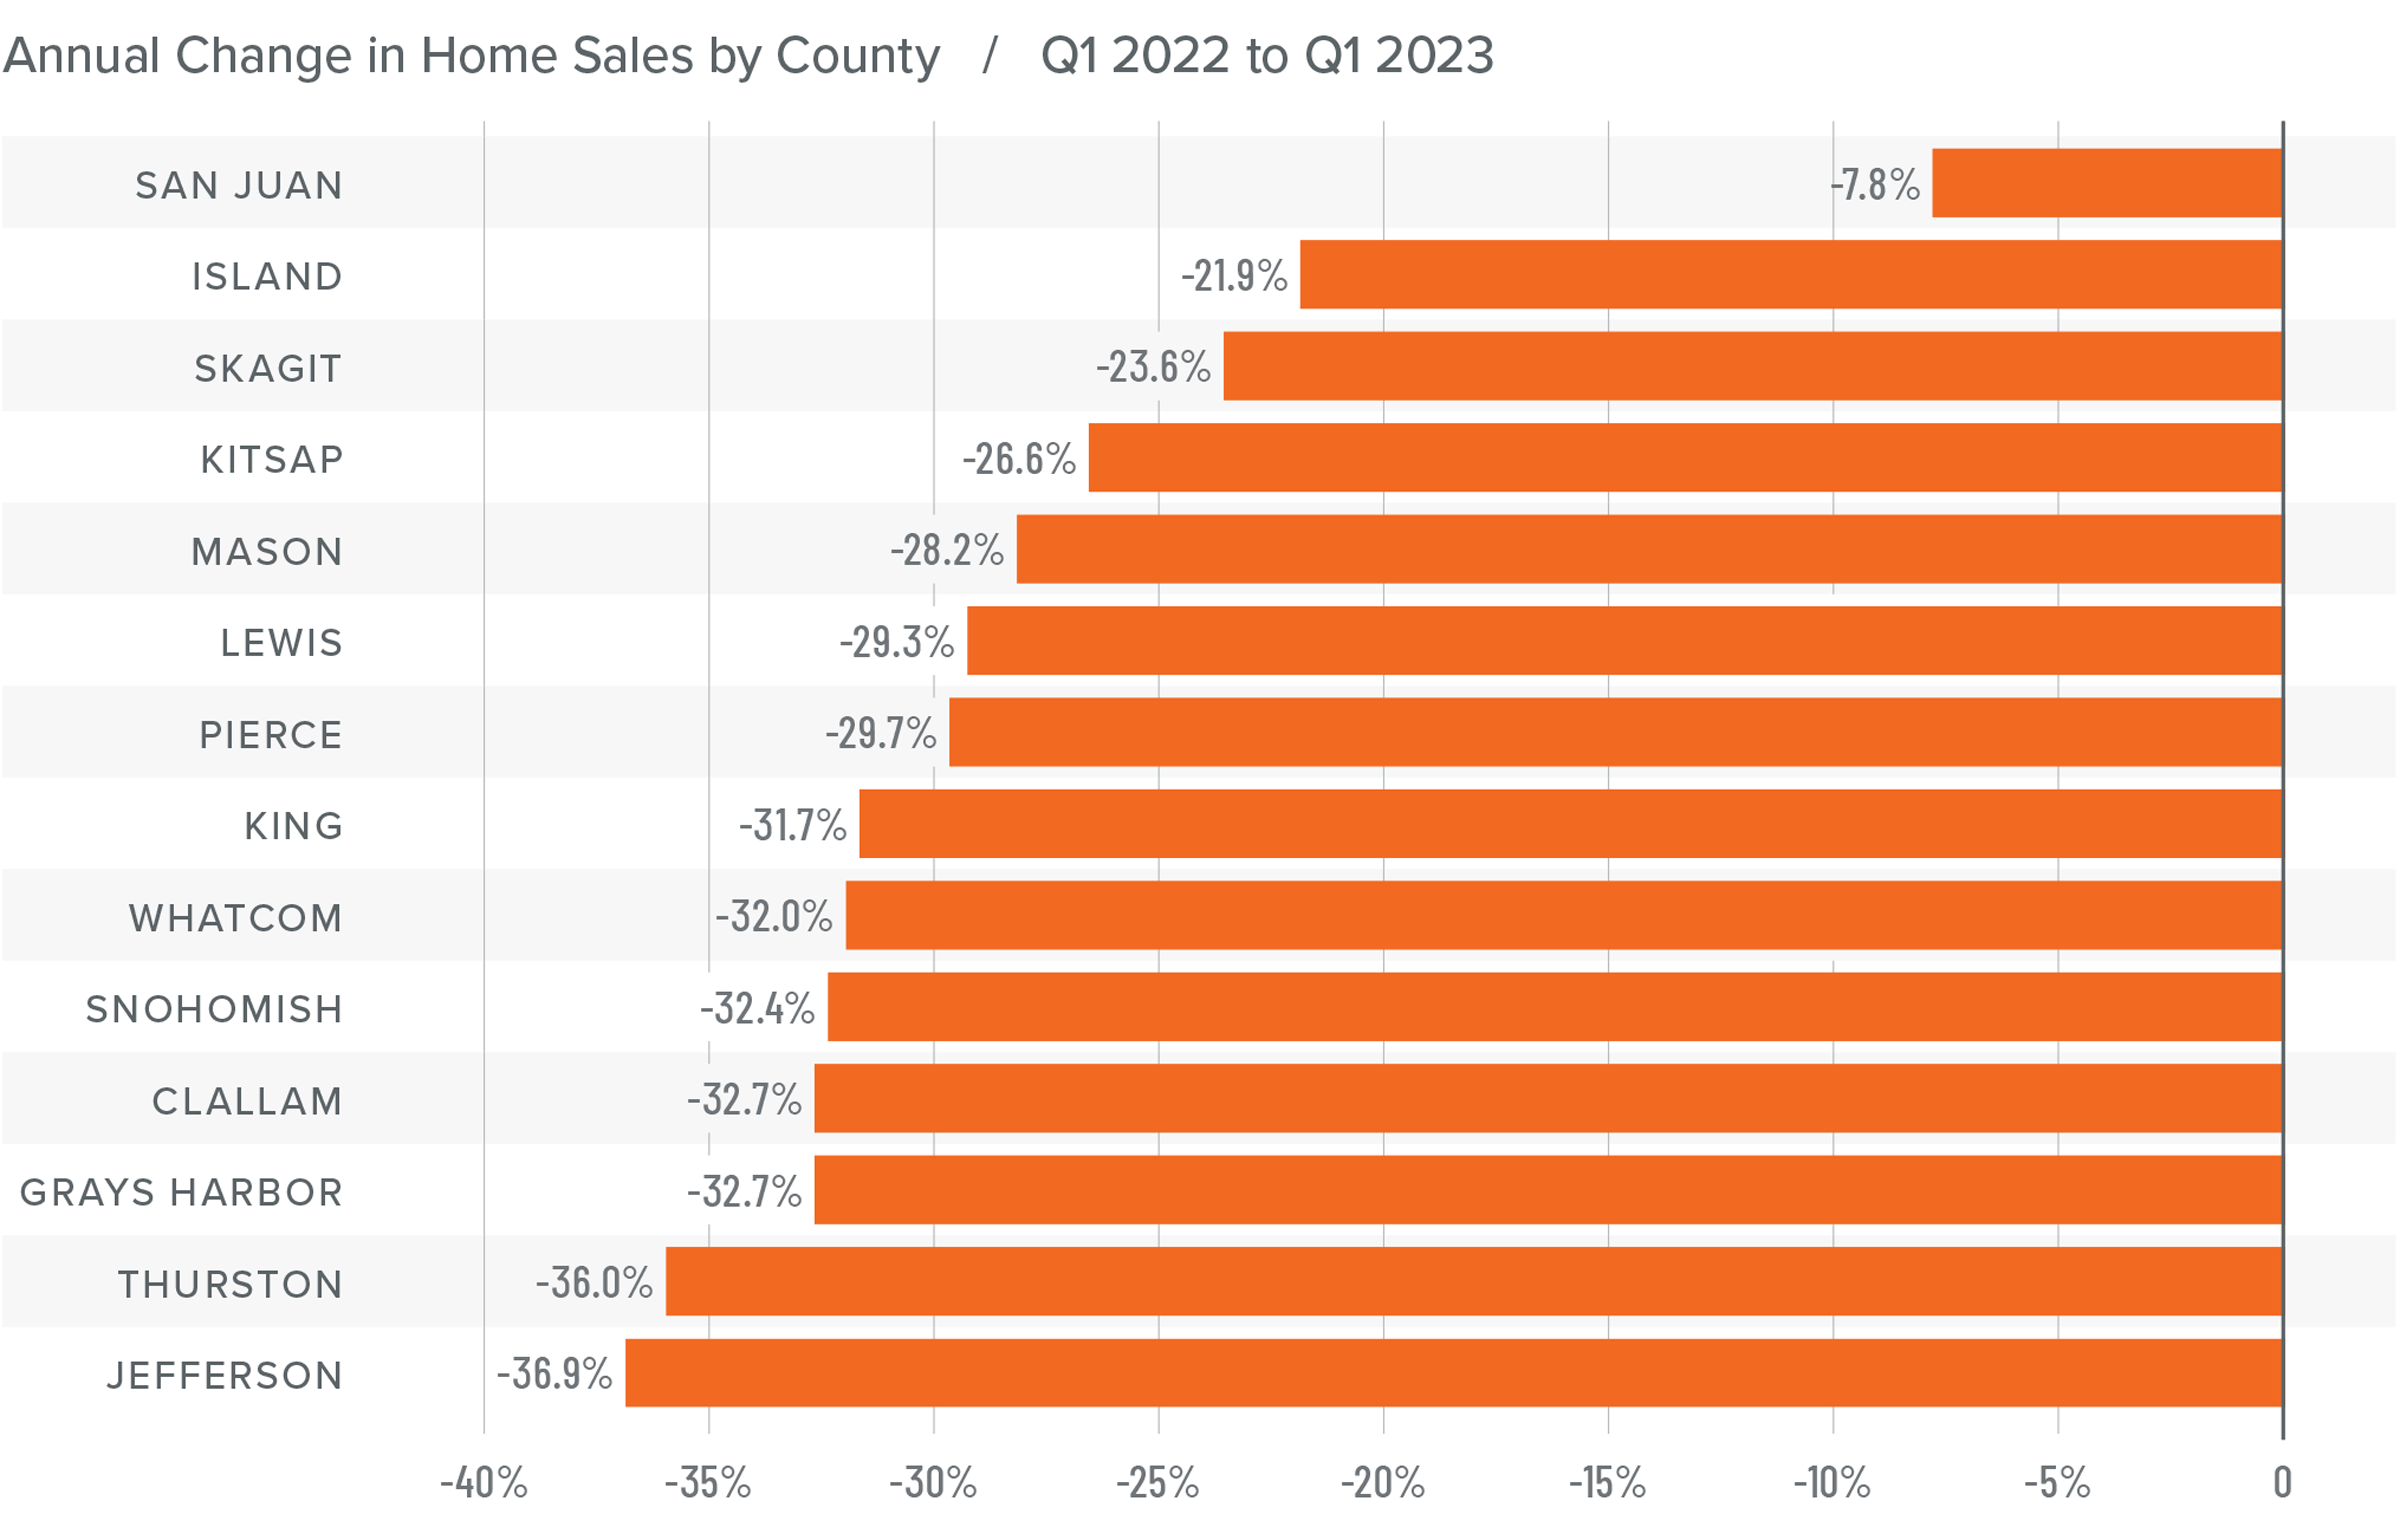
❱ In the first quarter of the year, 10,335 homes sold. This was down 30.9% from the same period in 2022 and 18.9% lower than in the fourth quarter of 2022.
❱ Lower sales activity was more a function of the limited number of homes for sale than anything else. Listing activity in the first quarter of 2023 was down 43% from the final quarter of 2022.
❱ Home sales fell across the board compared to the same quarter of last year and were lower in every county compared to the final quarter of 2022.
❱ Pending sales rose in all but three counties compared to the fourth quarter of 2022. This suggests that sales in the second quarter of the year may tick higher. That said, the region is in dire need of more inventory.
Western Washington Home Prices
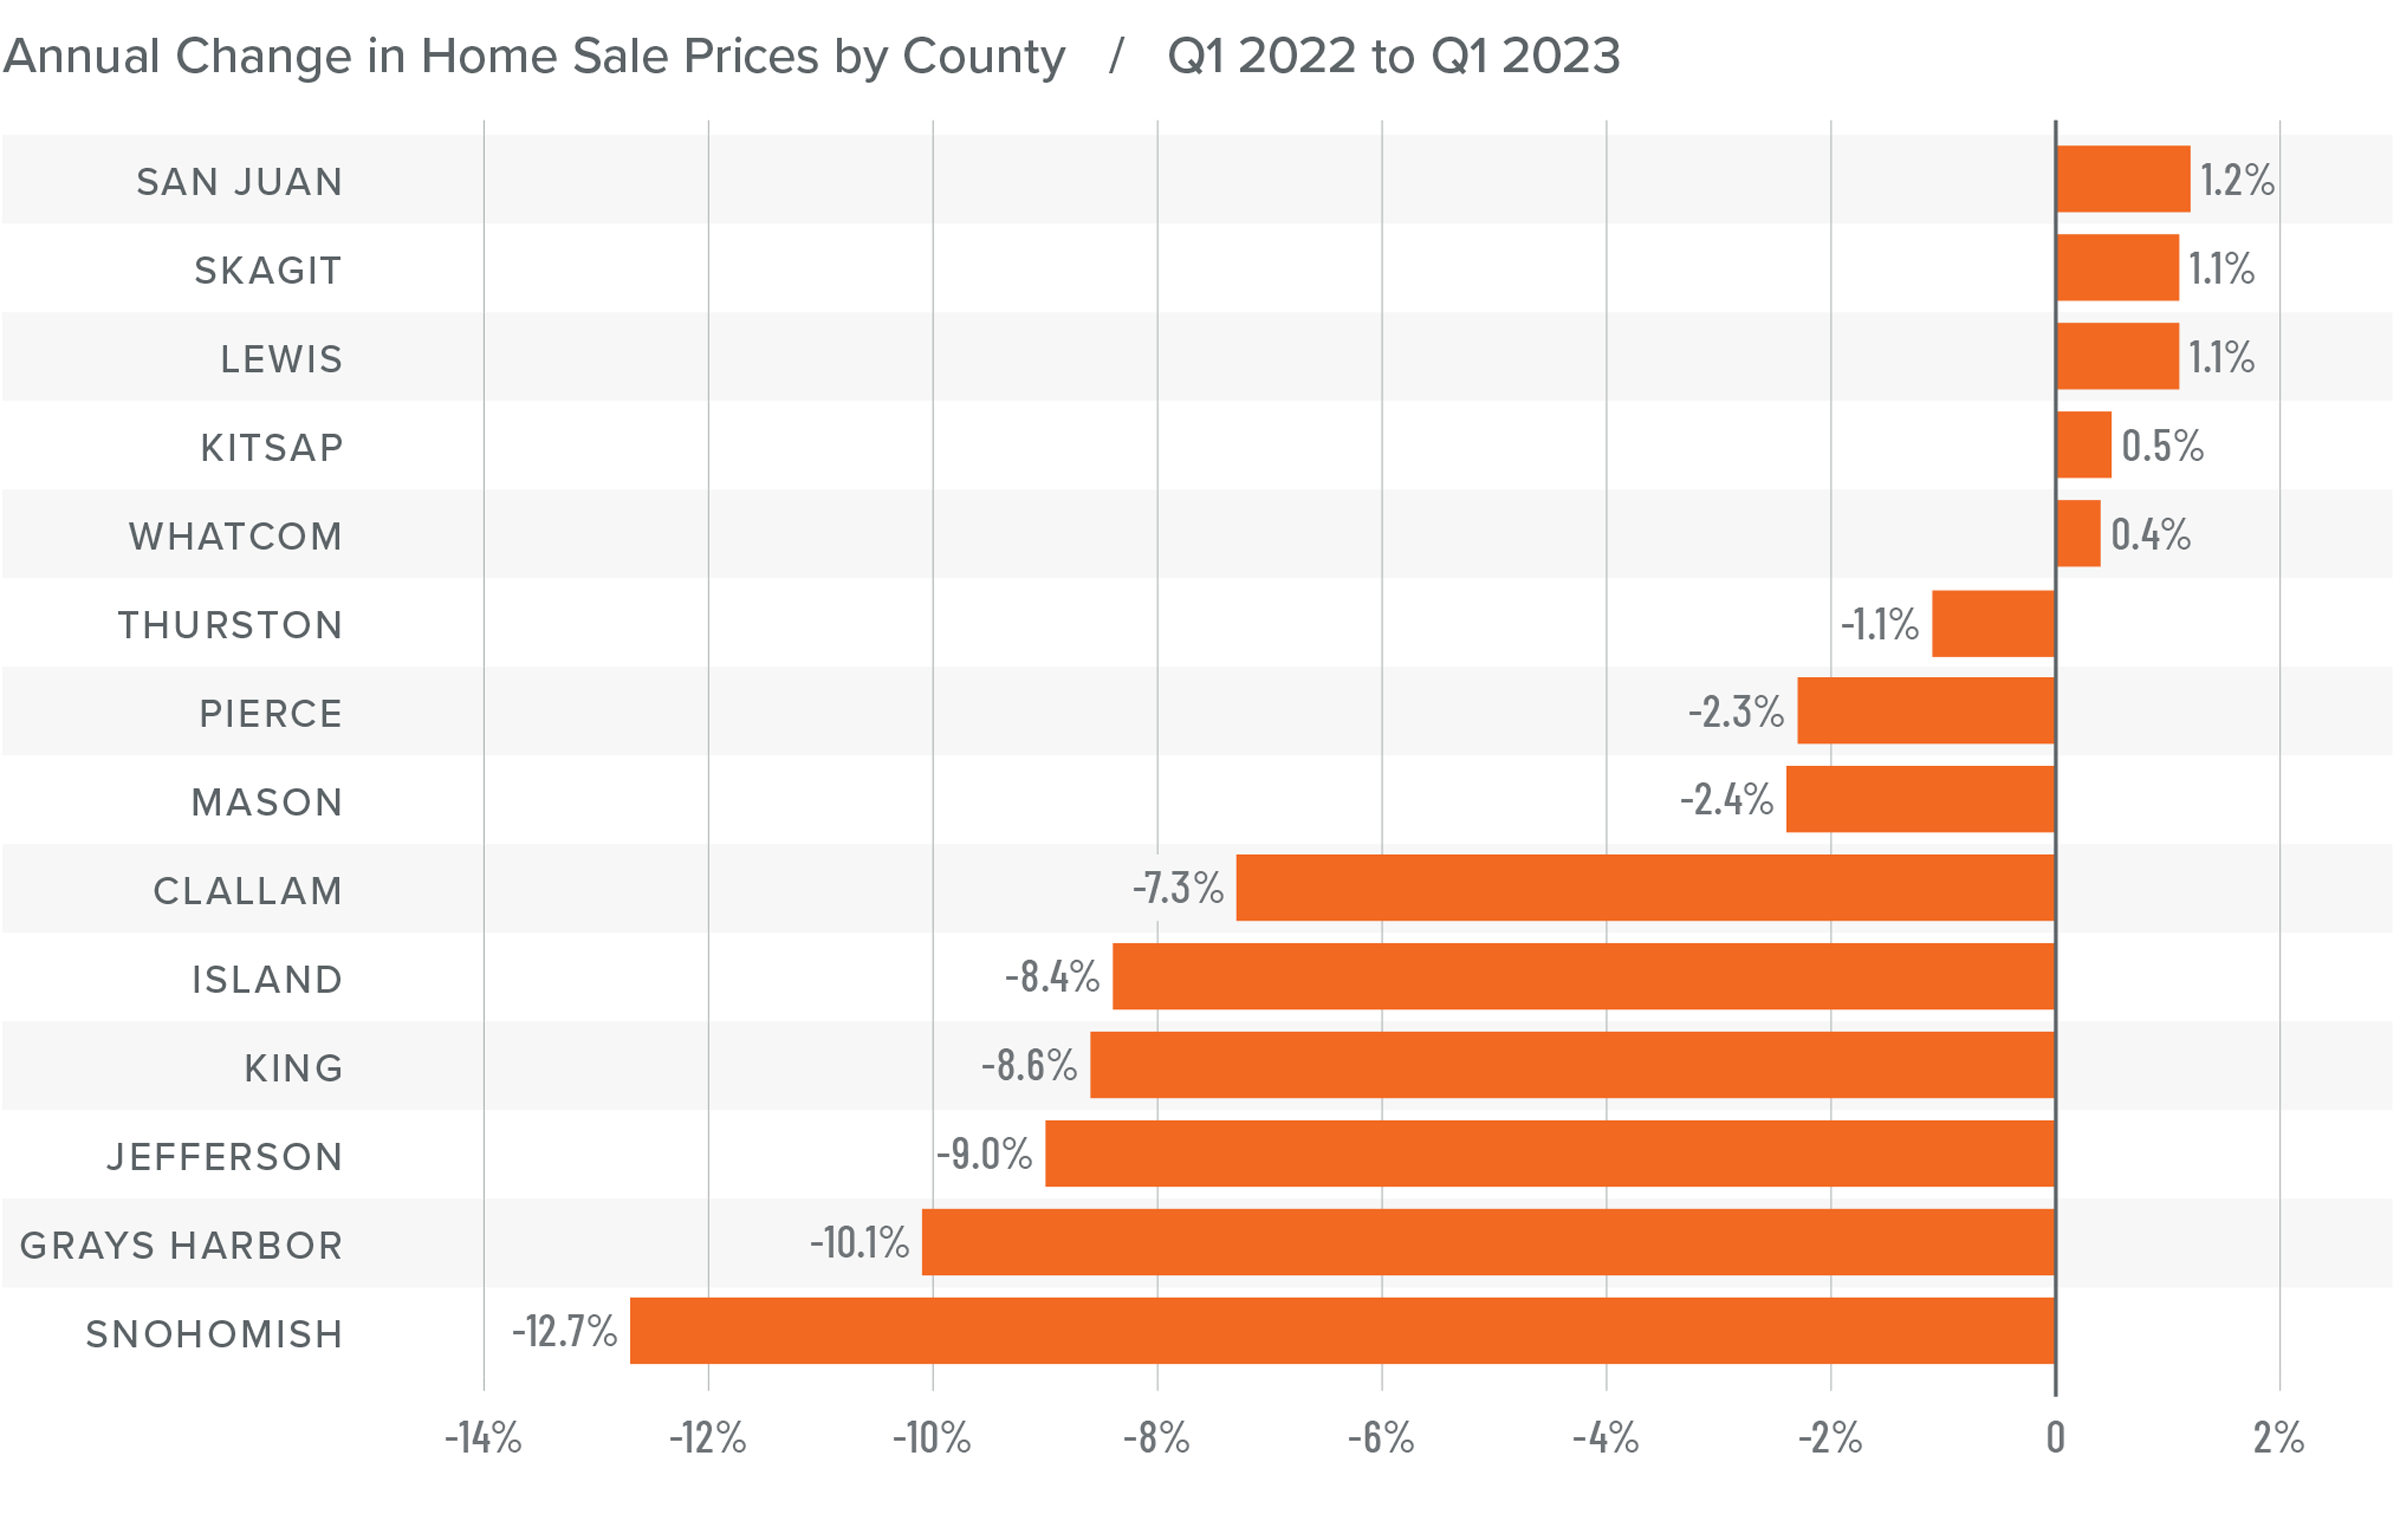
❱ Home prices fell an average of 6.9% compared to the first quarter of 2022 and were 1.3% lower than in the fourth quarter of 2022. The average home sale price in the first quarter of 2023 was $692,866.
❱ Compared to the fourth quarter of 2022, prices were higher in Kitsap, Skagit, Lewis, San Juan, and Whatcom counties.
❱ Even though prices fell in the region, five counties saw sale prices rise very modestly from the first quarter of 2023.
❱ It’s worth noting that median listing prices rose in all but two markets compared to the previous quarter. This suggests that sellers are getting a little more comfortable with the market. If listing prices continue to rise, one can surmise that home prices will follow suit.

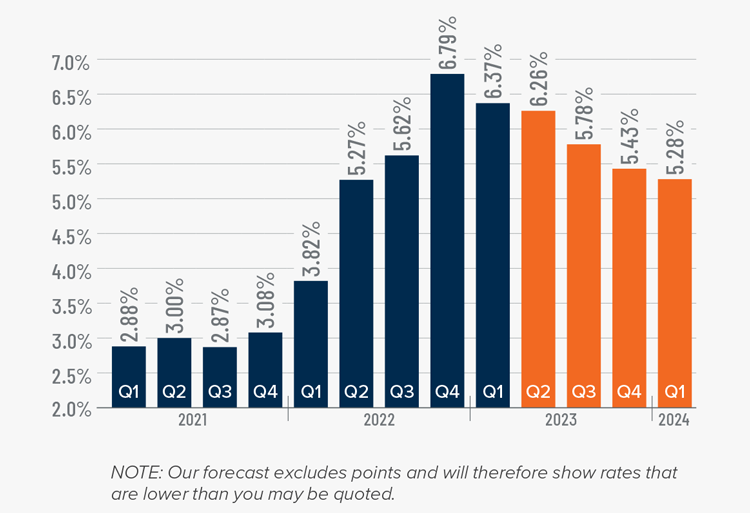
Mortgage Rates
Rates in the first quarter of 2023 were far less volatile than last year, even with the brief but significant impact of early March’s banking crisis. It appears that buyers are jumping in when rates dip, which was the case in mid-January and again in early February.
Even with the March Consumer Price Index report showing inflation slowing, I still expect the Federal Reserve to raise short-term rates one more time following their May meeting before pausing rate increases. This should be the catalyst that allows mortgage rates to start trending lower at a more consistent pace than we have seen so far this year. My current forecast is that rates will continue to move lower with occasional spikes, and that they will hold below 6% in the second half of this year.
Western Washington Days on Market
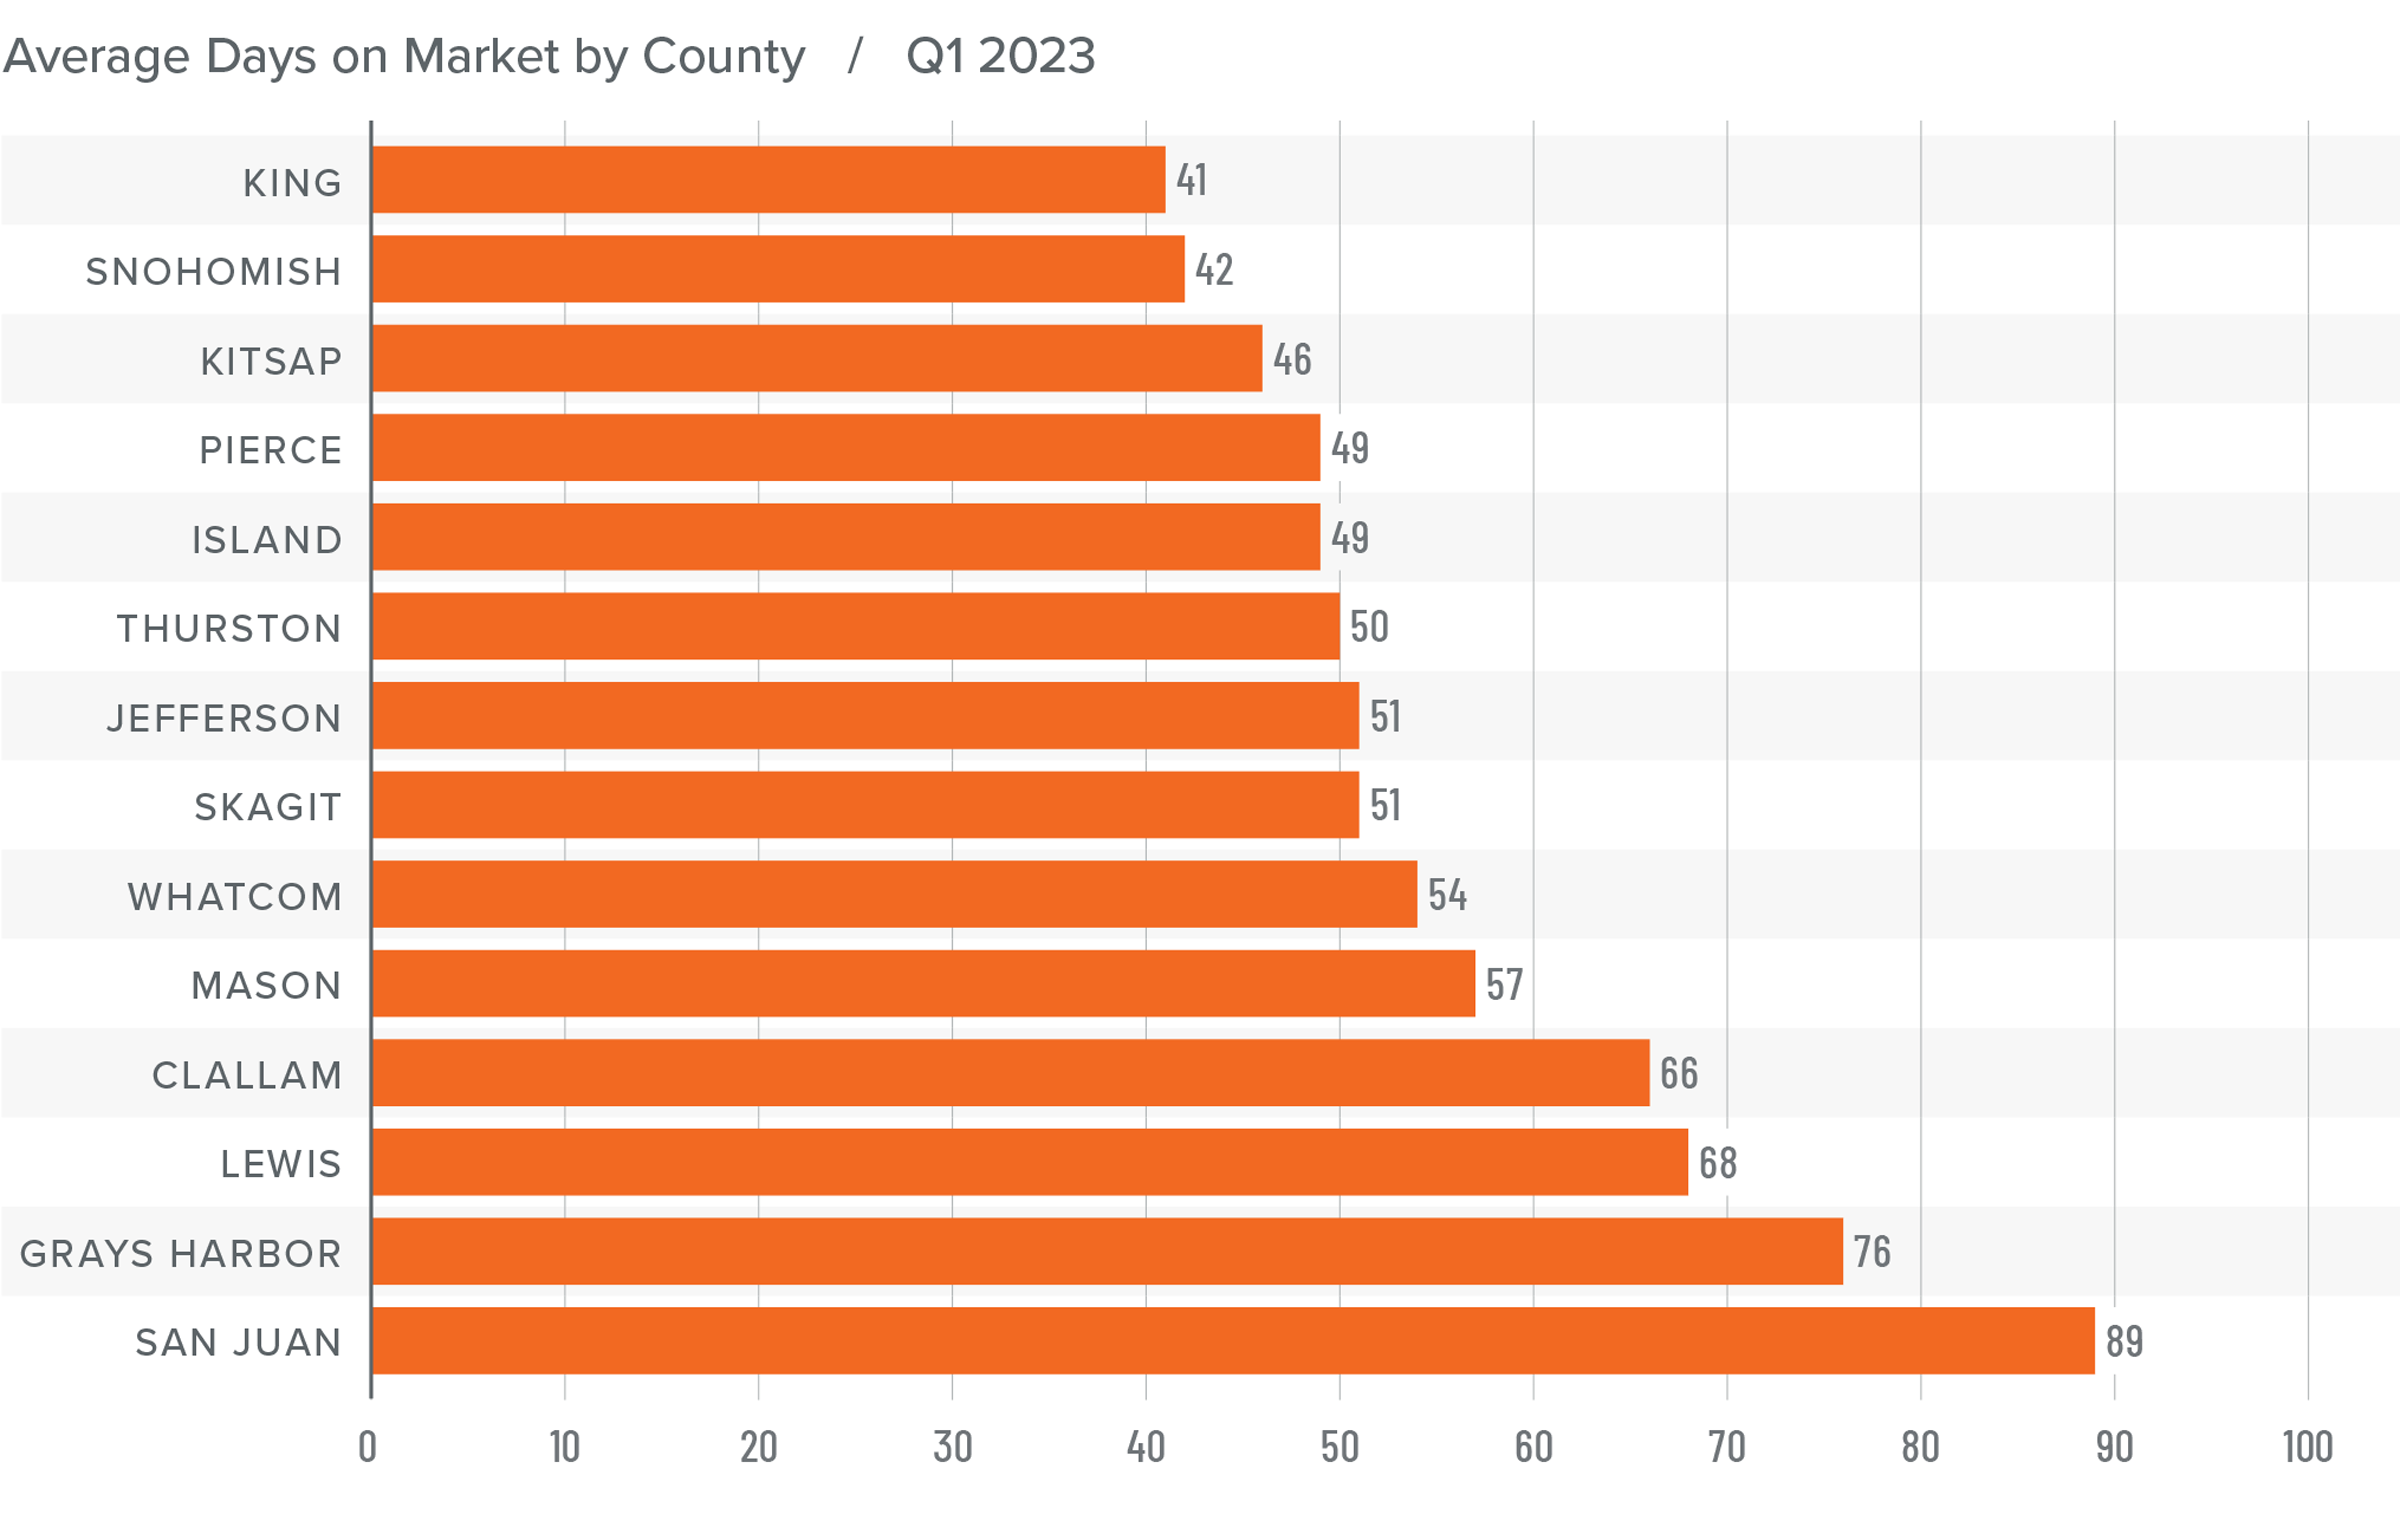
❱ It took an average of 56 days for a home to sell in the first quarter of this year. This was 32 more days than in the same quarter of 2022 and 16 days more than in the fourth quarter of last year.
❱ King County remains the tightest market in Western Washington, with homes taking an average of 41 days to sell. Homes in San Juan County took the longest time to sell.
❱ Market time rose in all counties contained in this report compared to the same period in 2022 and compared to the fourth quarter.
❱ The greatest increase in market time compared to a year ago was in Grays Harbor County, where it took an average of 41 more days for homes to sell. Grays Harbor County also saw the greatest increase in market time compared to the final quarter of 2022 (from 46 to 76 days).
Conclusions
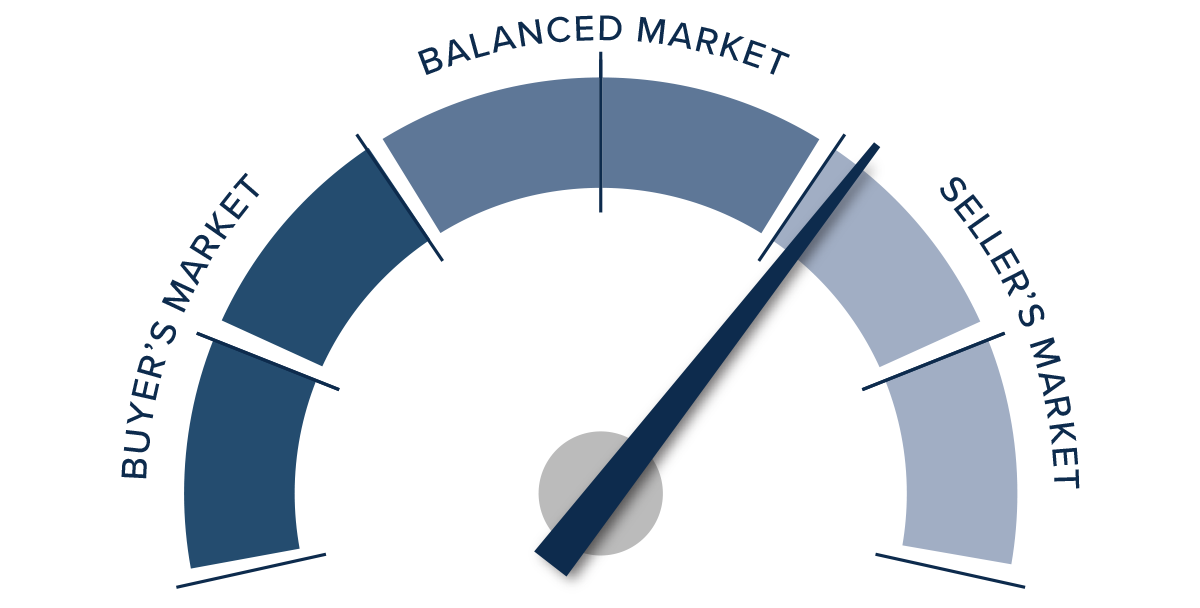
This speedometer reflects the state of the region’s real estate market using housing inventory, price gains, home sales, interest rates, and larger economic factors.
Although the regional economy is still expanding, it continues to show signs of slowing. With the probability of a national recession this year now fifty-fifty, I do not see any reason for buyers to lose confidence in their housing decisions based purely on economic factors. Sellers appear to be a little more confident in the market as demonstrated by rising listing prices. Periods of lower mortgage rates and the lack of homes for sale are both likely contributors to this. Whatever the case may be, I am not seeing any signs of panic in the market.

Even in the face of higher financing costs, low inventory levels support home values, and the data suggests that the worst of the price declines are now behind us. The region had fewer sales, modestly lower prices, and higher average days on market, all of which favor home buyers. However, lower inventory levels, higher pending sales, higher listing prices, and a higher absorption rate of homes that are for sale favor sellers. As such, I am moving the needle towards a balanced market, but one that ever so slightly favors sellers.
About Matthew Gardner
As Chief Economist for Windermere Real Estate, Matthew Gardner is responsible for analyzing and interpreting economic data and its impact on the real estate market on both a local and national level. Matthew has over 30 years of professional experience both in the U.S. and U.K.
In addition to his day-to-day responsibilities, Matthew sits on the Washington State Governors Council of Economic Advisors; chairs the Board of Trustees at the Washington Center for Real Estate Research at the University of Washington; and is an Advisory Board Member at the Runstad Center for Real Estate Studies at the University of Washington where he also lectures in real estate economics.
Q4 2022 Western Washington Real Estate Market Update
The following analysis of select counties of the Western Washington real estate market is provided by Windermere Real Estate Chief Economist Matthew Gardner. We hope that this information may assist you with making better-informed real estate decisions. For further information about the housing market in your area, please don’t hesitate to contact your Windermere Real Estate agent.
Regional Economic Overview
Although the job market in Western Washington continues to grow, the pace has started to slow. The region added over 91,000 new jobs during the past year, but the 12-month growth rate is now below 100,000, a level we have not seen since the start of the post-COVID job recovery. That said, all but three counties have recovered completely from their pandemic job losses and total regional employment is up more than 52,000 jobs. The regional unemployment rate in November was 3.8%, which was marginally above the 3.7% level of a year ago. Many business owners across the country are pondering whether we are likely to enter a recession this year. As a result, it’s very possible that they will start to slow their expansion in anticipation of an economic contraction.
Western Washington Home Sales
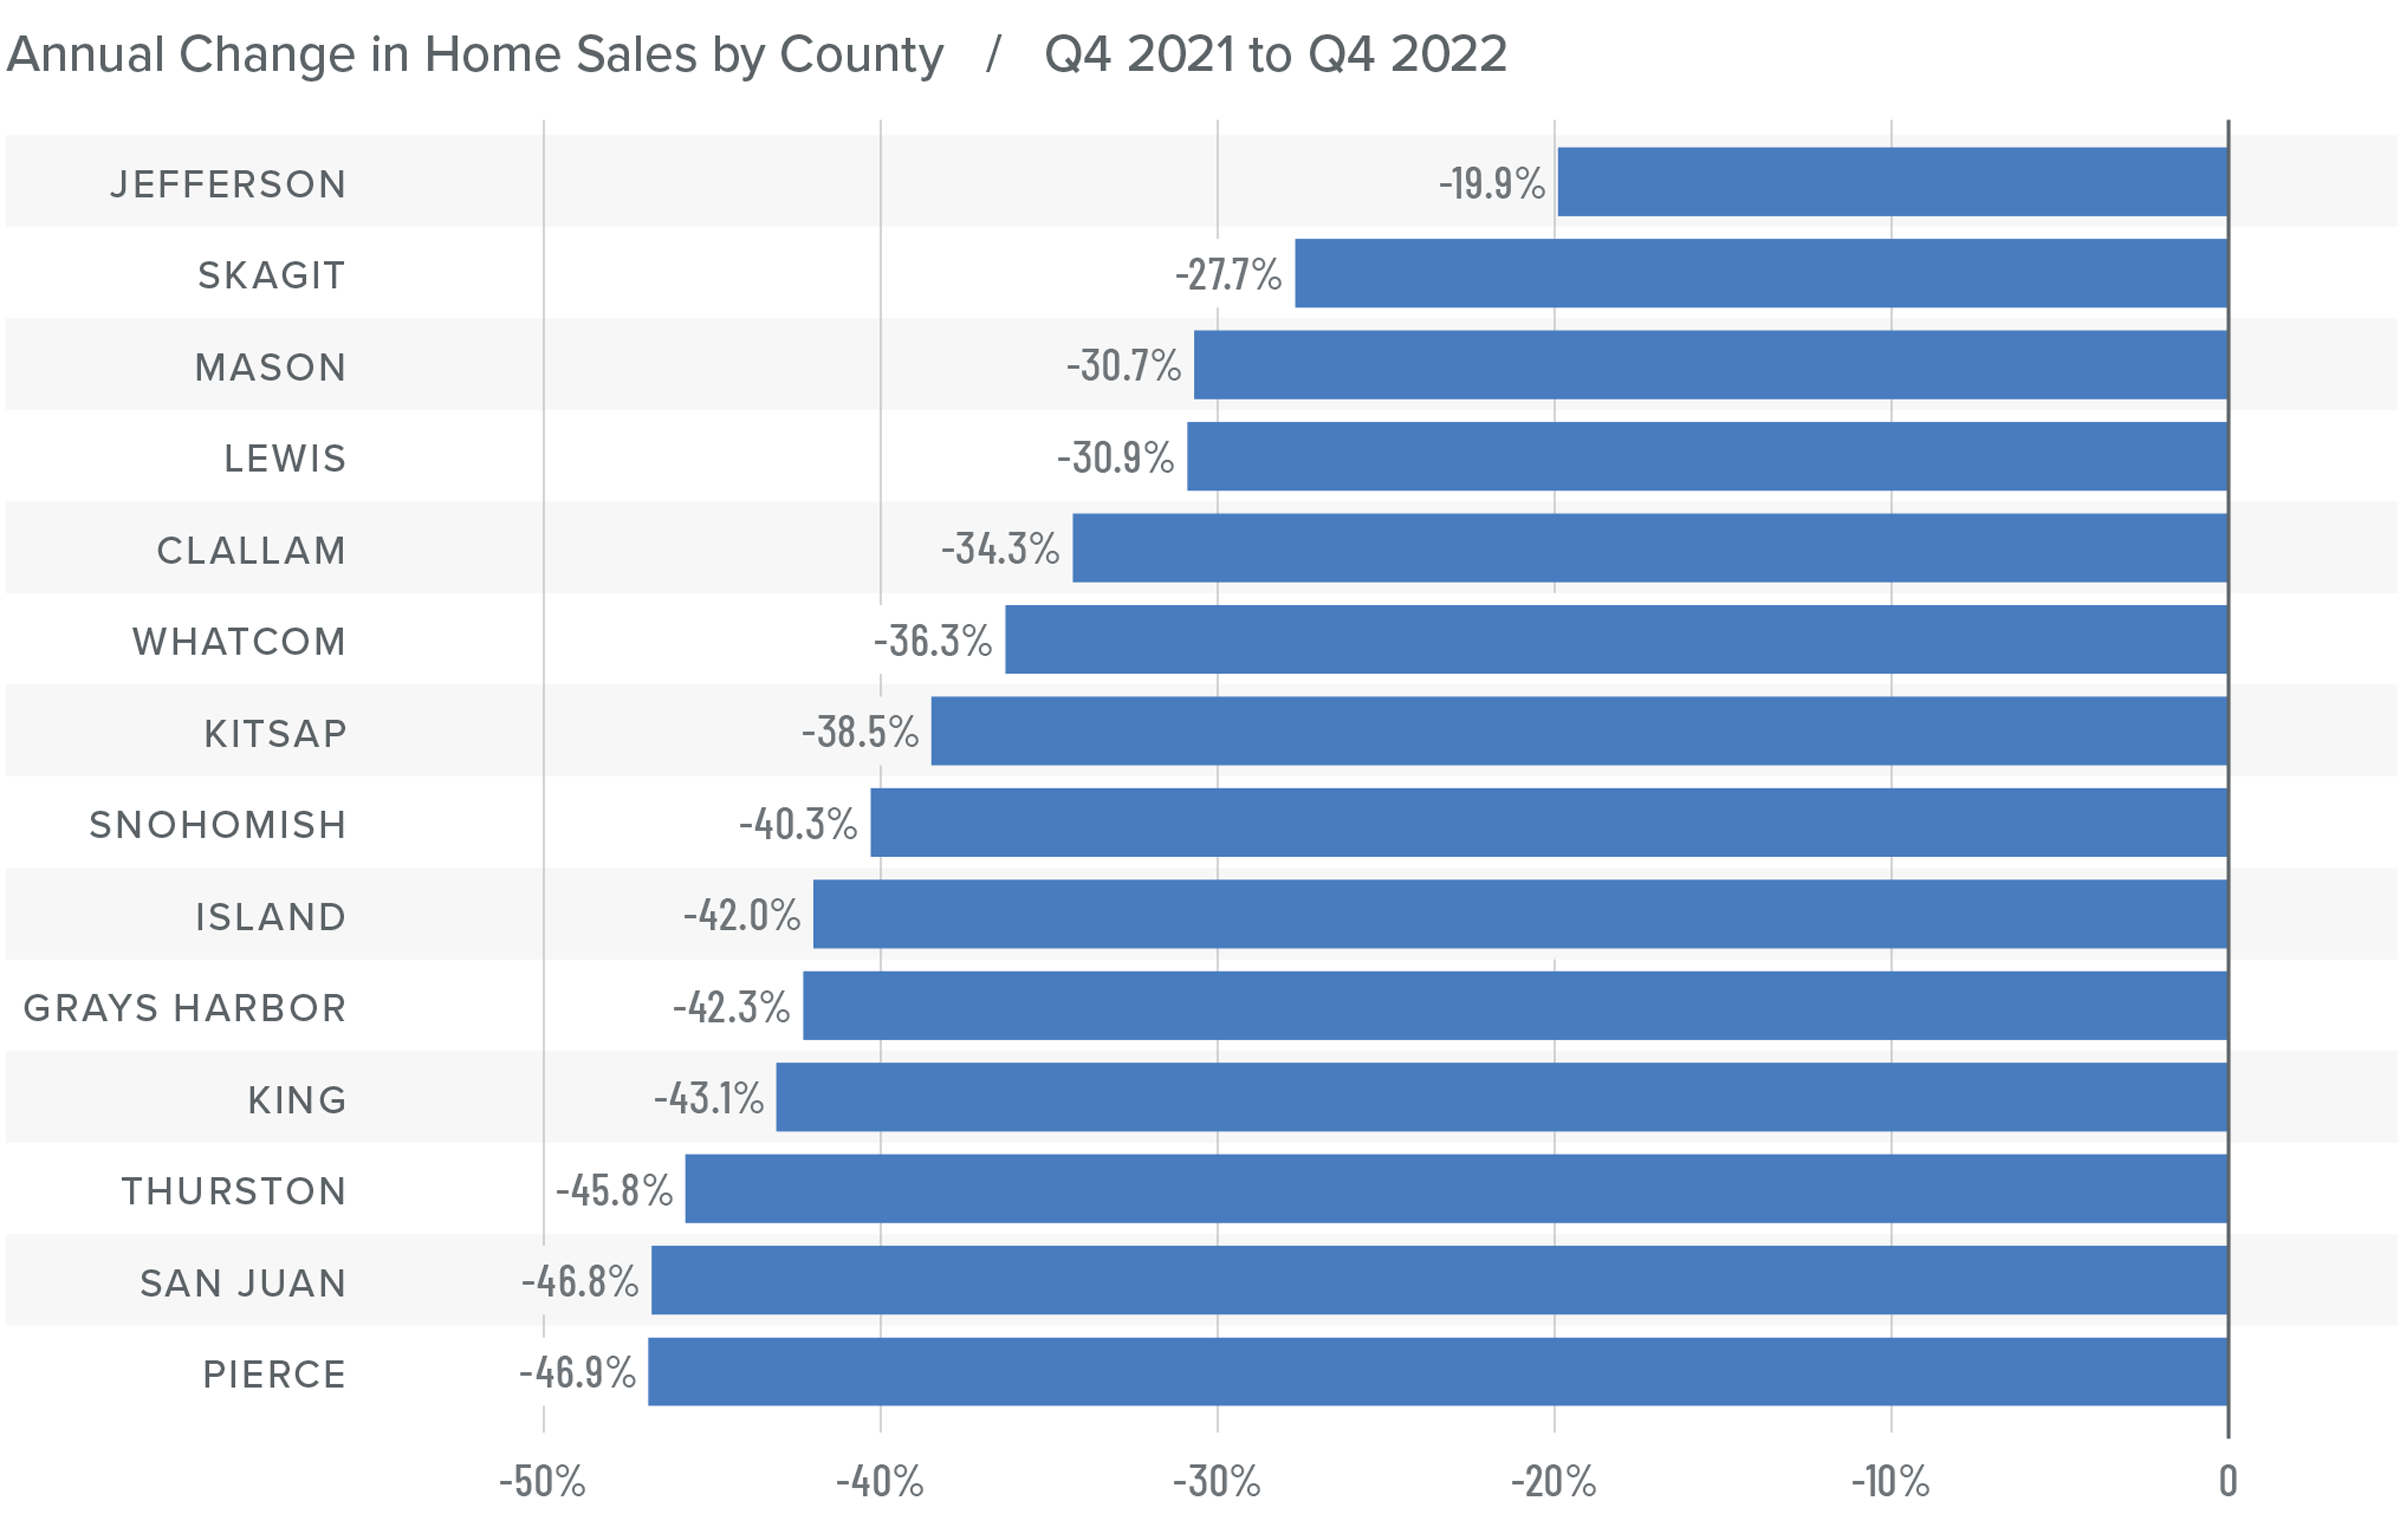
❱ In the final quarter of 2022, 12,711 homes sold, representing a drop of 42% from the same period in 2021. Sales were 34.7% lower than in the third quarter of 2022.
❱ Listing activity rose in every market year over year but fell more than 26% compared to the third quarter, which is expected given the time of year.
❱ Home sales fell across the board relative to the fourth quarter of 2021 and the third quarter of 2022.
❱ Pending sales (demand) outpaced listings (supply) by a factor of 1:2. This was down from 1:6 in the third quarter. That ratio has been trending lower for the past year, which suggests that buyers are being more cautious and may be waiting for mortgage rates to drop.
Western Washington Home Prices
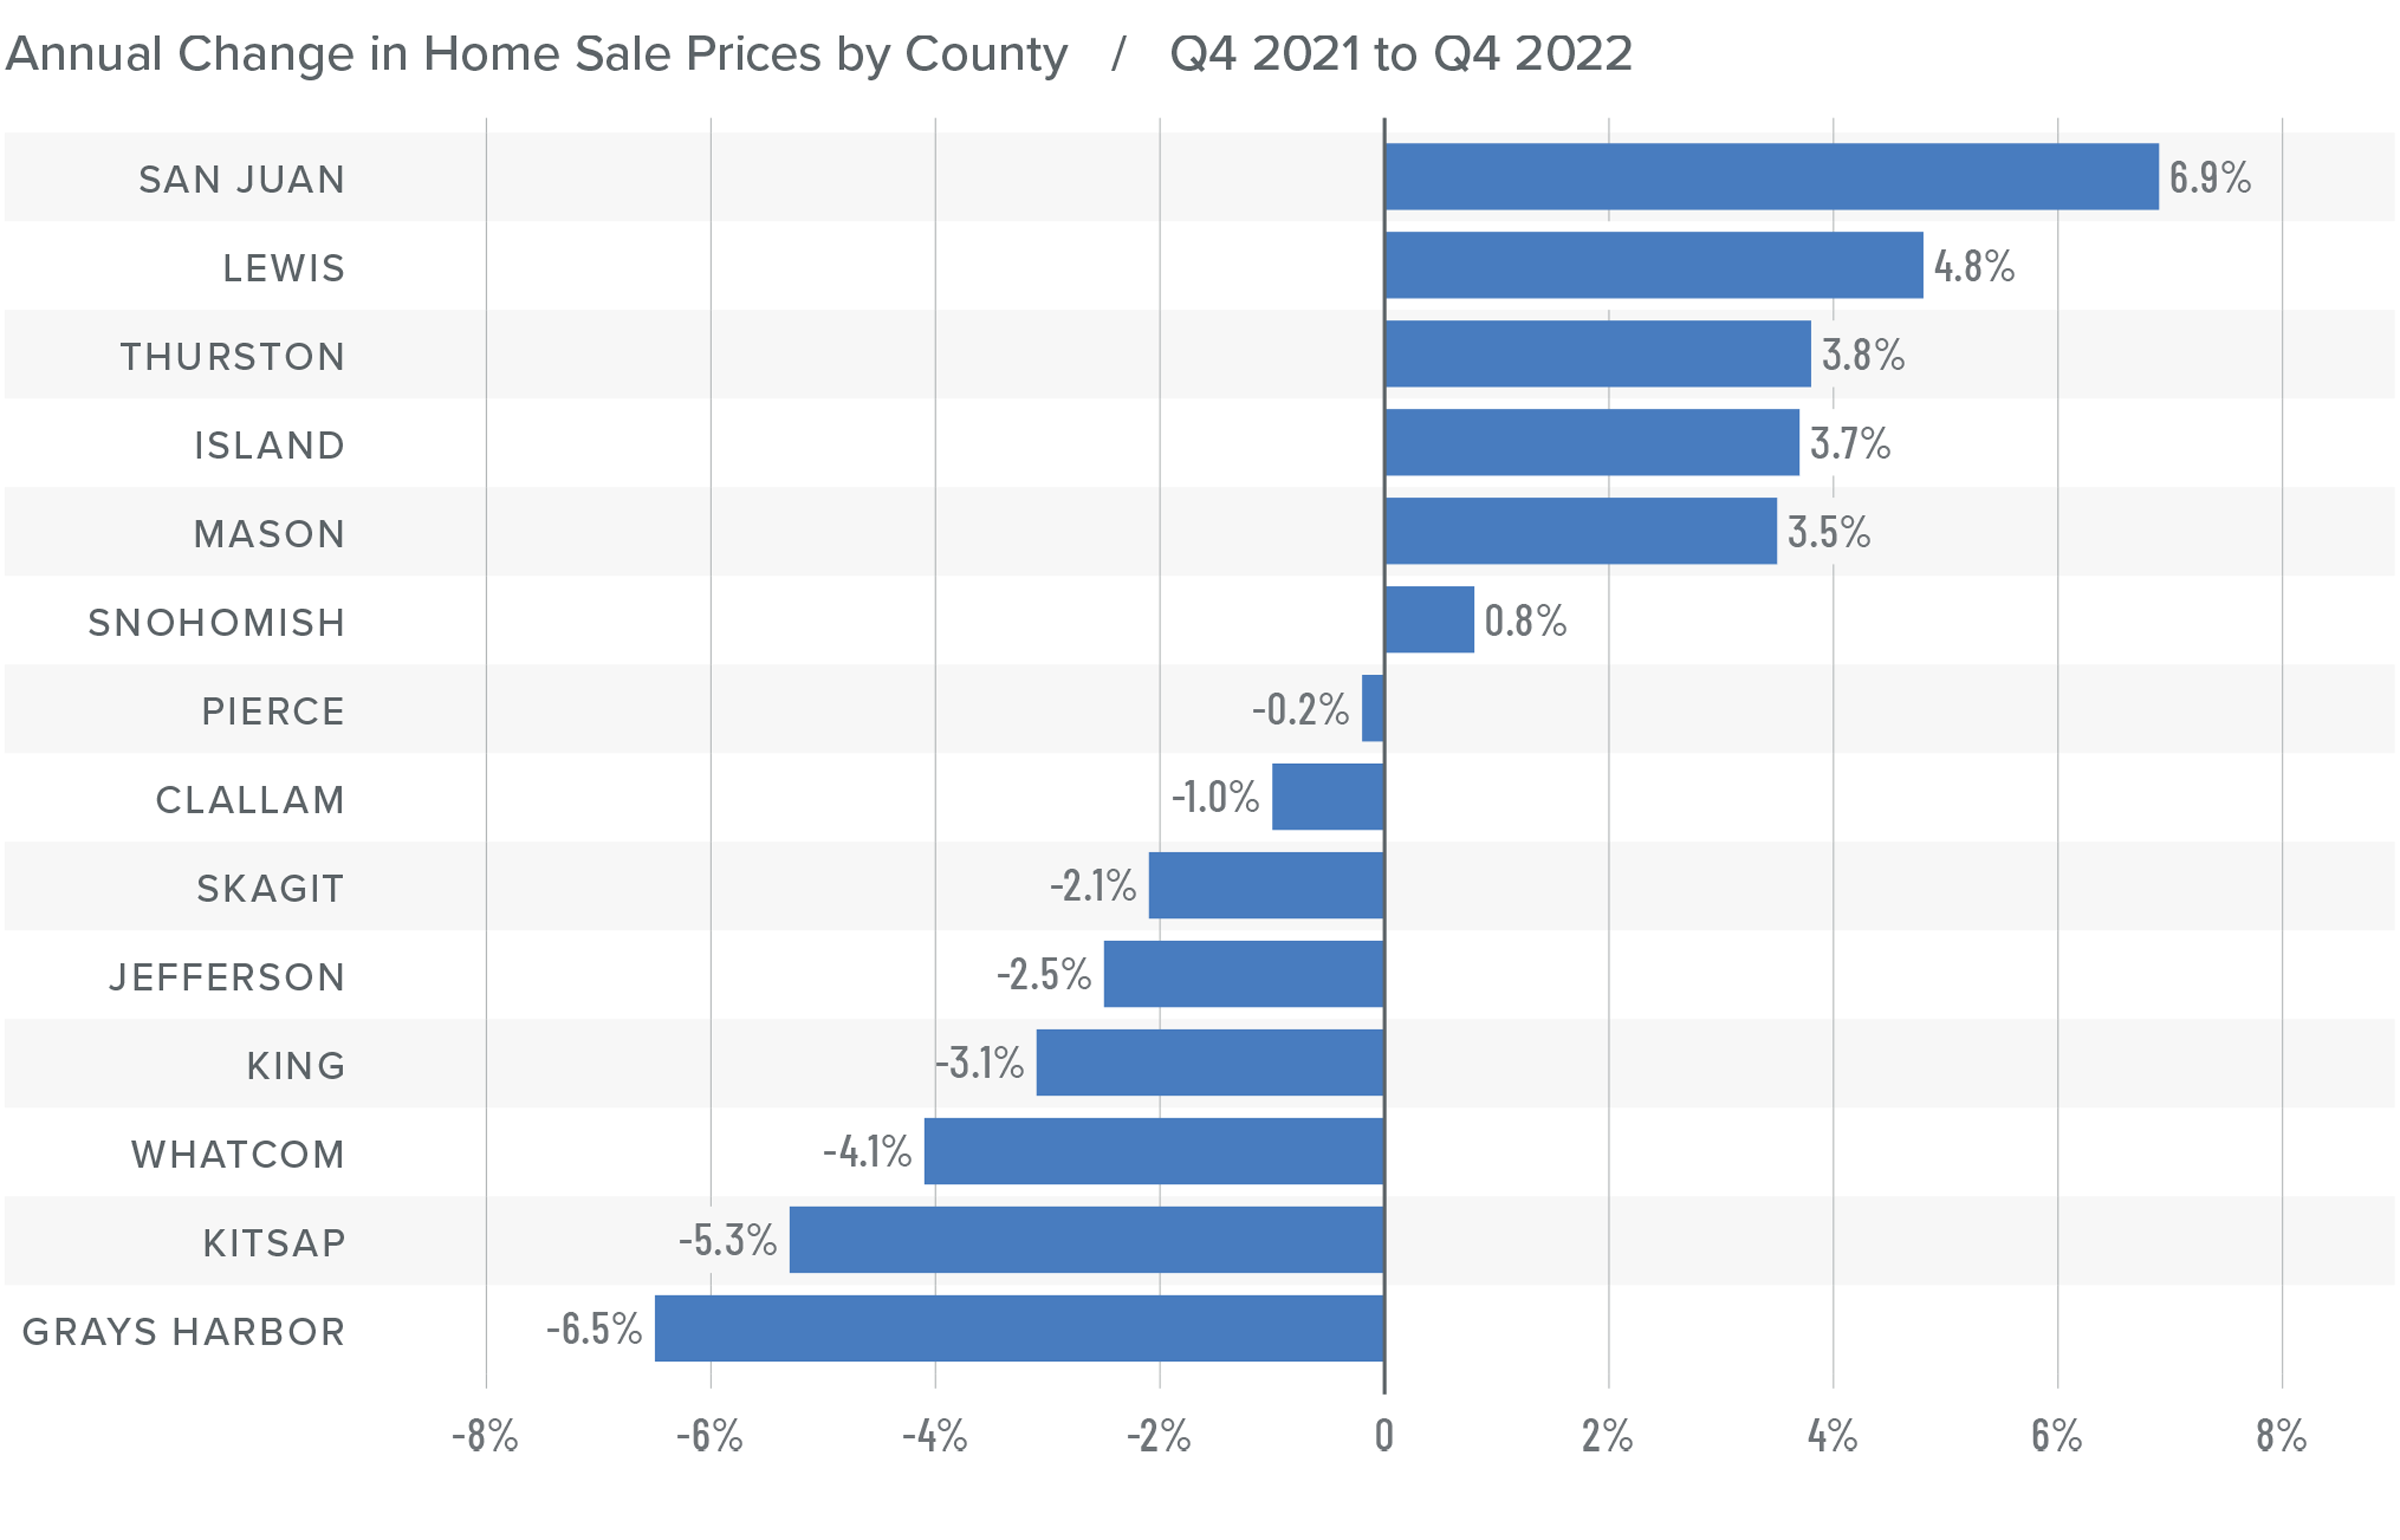
❱ Sale prices fell an average of 2% compared to the same period the year prior and were 6.1% lower than in the third quarter of 2022. The average sale price was $702,653.
❱ The median listing price in the fourth quarter of 2022 was 5% lower than in the third quarter. Only Skagit County experienced higher asking prices. Clearly, sellers are starting to be more realistic about the shift in the market.
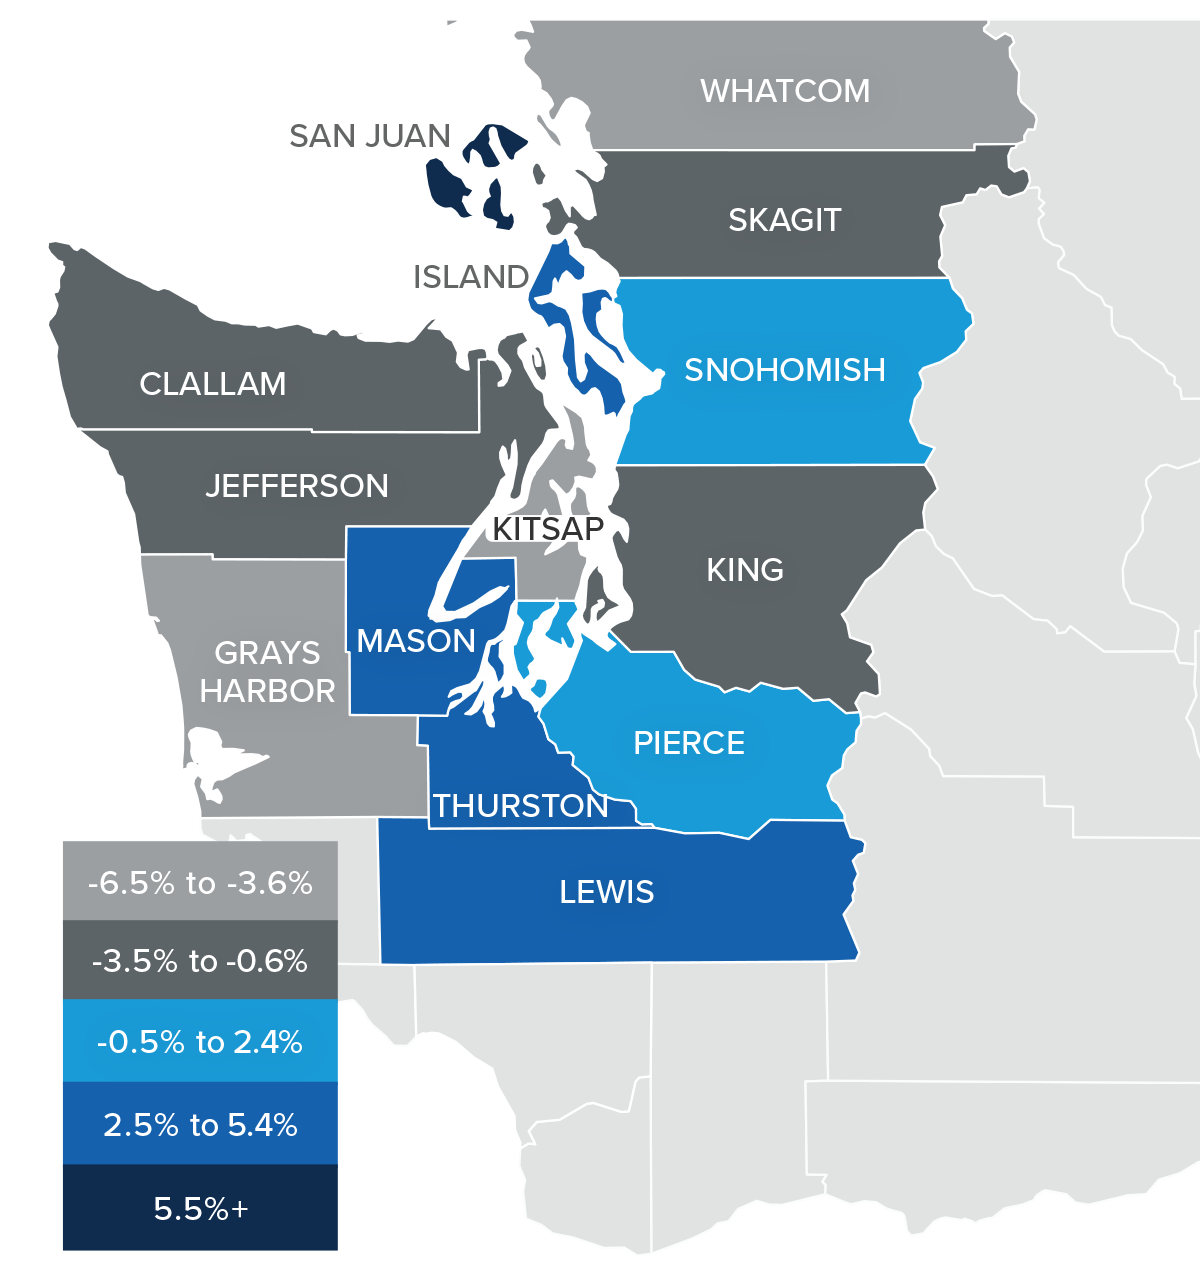
❱ Even though the region saw aggregate prices fall, prices rose in six counties year over year.
❱ Much will be said about the drop in prices, but I am not overly concerned. Like most of the country, the Western Washington market went through a period of artificially low borrowing costs, which caused home values to soar. But now prices are trending back to more normalized levels, which I believe is a good thing.
Mortgage Rates
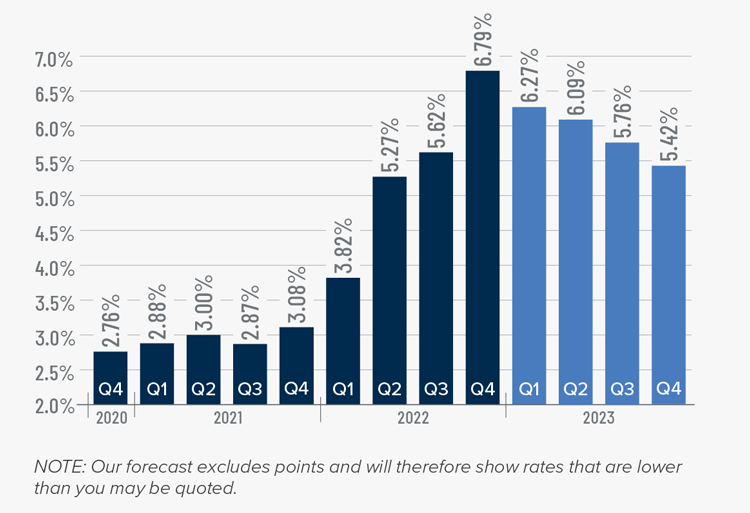
Rates rose dramatically in 2022, but I believe that they have now peaked. Mortgage rates are primarily based on the prices and yields of bonds, and while bonds take cues from several places, they are always impacted by inflation and the economy at large. If inflation continues to fall, as I expect it will, rates will continue to drop.
My current forecast is that mortgage rates will trend lower as we move through the year. While this may be good news for home buyers, rates will still be higher than they have become accustomed to. Even as the cost of borrowing falls, home prices in expensive markets such as Western Washington will probably fall a bit more to compensate for rates that will likely hold above 6% until early summer.
Western Washington Days on Market
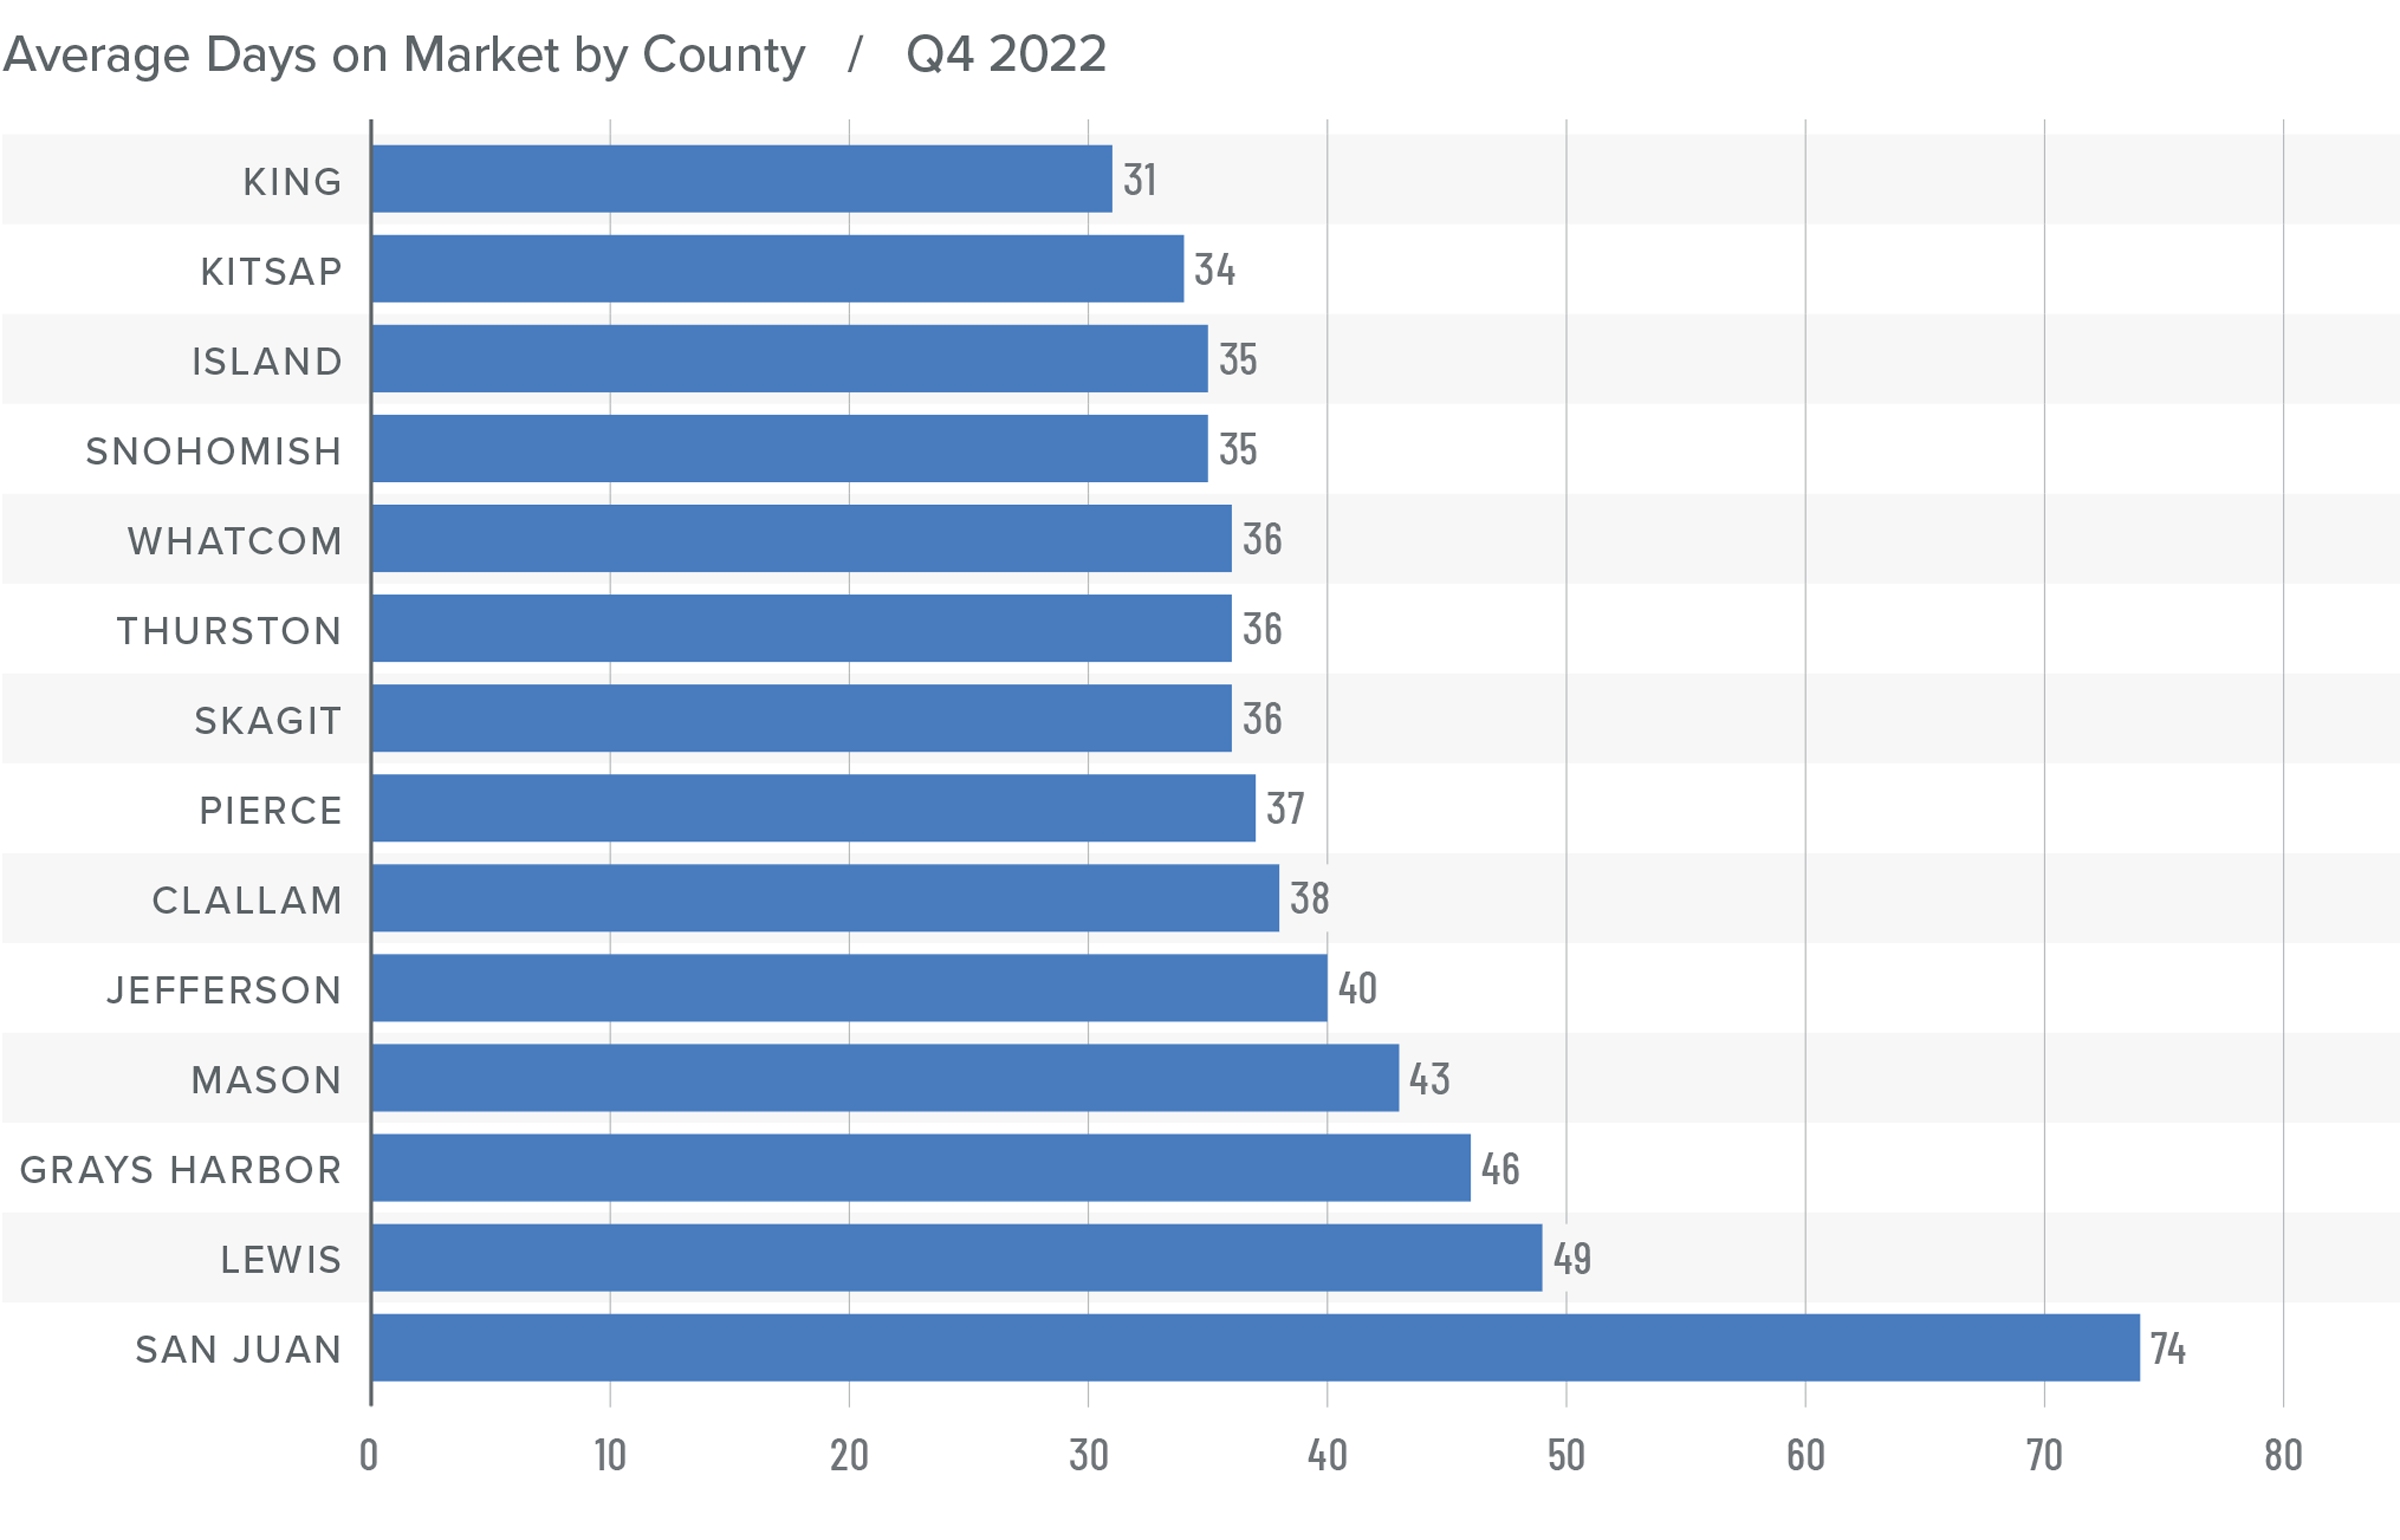
❱ It took an average of 41 days for homes to sell in the fourth quarter of 2022. This was 17 more days than in the same quarter of 2021, and 16 days more than in the third quarter of 2022.
❱ King County was again the tightest market in Western Washington, with homes taking an average of 31 days to find a buyer.
❱ All counties contained in this report saw the average time on market rise from the same period a year ago.
❱ Year over year, the greatest increase in market time was Snohomish County, where it took an average of 23 more days to find a buyer. Compared to the third quarter of 2022, San Juan County saw average market time rise the most (from 34 to 74 days).
Conclusions
This speedometer reflects the state of the region’s real estate market using housing inventory, price gains, home sales, interest rates, and larger economic factors.
The regional economy is still growing, but it is showing signs of slowing. Although this is not an immediate concern, if employees start to worry about job security, they may decide to wait before making the decision to buy or sell a home. As we move through the spring I believe the market will be fairly soft, but I would caution buyers who think conditions are completely shifting in their direction. Due to the large number of homeowners who have a mortgage at 3% or lower, I simply don’t believe the market will become oversupplied with inventory, which will keep home values from dropping too significantly.
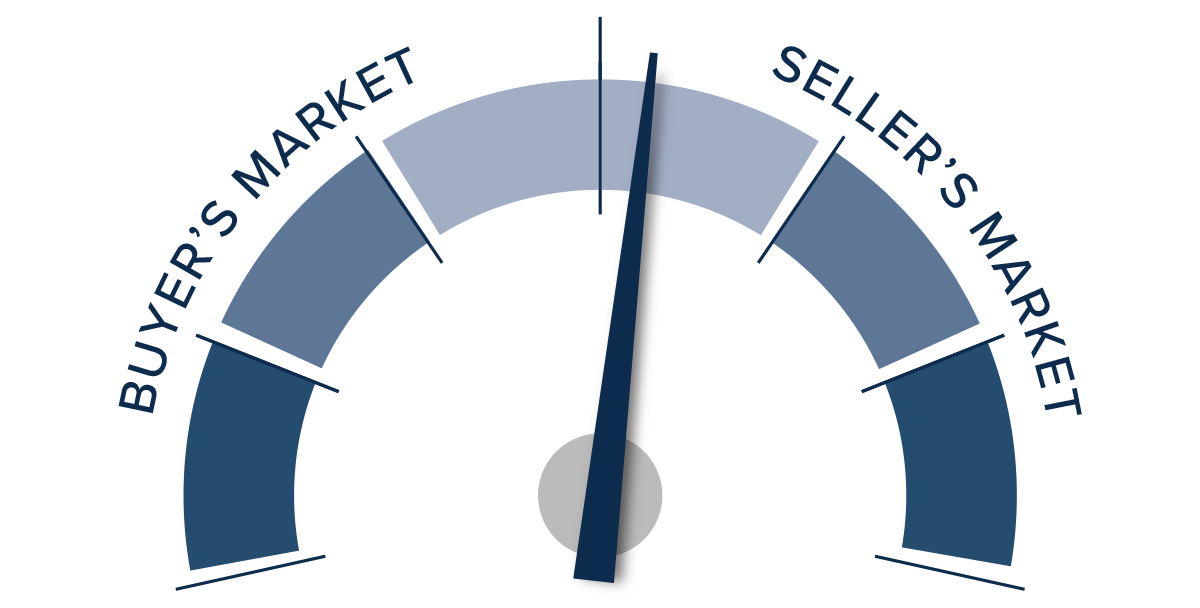
Ultimately, however, the market will benefit buyers more than sellers, at least for the time being. As such, I have moved the needle as close to the balance line as we have seen in a very long time.
About Matthew Gardner
As Chief Economist for Windermere Real Estate, Matthew Gardner is responsible for analyzing and interpreting economic data and its impact on the real estate market on both a local and national level. Matthew has over 30 years of professional experience both in the U.S. and U.K.
In addition to his day-to-day responsibilities, Matthew sits on the Washington State Governors Council of Economic Advisors; chairs the Board of Trustees at the Washington Center for Real Estate Research at the University of Washington; and is an Advisory Board Member at the Runstad Center for Real Estate Studies at the University of Washington where he also lectures in real estate economics.
")


