
 Facebook
 X
X
 Pinterest
 Copy Link
Local Look: Western Washington Housing Update 5/7/25

Last month I said our local real estate market was on a roller coaster, and that proved true again, this month, as sales trends turned sharply downward after a strong March.
Pending sales fell below last month’s, and last year’s levels, as many buyers pressed “Pause” on their home purchase decisions, in the face of rising economic uncertainty and stock market volatility.
Here are the four key metrics I watch to track supply and demand in the market: closed and pending sales, which tell us a lot about demand; and listings – new and active – which tell us a lot about supply.
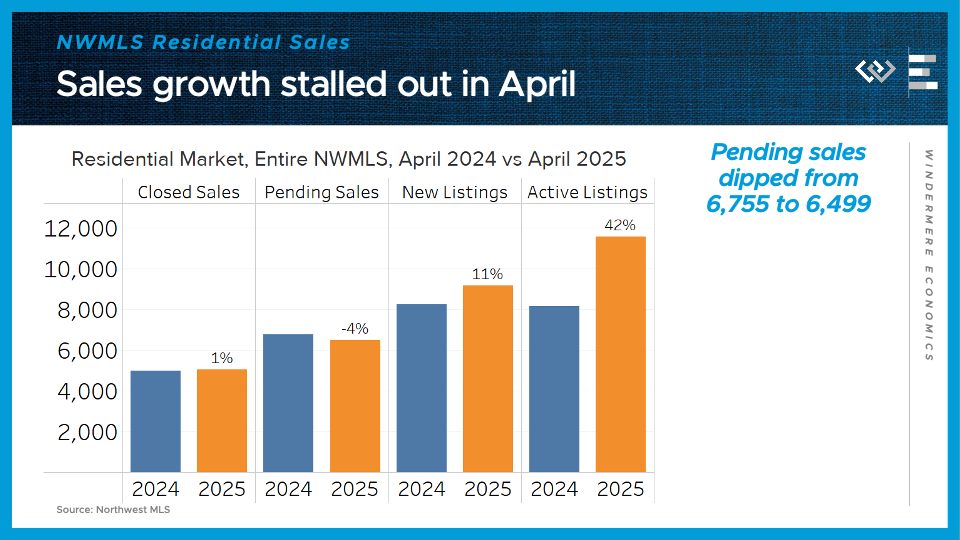
Across the Northwest MLS, closed sales of single-family homes grew just 1% in April from their year-ago levels, after growing 5% in March. Pending sales, which are more of a real-time demand indicator, dipped 4% from last year, a disappointing reversal after climbing 7% in March.
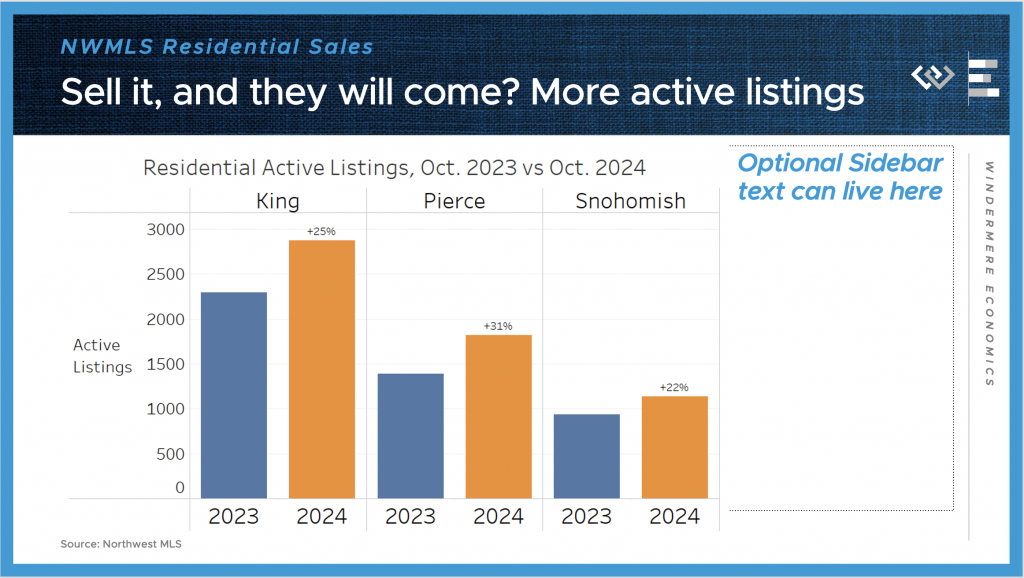
On the supply side, about 11% more new listings hit the market this April, and the tally of active listings ended the month 42% higher than April 2024’s inventory. Buyers are still seeing a lot more options than they had last spring.
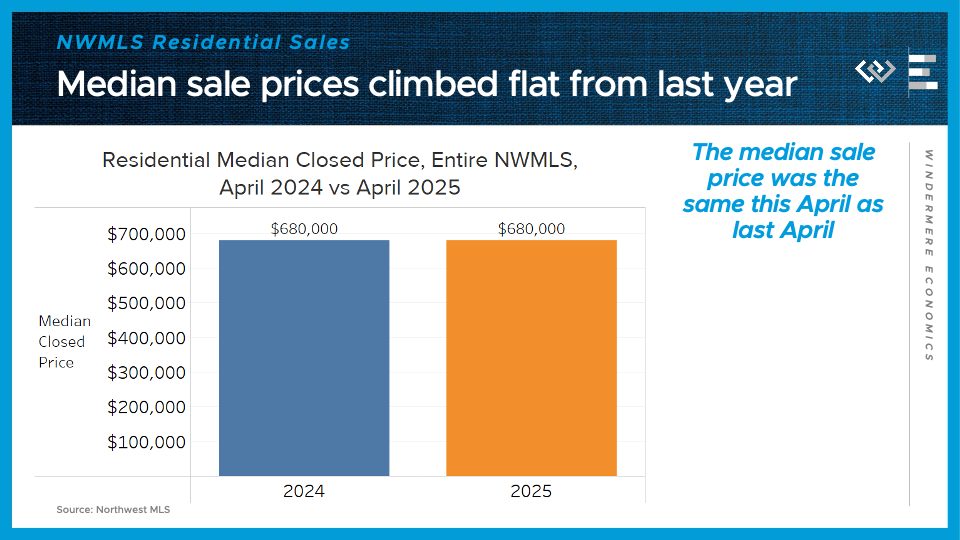
Finally: the median price for those closed single-family home sales was exactly the same this April as last year: $680,000. The extra inventory and cautious buyers seem to have brought price growth to a halt, for now.
Putting it all together: the market is looking pretty balanced across Washington, now that buyers took a step back in April, as they’re taking time to digest the impact of tariffs and stock market volatility.
Now I’ll dig into the four counties encompassing the greater Seattle area, where buyers pulled back even more.
Residential closed sales dipped 1% year over year here in the 4-county region, largely due to a 2% drop in King County. Closed sales dipped 1% in Kitsap County; climbed 2% in Pierce County, including Tacoma; and were flat in Snohomish County, including Everett.
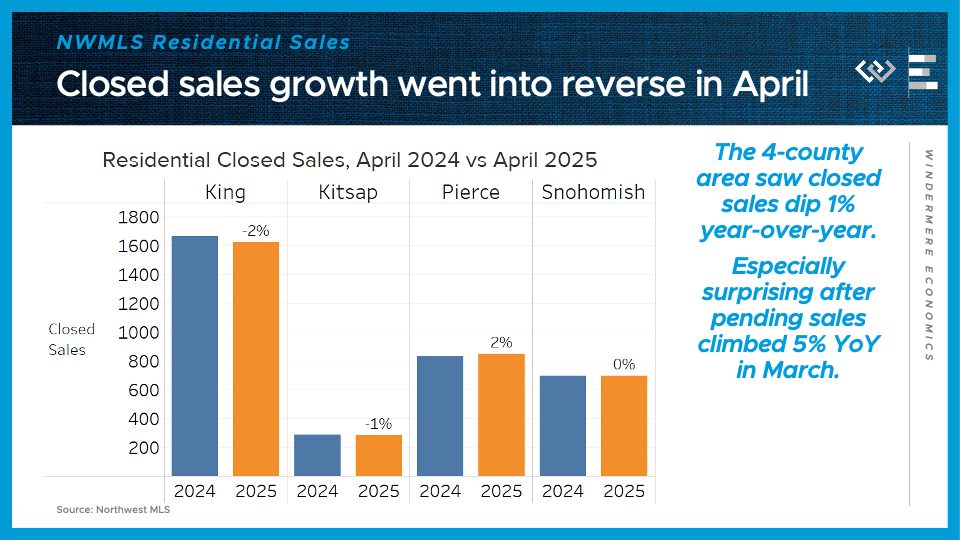
This is especially surprising because there was healthy pending sales growth around the region in March, suggesting either more cancellations, or that this dropoff happened mostly in the end of the month of April.
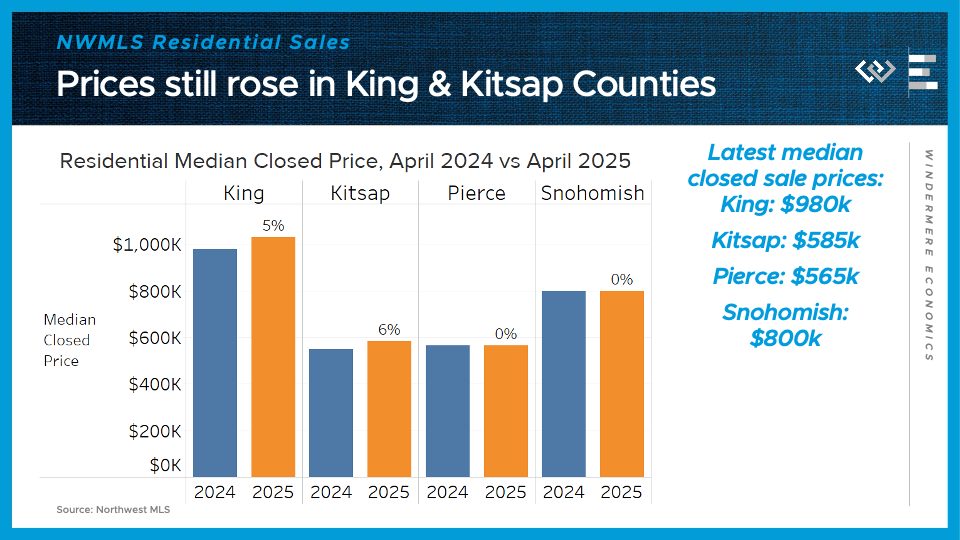
The median sale price kept marching upward in King and Kitsap Counties, by 5-6%, while prices were flat year-over-year in Pierce and Snohomish Counties.
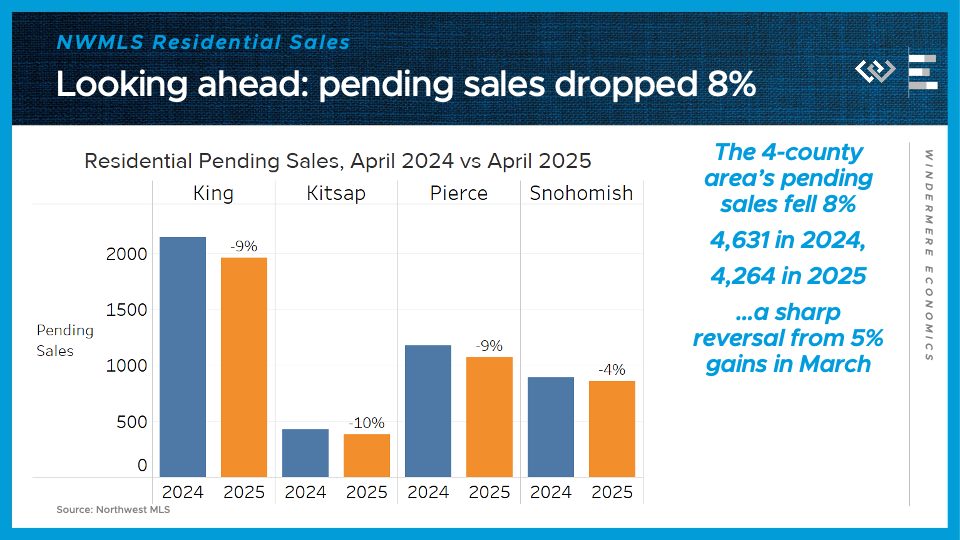
Looking ahead, pending sales dropped 8% in the 4-county area: down 9% in King, down 10% in Kitsap, down 9% in Pierce, and down 4% in Snohomish County. This is a sharp reversal from March’s gains, and suggests we will see closed sales slide in May.
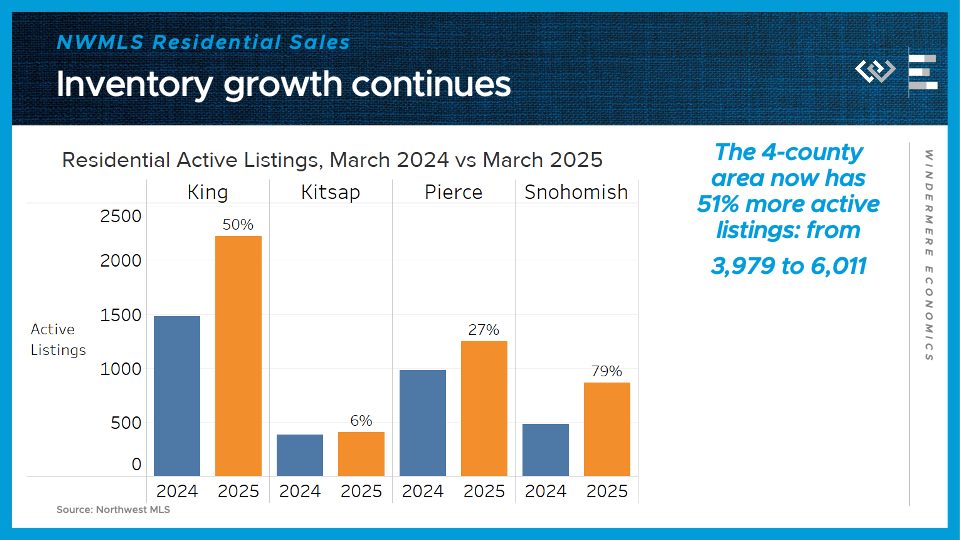
On the supply side, the 4-county greater Seattle area had just over 6,000 active listings at the end of April, up about half from the same time last year. Just like in March, the inventory growth is especially dramatic in King and Snohomish Counties, where listings are up 50% and 79% respectively.
All in all, these indicators from April show that the forward momentum in sales we saw in March has fizzled out for now, at least, because buyers have been hit by economic uncertainty and stock market volatility that’s caused some of them to pause their home buying search. Looking ahead, we saw stock markets actually end April about where they started, after a wild ride down and back up, so that may be cause for optimism that April’s negative shocks start to fade in the rear-view mirror. What comes next depends on whether the economic outlook and stock market movements stabilize and firm up.
The Benefits of Shared Second Home Ownership

The idea of owning a second home is a dream for many—but the reality often comes with high costs, logistical hurdles, and much more upkeep than expected. And as home prices continue to climb and travel habits shift, buyers are starting to ask: is there a better way?
In partnership with Windermere, Esterre offers a fresh new answer to that question with an innovative shared second home ownership model, allowing buyers to co-own a thoughtfully curated portfolio of vacation homes—without taking on the full-time costs, upkeep, or responsibilities of owning a second home on their own.
Understanding A Shared Ownership Model
Shared, or fractional, ownership is quickly emerging as a practical and flexible alternative to second homeownership—one that makes vacation homes more attainable without the stress of going it alone. It’s a concept that’s been around for years, but today’s models offer a more refined, accessible experience. So, what does shared ownership really mean, and how does it work?
Shared ownership allows multiple buyers to co-own a home, splitting both the costs and the responsibilities. Each owner typically holds a defined share of the property, with usage and expectations outlined in a clear agreement. While different models exist, many shared ownership opportunities offer real estate equity, meaning owners can benefit from long-term use as well as a potential share in the home’s value over time. When applied to vacation homes, shared ownership presents a more accessible way to enjoy meaningful time away—without the full-time costs or commitment of owning a second property outright.
Below are some key benefits of shared ownership.
Benefits of Shared Ownership
- Lower upfront cost compared to buying a whole property.
- Shared responsibility for maintenance and property management.
- More efficient use of the home throughout the year. Greater flexibility in travel and vacation options.
- Real equity, with the potential for long-term financial return.
- Accessible entry point into luxury vacation real estate.
How Esterre is Reimagining Shared Ownership
Esterre is bringing a fresh take to the shared ownership space. Unlike traditional timeshares or fractional ownership models, Esterre offers co-ownership in a curated portfolio of fully managed, high-end vacation homes across Washington State. Each property is thoughtfully chosen for its location, design, and year-round appeal. Rather than being tied to a single home, owners hold real equity in the entire portfolio and benefit from a growing collection of properties as new homes are added. With access to over a month of stays annually at any home in the portfolio, owners can enjoy variety and flexibility without sacrificing comfort or quality.
Esterre also simplifies the process from start to finish. Maintenance, furnishing, landscaping, and cleaning are all handled on your behalf so you can focus on enjoying your time away. A standout feature of Esterre’s model is its built-in 12-year exit strategy. When the time comes, the homes are sold, and the proceeds are divided among the owners, with 20% of the appreciated value going to Esterre. It’s a modern approach to second homeownership—designed to offer ease, flexibility, and a clear path forward.
Discover more at esterre-wa.com.


Local Look: Western Washington Housing Update 4/7/25
Hi. I’m Jeff Tucker, principal economist at Windermere Real Estate, and this is a Local Look at the March 2025 data from the Northwest MLS.
Our local real estate roller coaster turned back up in March, after a couple soft months to start the year. Pending sales actually climbed YoY in March, around Washington and especially the Puget Sound region, as buyers seemed to respond to the decline in mortgage rates over the month. This is still not a red-hot spring selling season but it’s not exactly a buyer’s market either.
Here are the four key metrics I watch to track supply and demand in the market: closed and pending sales, which tell us a lot about demand; and listings – new and active – which tell us a lot about supply.
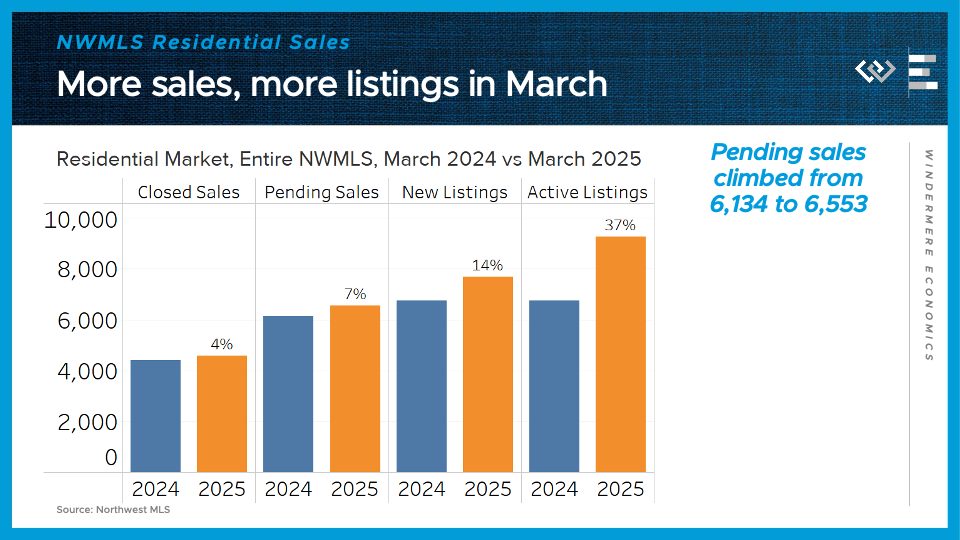
Across the Northwest MLS, closed sales of single-family homes grew 4% in March from their year-ago levels, after flatlining in February. Pending sales, which are more of a real-time demand indicator, climbed 7% from last year. That’s a strong reversal from February’s dip in pending sales.
On the supply side, about 14% more new listings hit the market this March, and the tally of active listings ended the month 37% higher than March 2024’s inventory. Buyers are seeing a lot more options than they had last spring.

The final key metric to check in on: the median price for those closed single-family home sales climbed just 2% year-over year in March, from about $655,000 to $666,000. That’s another month of decelerating price growth after Q4 was particularly hot.
Putting it all together, we’ve got more supply meeting more demand this spring – more buyers are finding a match; sales are picking up; but all that inventory has kept a lid on price growth.
Now I’ll dig into the four counties encompassing the greater Seattle area, which mostly had similar trends to Washington as a whole.
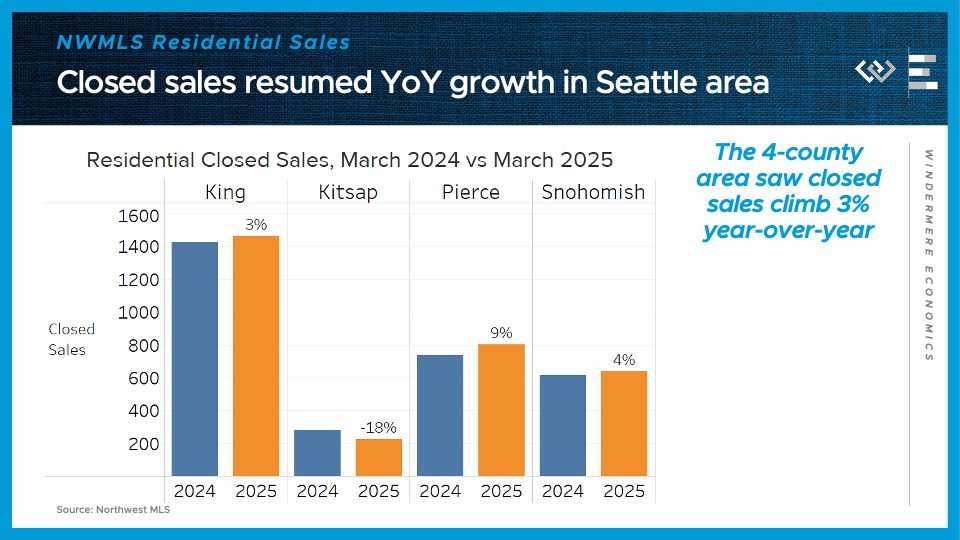
Residential closed sales climbed 3% year over year here in King County, and for the whole 4-county region; they dropped 18% in Kitsap County; climbed 9% in Pierce County, including Tacoma; and rose 4% in Snohomish County, including Everett. Not huge growth but it is a turnaround from February, when sales fell slightly from year-ago levels.
The median sale price climbed between 3 and 5%, locally: 3% change from last year in King County and Pierce County, up 5% in Kitsap County, and up 4% in Snohomish County.

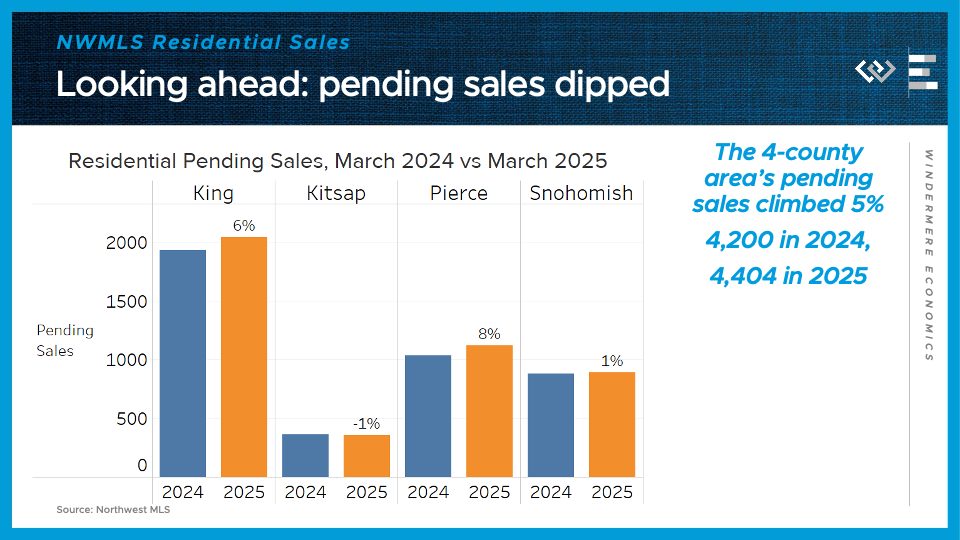
Looking ahead, pending sales climbed more than closed sales: up 6% in King, down 1% in Kitsap, up 8% in Pierce, and up 1% in Snohomish County. Altogether that makes 5% growth across the 4 counties, which should support further growth in closings in April. That’s the biggest piece of evidence I see that buyers are coming back to the market this spring.
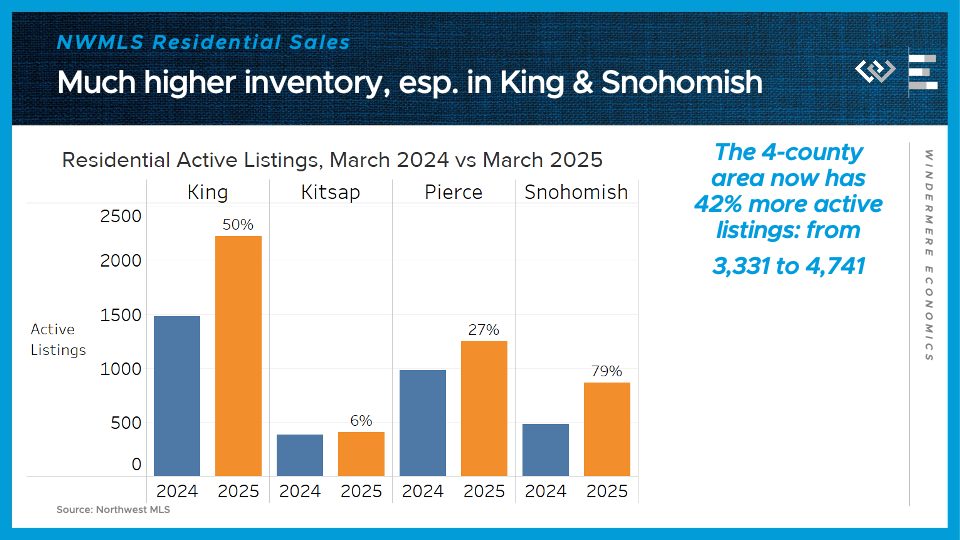
On the supply side, the 4-county greater Seattle area had about 42% more active listings at the end of March than the same time last year. The inventory growth is especially dramatic in King and Snohomish Counties, where listings are up 50% and 79% respectively.
So while there’s more purchase activity, these inventory gains are helping to keep it a pretty balanced market. Barring any big negative shocks, I’m expecting stronger year-over-year sales growth in April and May, because last year mortgage rates spiked upward starting in mid-April, which sent buyers back into hibernation. This spring, interest rates are declining modestly, which is the silver lining of a diminished outlook for economic growth.
Local Look: Western Washington Housing Update 3/6/25

Hi. I’m Jeff Tucker, principal economist at Windermere Real Estate, and this is a Local Look at the February 2025 data from the Northwest MLS.
Hi. I’m Jeff Tucker, principal economist at Windermere Real Estate, and this is a Local Look at the February 2025 data from the Northwest MLS.
After an impressive Q4, and a decent start to the year in January, this February saw buyer activity – and listing activity – slow down a bit relative to last year. I think the rise in mortgage rates back to around 7% this winter has finally cooled off some of the buyer enthusiasm we saw in Q4.
Here are the four key metrics I watch to track supply and demand in the market: closed and pending sales, which tell us a lot about demand; and listings – new and active – which tell us a lot about supply.
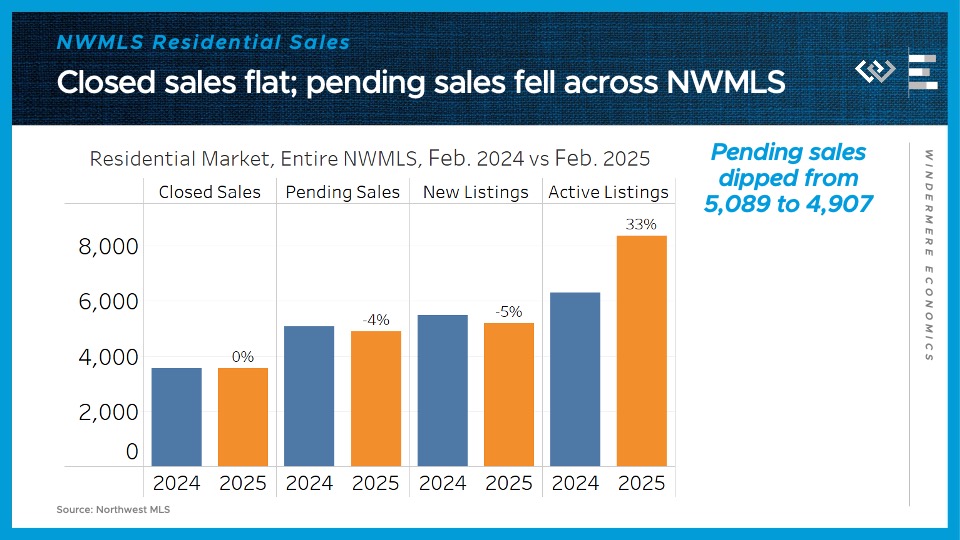
Across the Northwest MLS, closed sales of single-family homes were almost exactly flat year-over-year, at 3,550 vs last year’s 3,553. Pending sales, which will mostly close in March, dropped 4% from the same month last year. One extenuating circumstance was we had 1 less business day this February, since last year was a leap year, but this is still looking like a cooler market in terms of demand than we saw in Q4.
On the supply side, about 5% fewer new listings hit the market this February compared to last year’s, while the pool of active listings in the reservoir ended the month 33% higher than February 2024’s inventory.
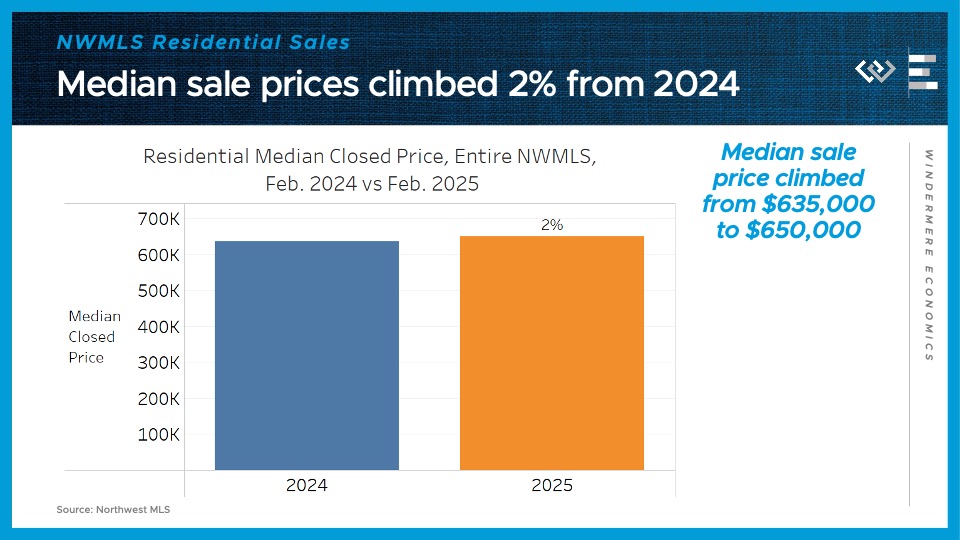
The final key metric to check in on: the median price for those closed single-family home sales climbed just 2% year-over year in February, from about $635,000 to $650,000. That represents a further cooldown from median price growth we’d seen in Q4, and it seems to indicate that the higher levels of inventory are putting some competitive pressure on sellers, preventing prices from rising too much.
Putting it all together, this looks like a market where the normal seasonal upswing in sales and prices has begun, but the year-over-year comparisons are looking a lot cooler than they were throughout Q4 and into January. I think that cooldown was mostly due to interest rates rebounding this winter, which discouraged buyers, so looking ahead, if we see the recent dip in interest rates in late February and early March actually stick, I could see some of that heat coming back into the market right as we hit the spring buying season.
Now I’ll dig into the four counties encompassing the greater Seattle area, where a similar cooldown played out in February.
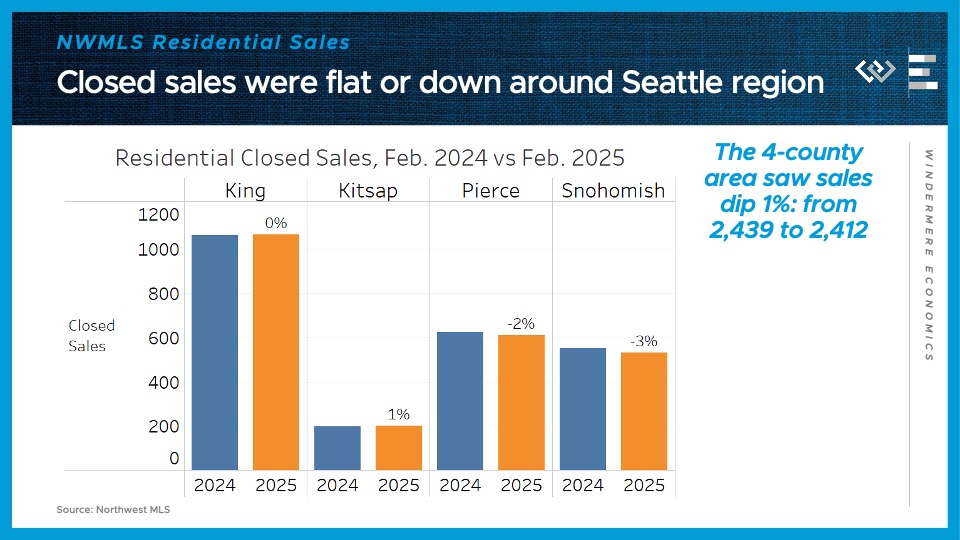
Residential closed sales were flat year over year here in King County; inched up 1% across the Sound in Kitsap County; dipped 2% in Pierce County, including Tacoma; and fell 3% in Snohomish County, including Everett. So for the 4-county region as a whole, that’s a dip of 1% from the same month last year. Not bad but it is a slowdown after 6% growth in January.
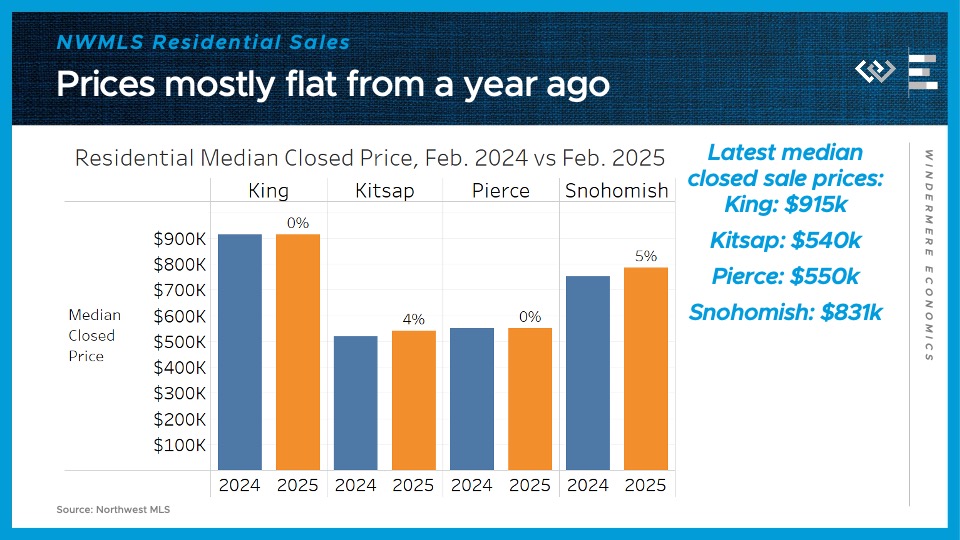
The median sale price was mostly flat, locally: 0% change from last year in King County and Snohomish County, up 4% in Kitsap County, and up 5% in Pierce County.
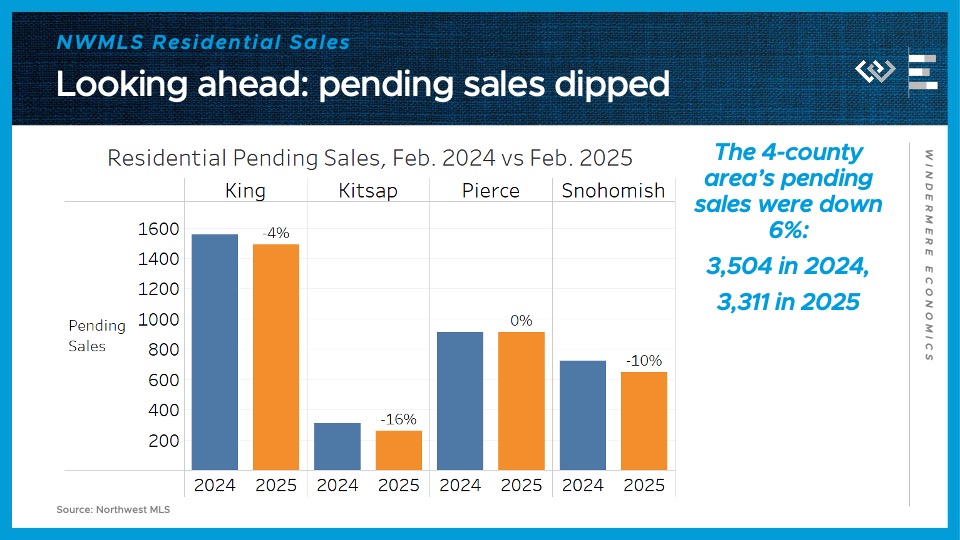
Looking ahead, pending sales were flat or down locally: down 4% in King, down 16% in Kitsap, flat in Pierce, and down 10% in Snohomish County. Altogether that makes a 6% decline across the 4 counties, suggesting we’ll see closings continue to fall year-over-year in March.
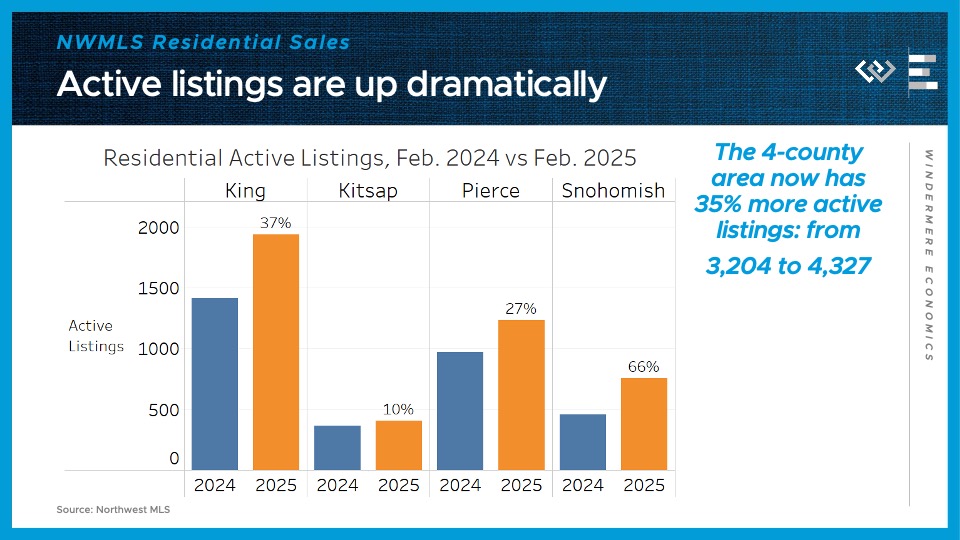
On the supply side, the 4-county greater Seattle area had about 35% more active listings at the end of February than the same time last year. That inventory growth comes in spite of a 7% decline across the region in the flow of new listings this February. Again, that was potentially impacted by the slightly shorter month, but it does suggest that sellers haven’t been flocking to list their homes in greater numbers yet this year. It could also be due to sellers jumping the gun on listing: year to date, new listings are up 8%, thanks to very impressive new listings in January. Now I’ll be curious to see if the recent dip in rates can help re-start the listing pipeline locally.
Windermere Partners with Esterre to Reimagine Second Home Ownership

As more and more people desire an escape from everyday life, the appeal of second home ownership has grown stronger. But when the dream of owning a vacation home meets the reality of maintenance, expenses, and logistics, many buyers begin to question whether the rewards outweigh the challenges. Esterre, in partnership with Windermere Real Estate, is changing the narrative by introducing a fresh, innovative approach to second homeownership that redefines what’s possible. Here’s all you need to know about this exciting new partnership.
The Challenges of Owning a Vacation Home
Beyond the upfront purchase of a vacation home, the ongoing costs of maintenance, landscaping, and furnishing can quickly add up, making the experience feel less like a relaxing retreat and more like managing a second job. On top of that, many owners find themselves traveling less and tied to their vacation homes to make the most of their investment. While the idea of having a dedicated getaway is appealing, it can limit the freedom to explore new destinations and create diverse experiences. These common hurdles have left many wondering if there’s a more flexible, hassle-free way to enjoy the benefits of second home ownership.
Meet Esterre
Esterre, founded in Seattle in partnership with Windermere in 2024, is redefining what it means to own a second home. By introducing a fresh approach to second homeownership, Esterre enables individuals to have an equal equity ownership in a portfolio of carefully curated properties in some of Washington State’s most desirable destinations. This model eliminates the headaches and stress of maintenance, furnishing, landscaping, cleaning, and financial management, offering owners a seamless, stress-free experience. Each home in the portfolio is thoughtfully designed and fully managed, allowing owners to simply enjoy their time away.
How Windermere and Esterre Are Simplifying Second Home Ownership
Windermere’s collaboration with Esterre marks an exciting step forward in the real estate world. Combining Windermere’s trusted expertise with Esterre’s innovative concept, this partnership offers a flexible, transparent, and economically sensible solution to traditional vacation home ownership challenges. For a fraction of the cost of purchasing a single vacation home, buyers gain equity in a portfolio of high-end properties across Washington State’s most scenic destinations, including Snoqualmie Summit, San Juan Island, Whidbey Island, Fidalgo Island, and the Olympic Peninsula, with more locations to come. These homes, all within a 2- to 3-hour drive from Seattle, are thoughtfully chosen to provide guests with various environments and experiences. Owners can enjoy over a month of annual access to these luxurious properties, with unlimited short notice stays available within 5 days of booking. And, unlike traditional timeshares, Esterre also incorporates a built-in exit strategy, selling the portfolio after 12 years and distributing the proceeds to owners.
Whether it’s a serene island retreat or a mountain escape, this partnership creates a unique opportunity for agents to connect with clients who dream of owning a second home but are deterred by the high costs and responsibilities. Together, Windermere and Esterre are opening doors to a more accessible, flexible, and memorable way to explore Washington State and build lasting memories.
Discover more at esterre-wa.com.


Local Look: Western Washington Housing Update 1/7/25
Hi. I’m Jeff Tucker, principal economist at Windermere Real Estate, and this is a Local Look at the December 2024 data from the Northwest MLS.
After two very strong months of data covering October and November, we got one last month of strong closed sales data in December, but a slowdown in pending sales growth suggests we shouldn’t expect a boom in closings to start out the New Year.
Here are the four key metrics I watch to track supply and demand in the market: closed and pending sales, which tell us a lot about demand; and listings – new and active – which tell us a lot about supply.
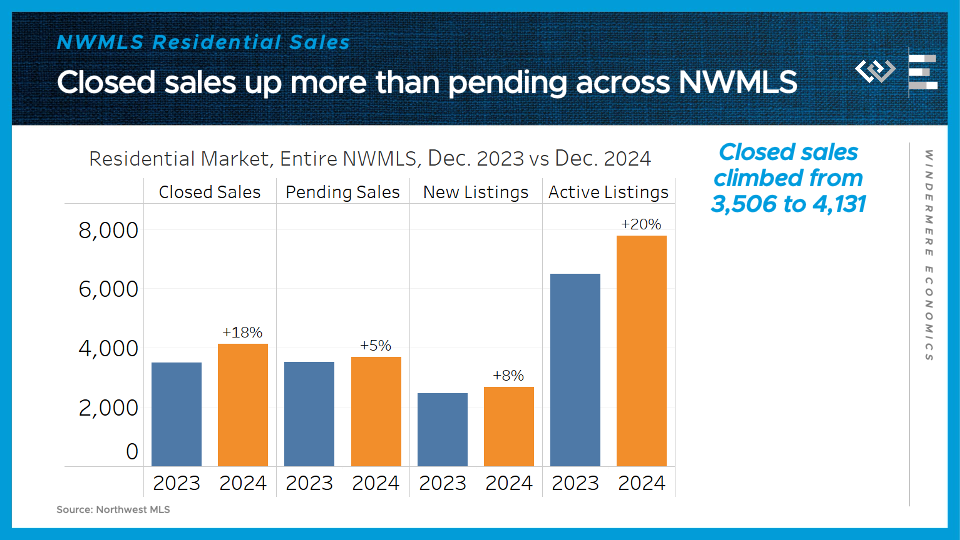
Closed sales of single-family homes climbed 18% year-over-year, from about 3500 to over 4100. Pending sales, which will mostly close in January, only climbed 5% from the same month last year.
On the supply side, about 8% more new listings hit the market this December compared to last one, while the level of inventory in the reservoir was 20% higher at the end of 2024 than at the end of 2023. Of course this is a quiet time of the year in the market, so we should expect all these measures of listings to pick up soon.
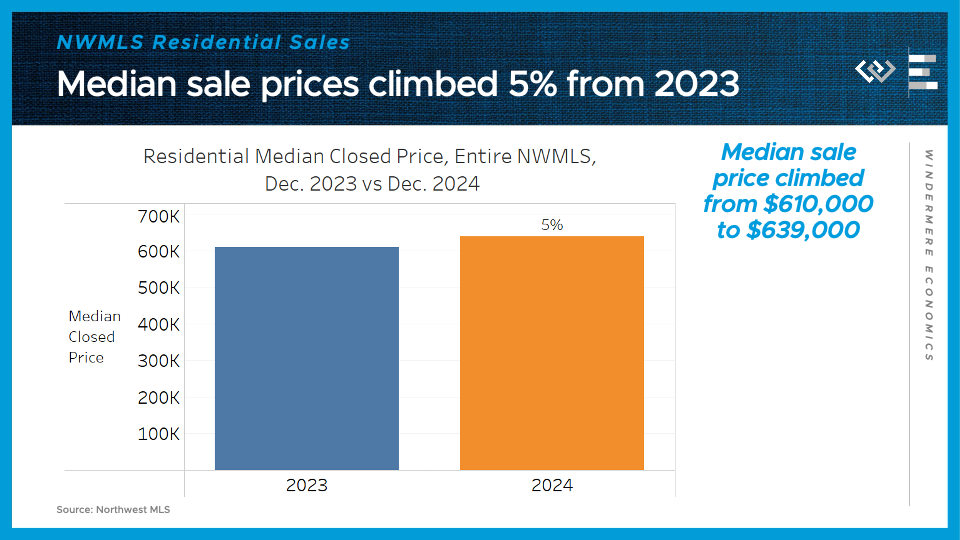
The final key metric to check in on: the median price for those closed single-family home sales climbed about 5% year-over year, from $610,000 to $639,000. That’s a bit of a cooldown from price growth in the previous couple of months, and it’s pretty similar to the pace I’m projecting for 2024.
Putting it all together, this looks like a market that had a surge of demand after the Fed began to cut rates in September, but where that demand bump is cooling off now that mortgage rates have stubbornly rebounded to nearly 7%.
Now I’ll dig into the three counties that comprise the Seattle metropolitan area, where we saw similar trends play out.
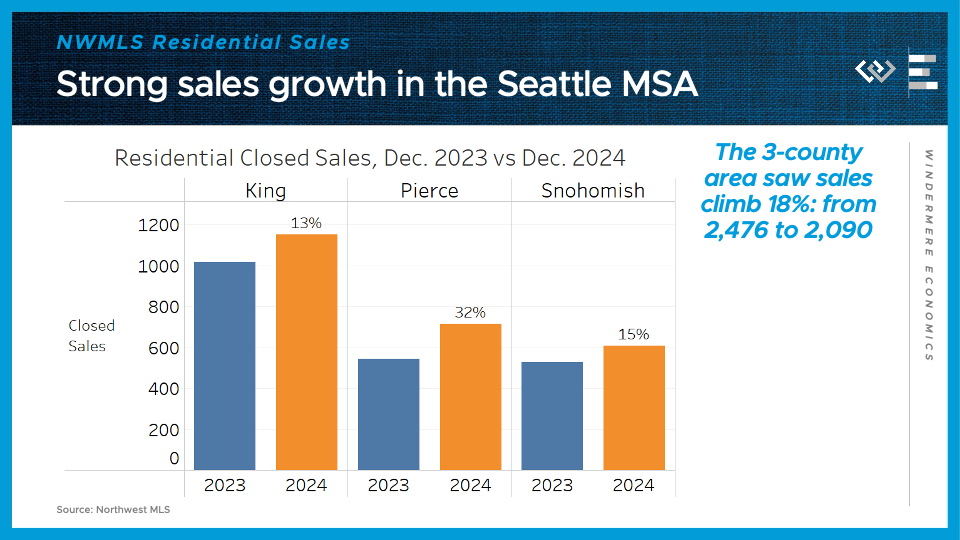
Residential closed sales climbed 13 percent year over year here in King County, which includes Seattle and Bellevue; a whopping 32% down in Pierce County, including Tacoma, and 15% up in Snohomish County, including Everett. So for the 3-county metropolitan area as a whole, that’s a gain of 18% from the same month last year. November, by comparison, saw a 30% increase for the whole MSA, so the sales gains are clearly decelerating.
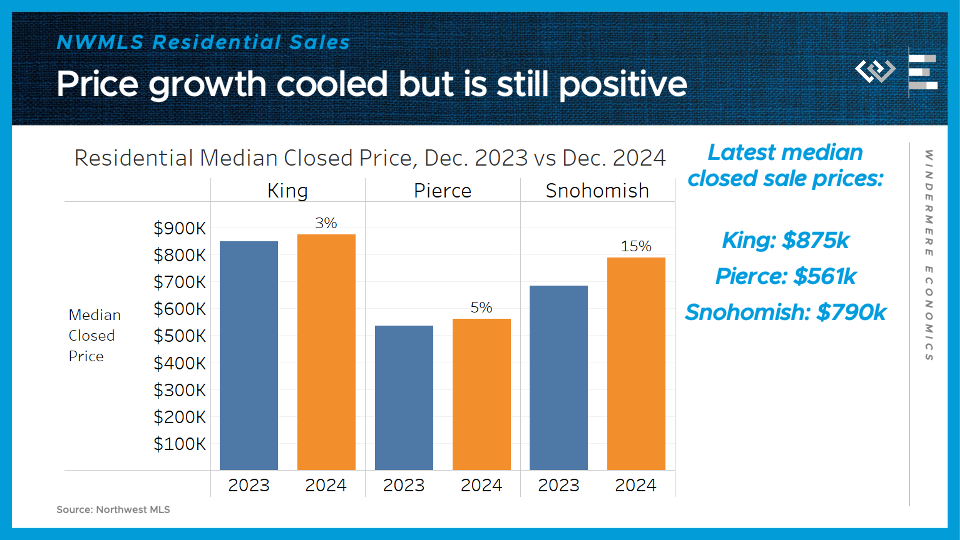
The median sale price climbed modestly: just 3% from last year in King County and 5% in Pierce County, but a whopping 15% in Snohomish. This statistic can get noisy when the sample size is small, like in December, so I think we won’t have a clear view of Snohomish price trends for another couple of months.
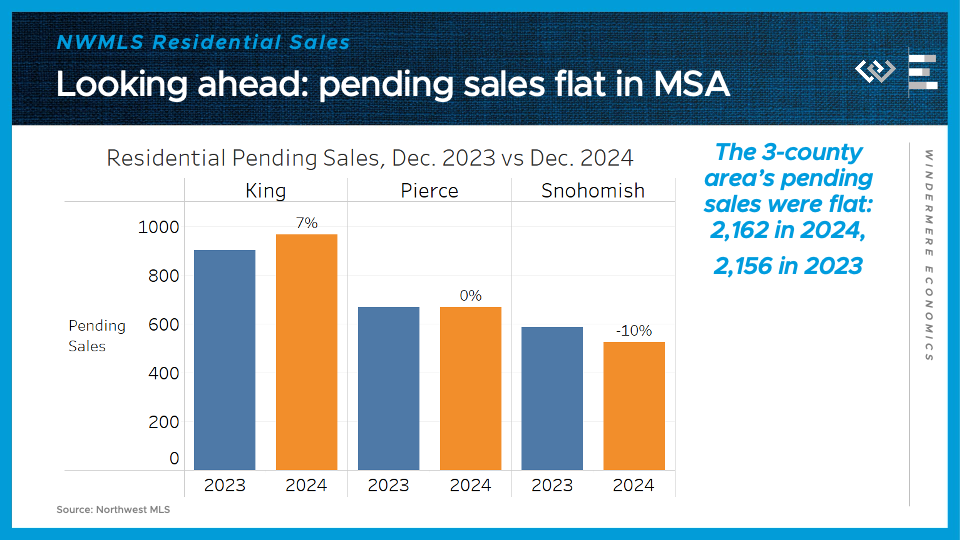
Looking ahead, there was a pretty different picture for pending sales in each of these counties: up 7% in King, flat year-over-year in Pierce, and down 10% in Snohomish. Again, sales in December are so thin that random noise can look like big changes, so I wouldn’t read too much into that data point for Snohomish County, but the broad picture for the 3-county area is that pending sales were essentially flat year-over-year in December.
On the supply side, the 3-county metro area had about 22% more active listings to end the year than there were at the end of 2023. That could give buyers more options as they start their house hunt in Q1, and could help keep price growth in check. But the biggest factor behind supply and demand this spring will be the number of new listings that come out of the woodwork, which will only start to come into focus in the months ahead.

Local Look: Western Washington Housing Update 12/11/24
Hi. I’m Jeff Tucker, principal economist at Windermere Real Estate, and this is a Local Look at the November 2024 data from the Northwest MLS.
After a blockbuster October report, this was another very strong month for the Washington housing market, especially for sales of single-family homes, and that’s the data I’ll be digging into today.
Here are the four key metrics I watch to track supply and demand in the market: closed and pending sales, which tell us a lot about demand; and listings – new and active – which tell us a lot about supply.
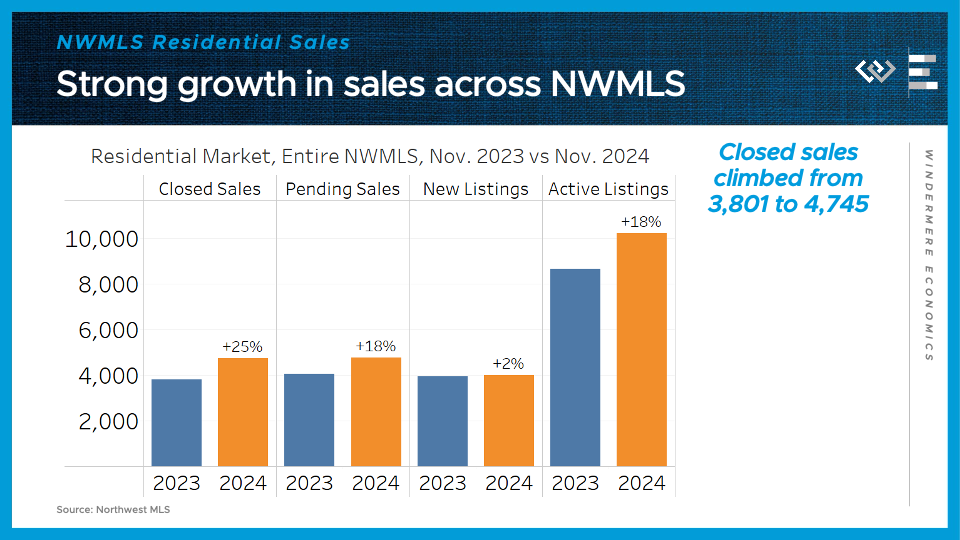
Closed sales of single-family homes climbed 25% year-over-year, from about 3800 to over 4700. Pending sales, which will mostly close in December, climbed a little less from last year, by 18%.
On the supply side, I think of listings as the reservoir of options for buyers to choose from: New listings, which represent the flow of new supply, were up only 2% in November, while the level of inventory in the reservoir was 18% higher than a year ago. Those are both more modest increases than we saw in October, which is a reassuring sign that the market isn’t headed for a glut.
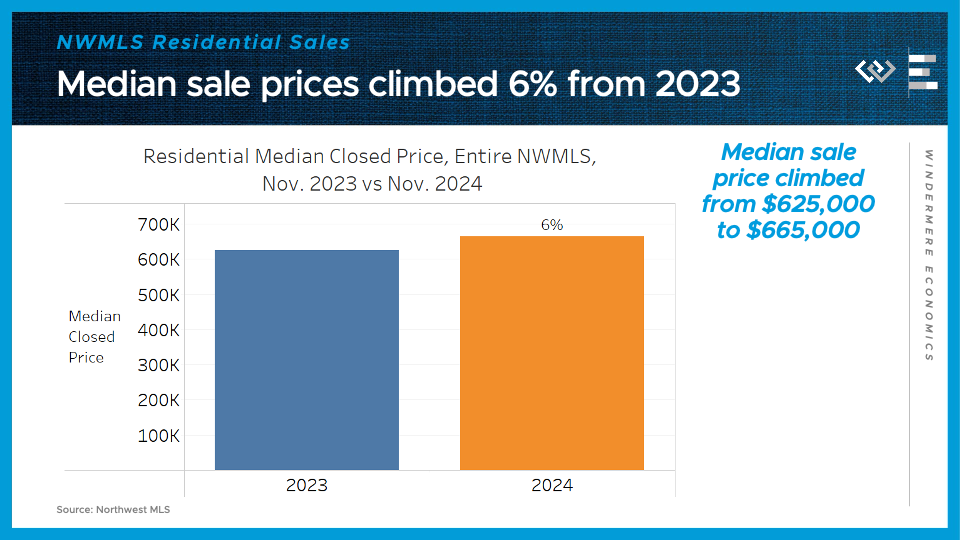
The final key metric to check in on: the median price for those closed single-family home sales climbed about 6% year-over year, from $625,000 to $665,000. That’s slightly lower than last month, which is normal for this time of year, and indicates that price growth is not accelerating in an unusual way. That’s important because affordability is still a key concern for the sustainability of the market throughout Washington.
The strength of closed sales, as well as sustained growth in pending sales, suggests to me that October wasn’t just a flash in the pan, of buyers jumping in because the Fed cut interest rates. Rather, I think that home sales are normalizing after staying extremely depressed for much of the last two years.
Now I’ll dig into the three counties that comprise the Seattle metropolitan area, where we saw similar trends play out.
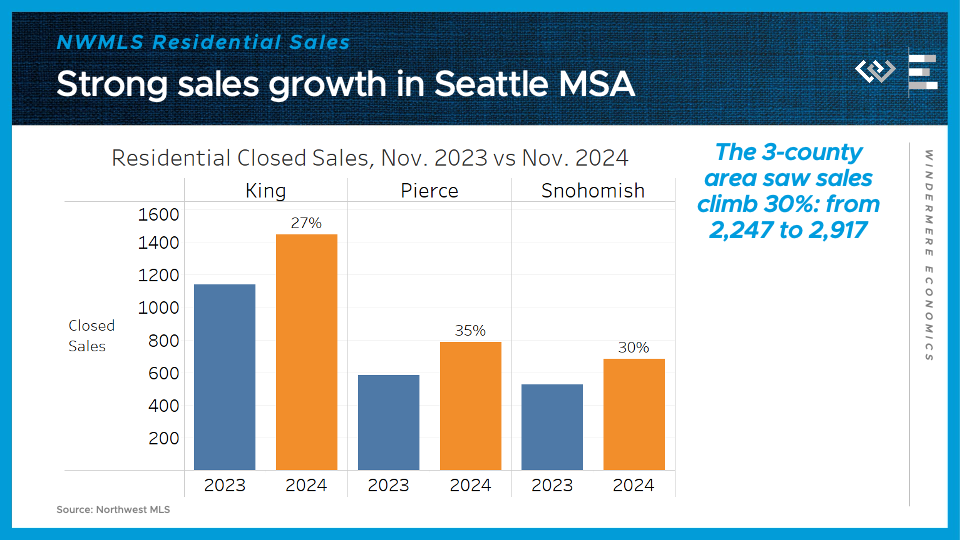
Residential closed sales jumped 27 percent year over year here in King County, which includes Seattle and Bellevue; a whopping 35% down in Pierce County, including Tacoma, and 30% up in Snohomish County, including Everett. So for the 3-county metropolitan area as a whole, that’s a gain of 30% from the same month last year.

The median sale price for those closed sales climbed a little less than last month, when it was closer to 10% annual gains. In November, closed prices climbed 4% in King County, up to $925,000; 5% in Pierce County, up to $565,000; and 8% in Snohomish County, up to $785,000.
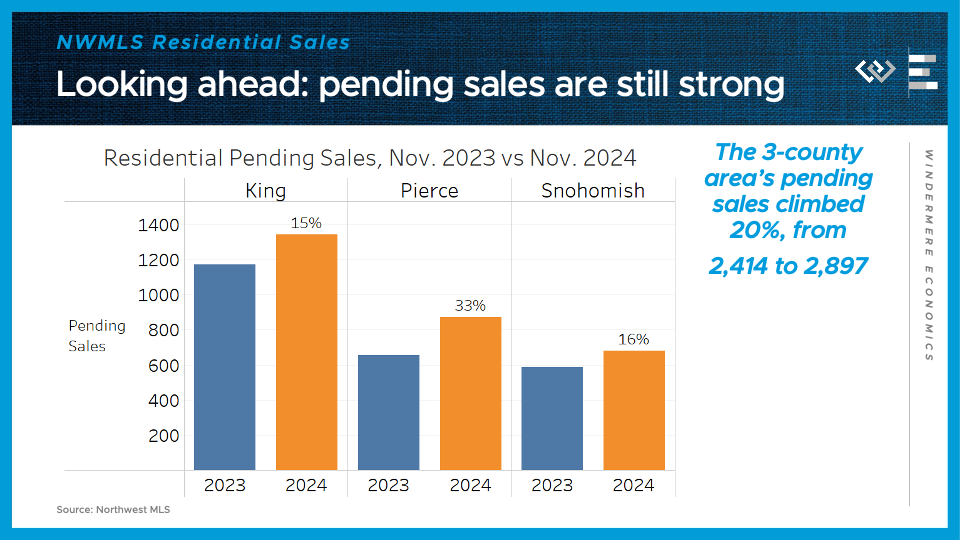
Looking ahead, each of these counties had solid, but somewhat lower annual growth in pending sales than they did in closed sales: 15% for King County; 33% in Pierce, and 16% in Snohomish County.
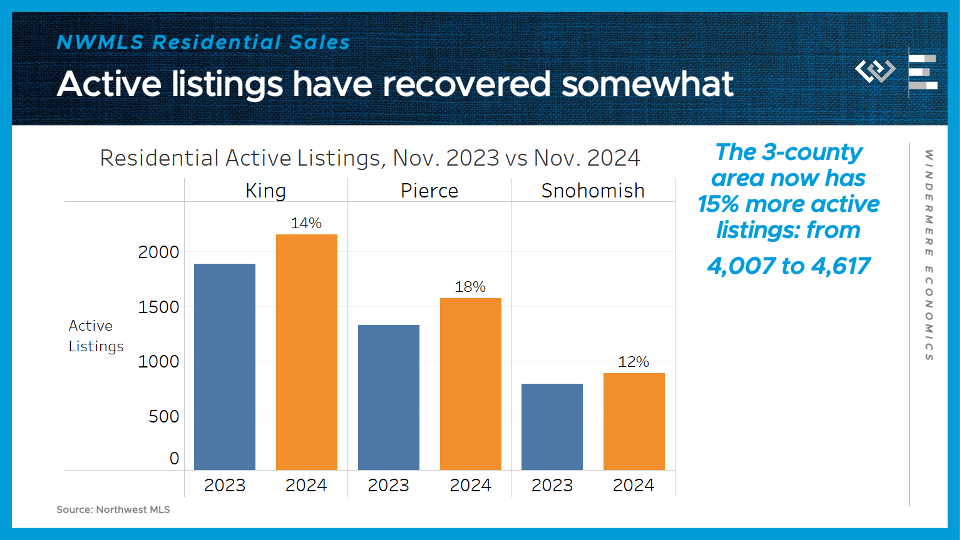
After all those sales, there’s still been a healthy increase in the active inventory of homes available to buy across the metro area, with about 14% more than last year in King County; 18% more in Pierce, and 12% more in Snohomish County, for an overall metro-wide increase of 15%. That’s substantially less than the increase in October, when the 3-county area had 26% more active listings than the year before.
All in all this was another encouraging report showing a much more active market than at the same time last year all around Washington, and it’s good evidence that buyers haven’t just rushed back into hibernation even though mortgage rates rebounded a bit last month.
Local Look: Western Washington Housing Update 11/7/24
This is the latest in a series of videos with Windermere Principal Economist Jeff Tucker titled Local Look where he delivers the key economic numbers to follow to keep you well-informed about what’s going on in the local real estate market.
Hi. I’m Jeff Tucker, principal economist at Windermere Real Estate, and this is a Local Look at the October 2024 data from the Northwest MLS.
All in all this was an incredibly strong report for the Washington housing market, especially in the single-family residential segment, which I’ll be focusing on today.
Here are the four key metrics I watch to get a sense of the market: sales, which tell us a lot about demand; and listings, which tell us about the state of supply.
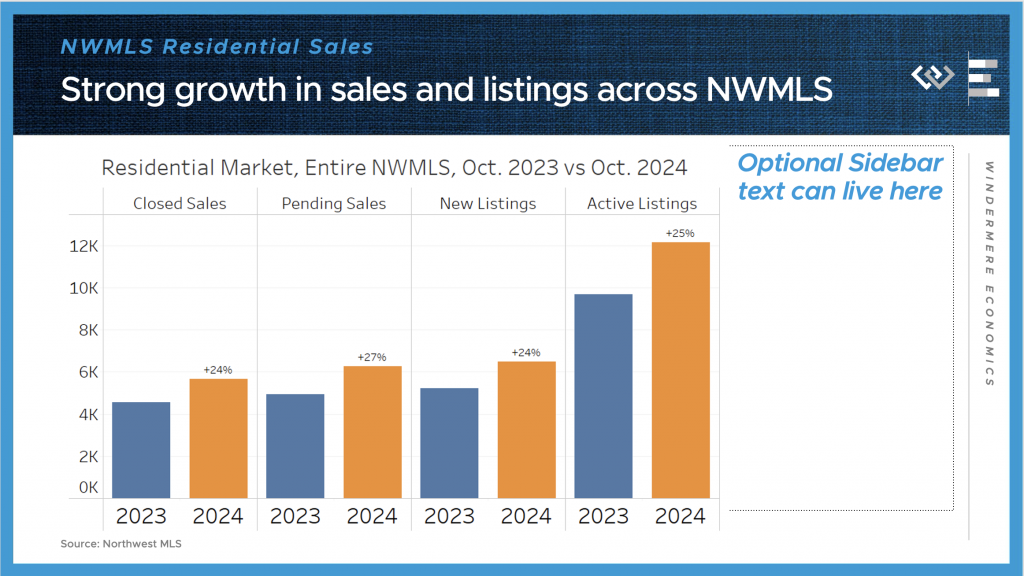
In total we saw residential closed sales climb by over a thousand from the same month last year, or 24%. And, as an important leading indicator for next month’s sales data, pending sales were up 27% year-over-year.
On the supply side, I think of listings as the reservoir of options for buyers to choose from: New listings, which represent the flow of supply, were up 24% in October, while the level of inventory in the reservoir climbed was 25% higher than a year ago. This looks like a market returning to a more healthy balance between buyers and sellers, although of course we expect the usual seasonal decline in inventory to begin any day now.
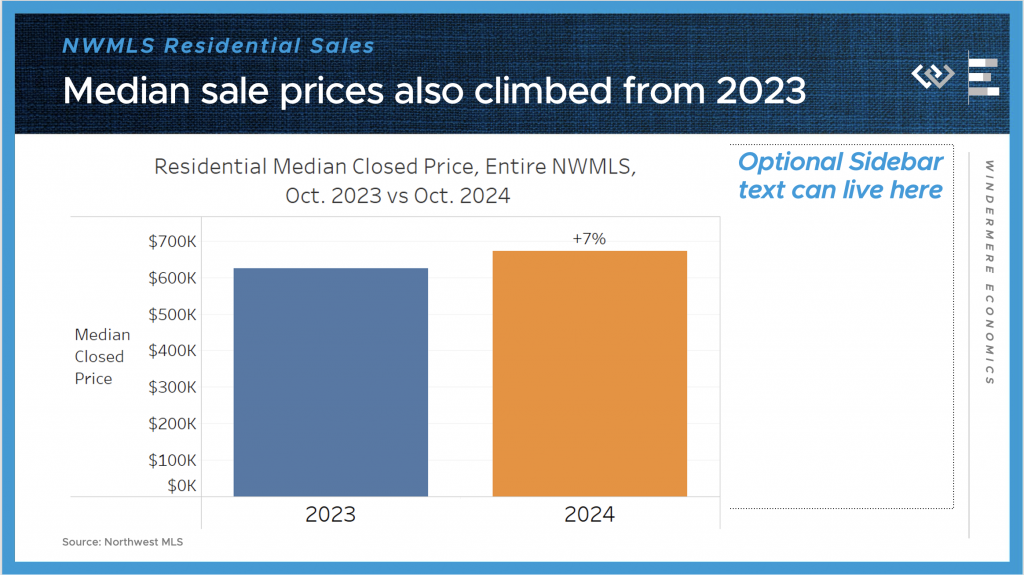
Also impressive to me: across the NWMLS, the median price for those closed single-family sales climbed more than 7% year-over year, from $625,000 to $671,500.
All in all it seemed that buyers finally responded in a big way, to the growth in active listings to choose from, as well as the decline in interest rates over the course of the summer. And while mortgage rates did rebound back up over the course of October, it seems like the news about how much downward progress they made, and the number of options to choose from, all helped to entice buyers to forge ahead with purchasing plans last month.
I can’t get into every local market, but just digging into the three counties that comprise the Seattle MSA, we saw similar trends play out, with especially high activity in King County, which includes Seattle and Bellevue.

Residential closed sales jumped a whopping 33 percent here in King County, and a still impressive 26% down in Pierce County, including Tacoma, and 20% up in Snohomish, including Everett.
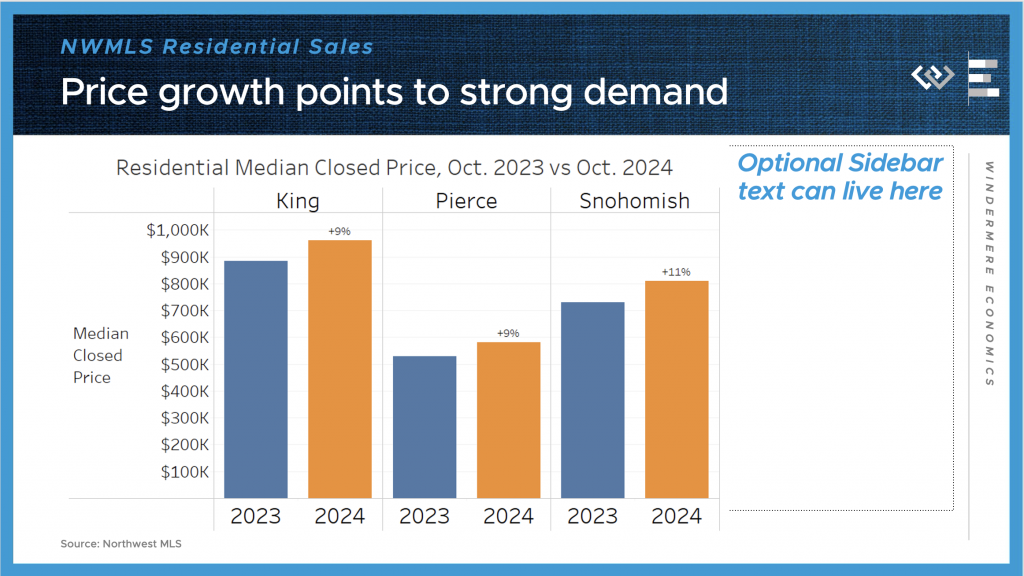
The median sale price for those closed sales climbed 9% in King County, up to $960,000; 9% in Pierce County, up to $580,000; and 11% in Snohomish County, up to $730,000.
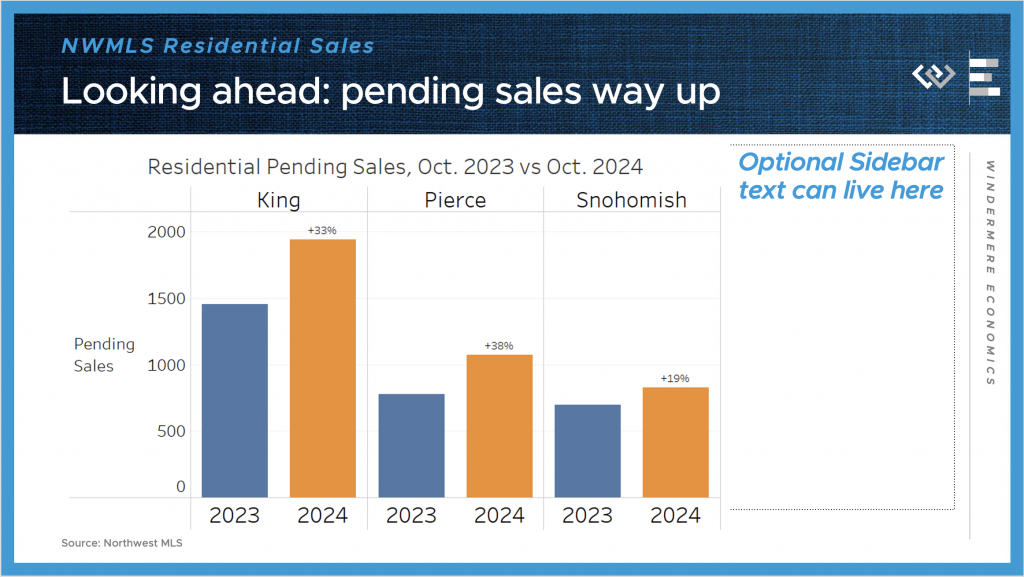
Looking ahead there’s not much sign of a slowdown, as pending sales were up 33% again for King County; 38% in Pierce, and 19% in Snohomish County.
Even after all those sales, there are still a lot more single-family houses on the market around the 3-county region than this time last year, with about 25% more in King County; 31% more in Pierce, and 22% more in Snohomish County.
All in all this was a very encouraging report showing signs of life returning to the local housing markets around Washington, and maybe most importantly, a proof of concept that when mortgage rates fall, even just to near 6%, activity in the market picks up and people get back to moving, buying and selling.
Western Washington Real Estate Market Update

Washington State continues to see strong employment growth, outpacing national numbers with an annual rate of more than 3%. Interestingly enough, despite these substantial job gains, the unemployment rate remains stubbornly high at 5.8%. However, I’m not overly concerned about this because it’s largely due to a growing labor force rather than a declining job market.
Western Washington Real Estate Market Update
Washington State has seen very robust growth over the past 12 months with the addition of 102,600 new jobs, which is 224,000 more jobs than seen at the previous peak in 2008. With this robust growth, it is unsurprising to see the unemployment rate trend down to 5.8%—well below the long-term average of 6.4%. As pleasing as it is to see the unemployment rate drop, it is equally pleasing to see…
")


