
 Facebook
 X
X
 Pinterest
 Copy Link
Numbers to Know 1/14/26: Mortgage Rates Are Moving, Here’s What to Know

This is the latest in a series of videos with Windermere Principal Economist Jeff Tucker, where he delivers the key economic numbers to follow to keep you well-informed about what’s going on in the real estate market.
2026 is already proving to be a busy news year for the housing market, starting with our first number to know:
$200 billion
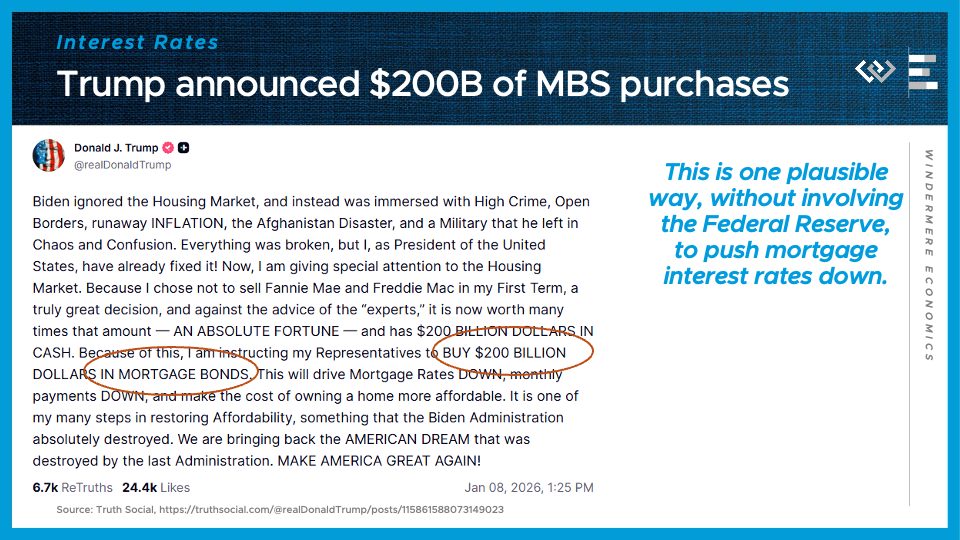
That’s the total value of mortgage-backed securities that President Trump announced on January 8th he’s directed “his Representatives” to purchase, with a stated goal of reducing mortgage interest rates. A big new buyer of mortgages will tend to bid their prices up, which – for bonds – means pushing interest rates down.
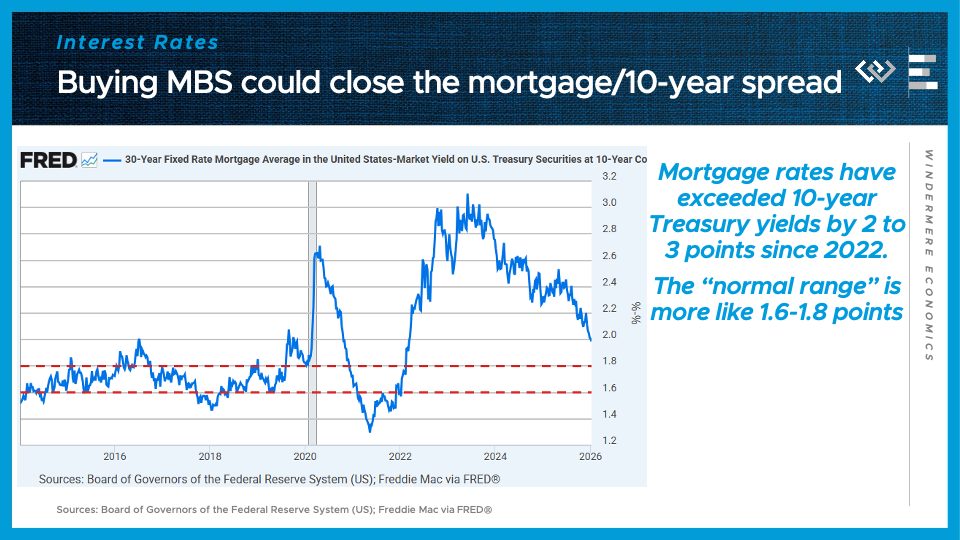
For the last 3 years, mortgage rates have been unusually high relative to the benchmark 10-year Treasury rate, which has been gradually compressing back to a normal range, and this buying spree, evidently by Fannie Mae and Freddie Mac, should accelerate that process of shrinking the spread.
Markets have taken this announcement quite seriously. In just the first day of trading after Trump’s announcement, mortgage rates dropped 15 basis points, bringing us to our second number to know right now:
6.06%
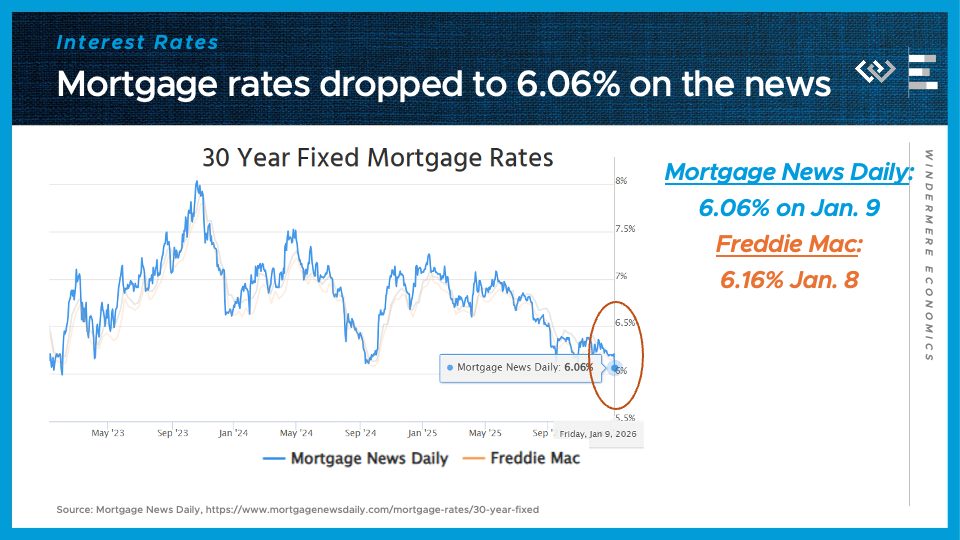
That was Mortgage News Daily’s average 30-year mortgage rate on Friday, January 9th, and that marks the lowest mortgage rate they’ve reported in almost 3 years. Now – trading has been unusually volatile, and there are still a lot of unanswered questions about this new program, but there’s no doubt that in the short term, it has begun moving markets, and I think SOME highly qualified buyers and sellers who start to see mortgage rates in the 5% range will be more motivated to transact this spring.
Another number to know right now:
56,000
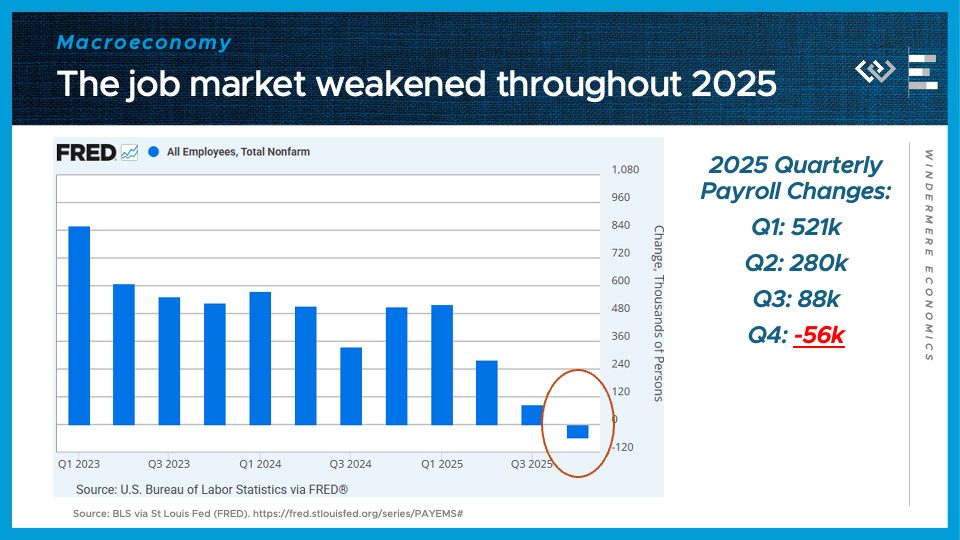
That’s the number of jobs lost on net over the fourth quarter of 2025, capping a year of slowing, and finally shrinking, payrolls in the U.S. economy. Now, other data shows economic activity held up fine in the fourth quarter, so this is not the beginning of a recession, but slowing job growth could help explain why home purchases disappointed in the fourth quarter, despite lower mortgage rates than in late 2024.
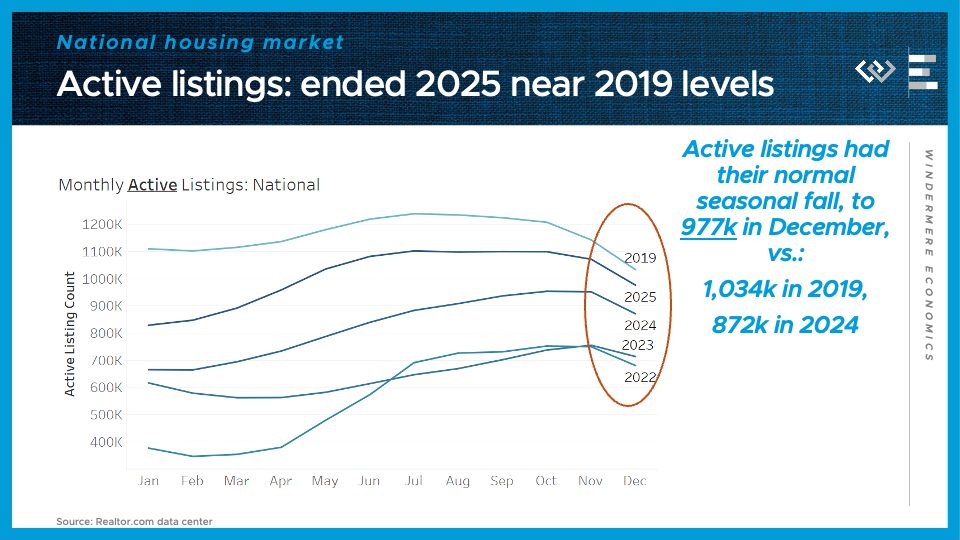
Speaking of housing, 2025 ended with the housing market still just shy of an important benchmark I’ve been watching: the moment when active inventory recovers to its pre-pandemic, 2019 levels. The year ended with just under a million active listings, vs just over a million 6 years ago on the eve of the Covid pandemic.
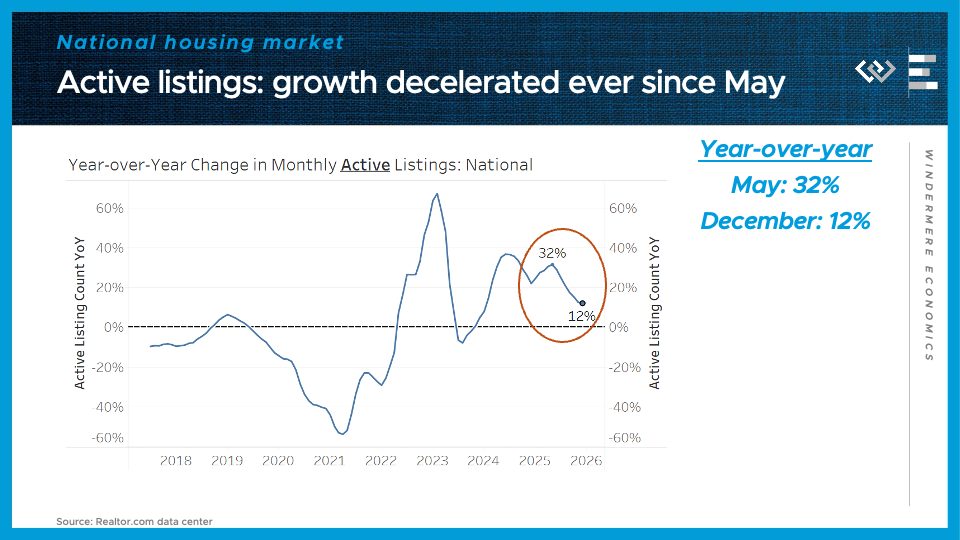
That is still up substantially from this time last year, but the trend of year-over-year listing growth clearly slowed over the course of 2025. That helps explain why 2025 went down as the year of cooling and normalization, but NOT anything like a fire sale or glut of unsold homes. Rather, it’s a market that made a lot of progress back toward normalcy, foretelling a healthy, balanced market in the year ahead.
10 Important People in the Home Buying Process

It takes a village to purchase a home. Though it’s ultimately you who is paying for the property, successfully purchasing a home is a result of several people’s contributions. It helps to know who these individuals are, how they responsibilities pertain to your home purchase, and when you’ll encounter them during your journey. Here are ten important people to keep in mind during the process of buying a home.
10 Important People in the Home Buying Process
1. Real Estate Agent
You’ll be represented by a buyer’s agent throughout the home buying process. Their access to resources and their specialized knowledge will help you find the home you’re looking for and make an offer to the seller. They will be by your side from day one, through closing and beyond. When searching for a real estate agent, ask questions to gain an understanding of their professional expertise as well as their personality. You’ll be working closely together throughout the process, so it’s important to identify someone who is compatible.
2. Mortgage Lender
You need financing to buy a home. Mortgage lenders offer different home loans to match what buyers can afford and what homes they’re looking to purchase. After identifying which lender you’d like to work with, a helpful first step is to get pre-approved for a mortgage by submitting financial information for their review. This helps to speed up the home buying process and solidifies your offer by demonstrating that you’re ready to buy.
3. Mortgage Broker
Your mortgage broker will work with you to find favorable mortgage terms for your home loan. Whereas your real estate agent works with you to find a home and communicates with the seller on your behalf, your mortgage broker works on the financial side of the transaction. Once you’ve chosen the right loan product, they’ll hand things off to the lender.
4. Underwriter
Another key player in the mortgage process is the underwriter. Underwriters review mortgage applications, looking at credit history to assess your ability to pay your loan. A mortgage loan doesn’t get the green light without an underwriter’s approval; if they find any issues, they’ll either deny the loan or require the applicant to provide more information before deciding.
5. Home Inspector
The home inspection is key to the home buying process. It gives you a chance to get a thorough examination of the home to discover which repairs need addressing, if any. The findings of the home inspector’s report will set the table for continued negotiations with the seller and their agent. Buyers will often include a home inspection contingency in their offer to allow for renegotiation or canceling the contract entirely.

Image Source: Getty Images – Image Credit: Jupiter Images
6. Home Appraiser
A professional appraiser will determine a home’s appraised value, which ensures that the lender is loaning the correct amount of money. Home appraisers are third parties to real estate transactions; they have no vested interest in either side of the deal. The home’s square footage, features, and condition all factor into their assessment. If there’s a discrepancy between a home’s appraised value and the loan amount, you and the seller will go back into negotiations.
7. Seller
It takes two to tango. The seller is your counterpart in the home buying process, and they want to sell their home for the best price to the right buyer. Accordingly, you’ll work with your agent on how to make an offer that’s most appealing to the seller. This looks different for each real estate transaction. For example, if you find yourself in a bidding war, the seller may value offers that show flexibility toward the inspection and contingencies. Talk to your agent for more information.
8. Listing Agent
The listing agent represents the seller. Your agent will work with them to iron out the details of your offer and move the deal along toward completion. After the home inspection, the listing agent will also be the main point of contact for any repair requests.
9. Title Company
Before the home is officially yours, a title company will conduct a search of the property’s history and public records to make sure its title is in good legal standing. Titles and deeds have very specific language that makes the transfer of ownership official. Title companies will make sure that everything in these documents is properly recorded during the closing process.
10. Homeowners Insurance Company
Once you’ve purchased a home, you need to protect it. Homeowners insurance policies cover your home, your belongings, injury, or property damage to others, and living expenses if you are temporarily displaced from your home due to an insured disaster. The coverage you’ll need will depend on your home’s location and condition, but what’s most important is that you’re fully protected as a homeowner.
For more information on the home buying process, connect with a local Windermere agent:

Featured Image Source: Getty Images – Image Credit: grandriver
Homeownership Terms to Know: Pre-Approval, Pre-Qualification & More

Throughout the home buying process, you’ll encounter several checkpoints. At every stop, you’ll get closer to the ultimate goal of purchasing your next home. Each one satisfies unique criteria required to become a homeowner, and each one has its own terminology. Before you begin your home buying journey, it’s helpful to know about pre-approval, pre-qualification, and proof of funds, and the role they play in a real estate transaction.
Pre-Qualification and Pre-Approval
What is pre-qualification?
Pre-qualification and pre-approval go hand in hand, but one precedes the other. Pre-qualification is a very early step in the home buying process leading to pre-approval. After sharing your financial information with your bank or lender, they’ll give you an estimate of the loan amount you can expect to qualify for. During this time, you’ll learn about the different home loans available to you to help you decide which is best. Pre-qualification usually only takes a few business days.
What is pre-approval?
A sibling to pre-qualification, pre-approval takes things a step further. Once you submit a mortgage application, you’ll provide your lender with the required information to perform a financial background check to assess your creditworthiness. You’ll get a pre-approval letter showing the lender’s offer of a specific loan amount, so you’ll know how much you can borrow. You’ll also get a better understanding of what interest rate you can expect to pay on your loan. Mortgage pre-approvals are typically valid for 60 to 90 days.
More information on the benefits of pre-approval and when to get pre-approved:
Once you’ve gone through the pre-approval process, it’s helpful to know which homes you can afford. Use our free Home Monthly Payment Calculator by clicking the button below. With current rates based on national averages and customizable mortgage terms, you can experiment with different values to get an estimate of your monthly payment for any listing price.


Image Source: Getty Images – Image Credit: Thitiphat Khuankaew
What is a proof of funds letter?
Simply put, in real estate, a proof of funds letter is a document that proves to the seller that you have enough money available to purchase the home. Proof of funds letters may vary depending on the terms of the transaction. For example, if you’re making an all-cash offer, your letter will prove that you have enough liquid cash to complete the deal.
For more information on the home buying process, read our blog post on searching for a home:
How to Search for a Home: Buying Guide
Featured Image Source: Getty Images – Image Credit: mixetto
How to Reduce Your Interest Rate: Mortgage Buydowns

This blog post contains contributions from Penrith Home Loans.
When mortgage rates are up, prospective buyers can often feel like they’re at a disadvantage as they go about securing a home loan. Fortunately, there are ways to lower your interest rate to make your monthly mortgage payments more affordable.
What are mortgage buydowns?
A mortgage rate buydown is a form of financing that allows you to secure a lower interest rate on your mortgage by paying more money upfront in the form of discount points, also known as mortgage points, at closing. Each discount point is equal to one percent of your total loan amount. Especially attractive in times of high mortgage rates, buydowns are offered by sellers, builders, or lenders depending on the transaction. There are two main types of mortgage interest rate buydowns: permanent and temporary.
Permanent Mortgage Buydowns
With a permanent interest rate buydown, typically the borrower, seller, or builder will contribute to the cost of buying down the rate permanently. In this situation, the borrower qualifies at the bought-down rate for the life of the loan.
Temporary Mortgage Buydowns
A temporary interest rate buydown provides cash flow for the borrower during the temporary period, but they still qualify at the higher note rate. Typically, the seller or builder will contribute to the cost of buying the rate down temporarily.
Use our Home Monthly Payment Calculator to experiment with different down payments, principal amounts, interest rates, taxes, and more for any listing price.
How do temporary mortgage buydowns work?
Temporary mortgage interest rate buydowns have their own unique structure. Below are three common types:
- 1-0 Buydown Mortgage: The borrower gets a 1% discounted interest rate for the first year.
- 2-1 Buydown Mortgage: The borrower gets a discounted interest rate for the first two years of the loan. The first year, the interest rate is 2% lower, decreasing to 1% lower the second year.
- 3-2-1 Buydown Mortgage: The borrower gets a 3% discounted rate the first year, dropping to 2% in the second year and 1% in the third year.
Although they share certain characteristics with adjustable-rate mortgages (ARMs), temporary mortgage buydowns are slightly different. ARMs initially have a fixed interest rate period. Once the adjustable-rate period kicks in, both the interest rate and monthly payments are subject to change. With buydowns, the buyer’s interest rate doesn’t change; either the seller or lender covers part of the interest payments as outlined by the buydown’s structure.

Image Source: Getty Images – Image Credit: kate_sept2004
Should I permanently buy down my mortgage?
Though buying down your mortgage interest rate permanently can make the payments more affordable, if you are contributing to this cost, make sure you can withstand the heavier financial load before proceeding. It also depends on how long you plan to live in the home. For example, if you plan to move shortly after buying, the short-term savings on your mortgage may not yet break even on your upfront costs by the time you’re ready to purchase again.
Pros of Mortgage Buydowns
- Savings on monthly mortgage payments
- A lower rate means you could qualify for a higher loan
- Discount points = prepaid mortgage interest, which is often tax-deductible
Cons of Mortgage Buydowns
- Higher upfront costs of buying a home
- If payments increase, higher risk of foreclosure
- Less cash available for remodeling, home improvements, etc.

Image Source: Getty Images – Image Credit: cnythzl
How much can I save with a mortgage buydown?
Here’s an example of the savings you could see with a 3-2-1 temporary mortgage buydown. Let’s say you qualify for a 30-year mortgage with a $400,000 loan amount at an interest rate of 7%. With a 3-2-1 buydown, you’d pay a 4% interest rate the first year, 5% the second year, and 6% the third year. From year four on, you’d pay 7%.
| Purchase Price | Down Payment | Loan Amount | Interest Rate | APR | Loan Term |
| $500,000 | $100,000 | $400,000 | 7% | 7.125% | 30 years |
3-2-1 Temporary Mortgage Interest Rate Buydown
| Year 1 | Year 2 | Year 3 | Years 4-30 | |
| Interest Rate | 4% | 5% | 6% | 7% |
| Number of Payments | 12 | 12 | 12 | 336 |
| Monthly P&I Payment | $1,909.66 | $2,147.29 | $2,398.20 | $2,661.21 |
| Total PITI Payment | $1,909.66 | $2,147.29 | $2,398.20 | $2,661.21 |
| Monthly Reduction | $751.55 | $513.92 | $263.01 | – |
- Calculations provided by Penrith Home Loans
- Temporary buydown cost as % of purchase price 3.67%
With this structure, you’d save $9,018.60 the first year, $6,167.04 the second, and $3,156.12 the third, for a total three-year savings of $18,341.76.
Thinking about buying a home? Connect with a local, experienced Windermere agent to begin your home buying journey:
Featured Image Source: Getty Images – Image Credit: kate_sept2004
What Is an Adjustable-Rate Mortgage (ARM)?

An integral part of the formula to successfully buying a home is securing the correct amount of financing. Once you’ve found the home you’d like to pursue, one of your primary tasks is exploring different loan products to see which best fits your situation. Eventually, you’ll come to a fork in the road where you’ll need to decide between a fixed-rate mortgage and an adjustable-rate mortgage (ARM). The following information will help you gain a better understanding of ARMs to help you decide whether they’re right for you.
What Is an Adjustable-Rate Mortgage (ARM)?
After your down payment, your mortgage will finance the remainder of your home purchase. Whereas fixed-rate mortgages allow you to lock in a specific interest rate and payment for the life of your loan, adjustable-rate mortgages’ interest rates will fluctuate over time, thus changing your loan payment. It’s typical for ARMs to begin with a low introductory interest rate, but once that first stage of the loan has passed, they will begin to shift up and down. ARMs generally have a cap that specifies the maximum rate that can occur for that loan.
Let’s say you secure an adjustable-rate mortgage with 30-year terms, the first five of which are at a fixed rate. When the variable interest portion of the loan kicks in, your mortgage’s fluctuations will be measured against an index. If the index is higher than when you secured the loan, your rate and loan payment will go up—and vice versa. How often your ARM rates change depends on your agreement with your lender. Talk to your mortgage broker to learn more about the characteristics of adjustable-rate mortgages.

Image Source: Getty Images – Image Credit: FG Trade
Different Types of Adjustable-Rate Mortgages (ARMs)
Payment-Option ARM: You’ll have flexibility to choose your monthly payments with a payment-option ARM, including interest-only payments and minimum payments that don’t cover interest. These loan products can get home buyers into hot water quickly when rates increase.
Interest-Only ARM: With an interest-only ARM, you pay just the interest on the loan for a specified introductory period, then the principal payments kick in on top. The longer the introductory period, the higher your payments will be when the delayed principal payments enter the equation.
Hybrid ARM: As outlined above, a hybrid ARM begins with a fixed-rate introductory period followed by an adjustable-rate period. Typically, a hybrid ARM’s fixed-rate period lasts anywhere between three to 10 years, and its rates adjust at an agreed-upon frequency during the adjustable-rate period, such as once every six months or once a year.
Pros and Cons of an Adjustable-Rate Mortgage (ARM)
|
Pros |
Cons |
|
|
|
|
|
|
Home Monthly Payment Calculator
To get an idea of how your mortgage payment will fit into your budget, use our free Home Monthly Payment Calculator by clicking the button below. With current rates based on national averages and customizable mortgage terms, you can experiment with different values to get an estimate of your monthly payment for any listing price.
For more information on financing your next home purchase, connect with an experienced, local Windermere agent.
Featured Image Source: Getty Images – Image Credit: Pekic
The Difference Between a Real Estate Agent and a Mortgage Broker

Throughout the course of buying a home, you’ll work with a variety of professionals, all with specific training to help you through each stage of the process. With such a cast of specialists around you, it’s helpful to know everyone’s responsibilities and which questions to ask whom. One important distinction to be made is the difference between your real estate agent and your mortgage broker. The following information is a guide to understanding where they differ and how each of them helps you to buy a home.
Real Estate Agent vs. Mortgage Broker
Both real estate agents and mortgage brokers are licensed professionals who play a pivotal role in the home buying process by bringing parties together to get a deal done. However, that’s about where the similarities end.
Real Estate Agent
Your real estate agent will represent you throughout the buying process. Their access to the Multiple Listing Service (MLS) allows them to search the widest network of available homes to find the ones that match your budget and criteria. They’ll also receive alerts on open houses and are usually the first to know when new listings hit the market.
Once you’ve identified a home you’d like to pursue, they’ll assist you in putting together your offer, negotiating with the listing agent representing the seller, and guide you through the counteroffer process (should there be one). Once the seller accepts your offer, your agent will help you negotiate any final repair requests found in the home inspection and assist you through closing until you’ve received the keys to your new home.
The point is: your agent will be with you throughout your home buying journey, from start to finish. They are an invaluable resource for local market knowledge and real estate expertise. Though they will not execute the financial aspects of a home purchase for you, (that’s where your mortgage broker comes in), they can recommend trusted lenders with whom you can apply for and secure a home loan.
For more information on working with an agent, visit our Home Buying Guide:

Mortgage Broker
Mortgage brokers work on the financial side of a real estate transaction, representing buyers to find them favorable mortgage terms when shopping for a home loan. They connect borrowers to lenders by researching the various fees and rates associated with obtaining a mortgage, accessing the buyer’s financial creditworthiness, and coordinating paperwork. Mortgage brokers are not responsible for loaning any money. Once they’ve found the right lender and loan product for their client, they hand the baton to the lender, who will then disburse the funds at the appropriate time.
Working with a mortgage broker can save you time and money. In some cases, they may be able to get the lender to waive certain fees and are experts at finding the best deal for their clients among a vast array of loans and lenders. Mortgage brokers are instrumental in getting your financing for your home purchase secured and provide guidance on which loan products may work best for you.
For more on the financial aspects of a home purchase, read the following:

Image Source: Getty Images – Image Credit: kate_sept2004
Questions to Ask Your Real Estate Agent and Mortgage Broker
Now that you know a bit more about the respective responsibilities of real estate agents and mortgage brokers, here are a few common questions to ask when conducting interviews:
|
Real Estate Agent |
Mortgage Broker |
|
|
|
|
|
|
|
|
|
|
|
|
|
|
To connect with an experienced, local Windermere agent, click the button below:
10/25/2021 Housing and Economic Update from Matthew Gardner

This video is the latest in our Monday with Matthew series with Windermere Chief Economist Matthew Gardner. Each month, he analyzes the most up-to-date U.S. housing data to keep you well-informed about what’s going on in the real estate market.
Hello there! I’m Windermere Real Estate’s Chief Economist, Matthew Gardner, and welcome to the latest episode of Mondays with Matthew.
A few weeks ago, one of my viewers on You Tube sent me a note asking when I was expecting mortgage rates to start to rise and, if I believed that they were going to go up, how fast will they rise, and what impacts will higher rates have on home prices.
Well, I would like to thank this particular viewer for the question, and it’s going to be the topic of today’s video.
How Mortgage Rates Are Set
But before we start looking at the future of mortgage rates, I was speaking to some of our interns here at the office a while ago and one of them asked me to explain how mortgage rates are set and – because this is somewhat pertinent to today’s topic – I thought that I’d take just a minute or two to explain to you how this all works.
Of course, there are a lot of factors that impact the rate that a home buyer themselves will get, and they include credit quality, loan-to-value ratios and the like, but the base rate is set not by looking at a home buyer, but at the economy itself and, specifically, the bond market – and even more specifically, the interest rate of 10-year US treasuries.
Now, if you’re asking yourself why 30-year mortgages are based off 10-year bonds and not 30-year? Well, that would be a good question, and this is the answer. You see we move, on average, every 10 years and that’s why!
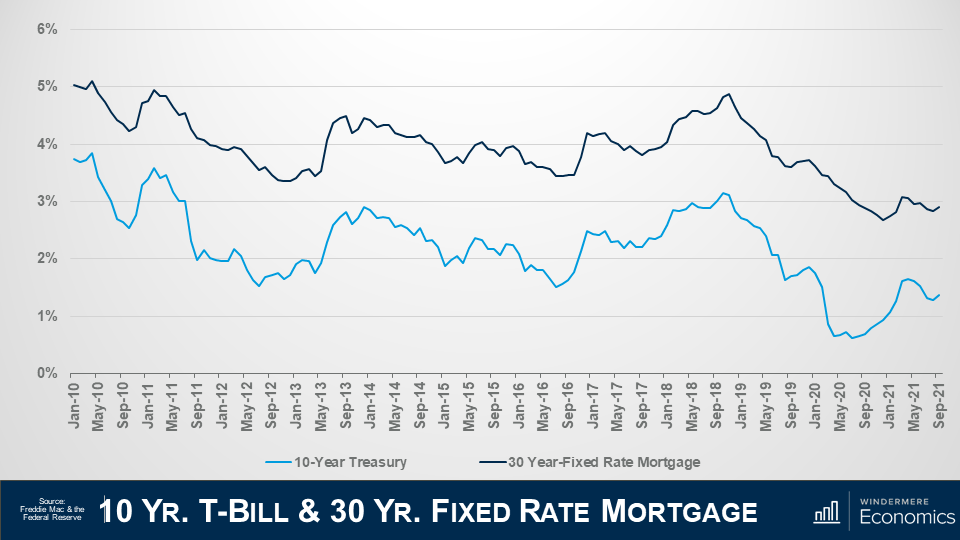
Here is a chart showing the average yield – or interest rate – on 10-year treasury bills by month going back to 2010 in light blue, and the average 30-year mortgage rate in dark blue. I hope that you can see the tight relationship they have to each other.
Of course, there are times when bond yields can go down and mortgage rates rise, and vice-versa but, in general, they track each other pretty closely.
And if you’re wondering why the rates aren’t simply the same, well it’s because a treasury bond has no risk – as its backed by the US government – but there is some risk associated with a mortgage, so buyers of mortgage bonds expect a premium to be added because of this risk, and this has averaged just over 1.5% since the 30-year mortgage came into being back in the early ‘70’s.
Now, there are some people out there who think that the interest rate on 10-year treasuries doesn’t set mortgage rates, rather its better to track the interest paid on mortgage bonds and, although I do see why they might think this, the base mortgage rate is actually set by treasury yields and the interest on mortgage bonds is set using that base and adjusting it to manage the prevailing risk tolerance that investors are prepared to accept so I believe that watching movements in the interest paid on 10-year treasuries is the right way to go.
And that, in essence, is how the 30-year mortgage rate is set.
The History of Mortgage Rates
If you are a regular viewer of these videos you will now that I like to start off with some context to the subject I am addressing and this chart will show the average rate for conforming 30-year fixed rate mortgages going back to their genesis in the early 1970’s.
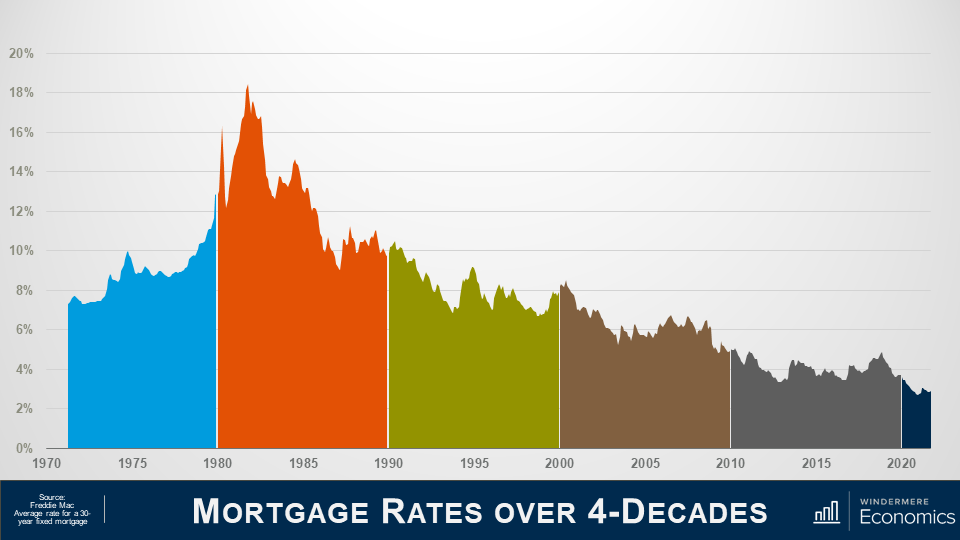
Back in ‘71 rates were in the mid-7% range, rising to just under 10% in ‘74, before pulling back but, as you can clearly see, they started to spiral upward in ’77, ending the decade at almost 13% and if you’re wondering what led to this massive jump, well this was because the country had entered a period of high inflation.
In the ‘70s the country was pushed into a recession basically due to an oil embargo that led to the price of oil quadrupling and that led to a period of so-called stagflation which is when inflation rises, and economic activity slows.
And in the early ‘80’s we entered a period of so-called hyperinflation, as another oil embargo was took hold and the Fed was forced to step in and raised short-term rates which led rates along the yield curve to rise and this – of course – included 10-year treasuries which hit 15.3% in the fall of 1981 and that, as we have discussed, caused mortgage rates to hit an all-time high in October of 1981 at close to 18.5%. Rates then started to pull back and
In the 90’s, rates started to trend lower but jumped again in ’94 as the Fed tightened monetary policy given the significant growth that the country was seeing, but they started to pull back in the second half of the decade, falling to the mid-6’s before notching higher in ’99.
In the 2000’s, rates dropped to 5.3% in 2003 as the housing market boomed but, as we all know, it wasn’t all unicorns & rainbows in this decade of what was then – historically low rates.
The housing crash led the Fed to jump in by cutting interest rates, but they also started a massive purchase of mortgage bonds at very low interest rates as they were happy to take a low return as long as it stabilized the housing market. As a result of their efforts, mortgage rates fell almost a full percentage point, averaging just a hair above 5 % in 2009.
Riding the wave of low bank borrowing costs, mortgage rates entered the new decade around 4.7% and continued to fall steadily, dropping to the mid-3’s by 2012. But in 2013 you can see that rates headed higher. Why? Well, a big part of this has to do with some panic in the bond market, but we will get to that shortly.
Anyway, rates went up in 2014 before dropping to 3.85% in 2015 as the market calmed down.
They rose again after the 2016 presidential election, reaching their peak at the end of 2018 and start of 2019, but still ending the decade below 4%.
As for the current decade, well, it’s all been about COVID-19.
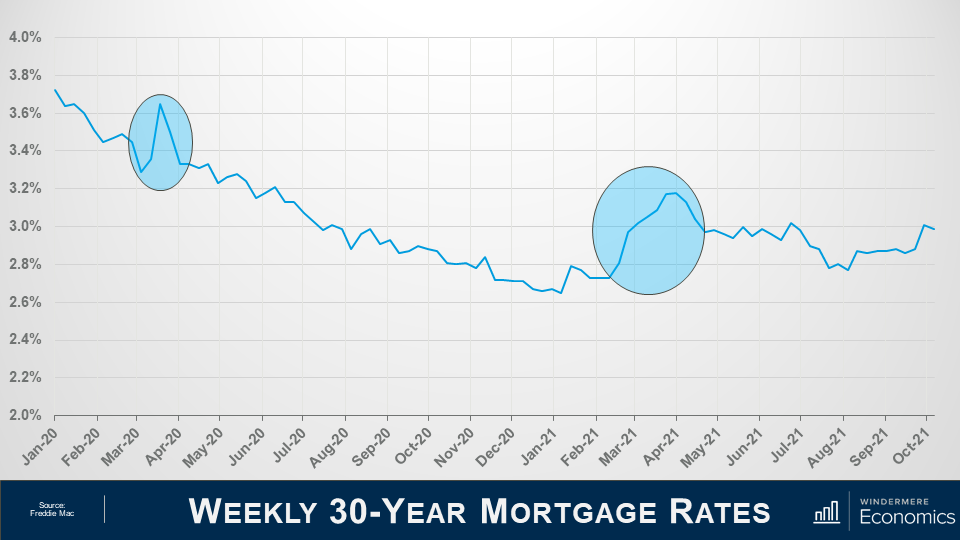
To understand what’s happened over the past couple of years, we need to look at the weekly average rate and I am sure that you have noticed the first spike in the graph.
And it was totally due to the Coronavirus which created an unprecedented situation for all rates (not just mortgages, but US Treasuries and everything else).
You see, investors were panicking during the early stages of the pandemic, not just because the country – essentially – shut down for a brief period, but there were rumors about a thing called forbearance, and investors were panicking that they would not get paid for the mortgage bonds they held, and they did what we all do when we get worried about the economy and, specifically, our investments. They get out of their investment positions and into cash and that’s absolutely what they did, but I should add that I am not talking about them stashing dollars under the mattress. No, they moved into cash positions in financial markets, which are the most liquid, nimble place an investor in the US can be.
And with a lot of institutions and individuals getting out of bonds and not many buyers out there, what happened to rates? That’s right, they rose to attract buyers and rise they did. So much so, in fact, that on a single day in March of 2020, mortgage bonds prices changed 5 times! Quite unprecedented.
Anyway, the Fed reverted to their old playbook and went on a massive bond buying spree with the biggest ever purchase of mortgage-backed securities on Thursday March 19 but, quite remarkably, they announced the very next day that they were going to buy even more. How much more, you ask… Well, they decided to buy three times more than the record purchase they made just the day before!
And because of this, rates dropped dramatically and continued to pretty much head lower for the rest of the year and into early 2021.
But then the music stopped, as you can see in the second highlighted spike in the above graph.
You see, a special election was being held in Georgia and the bond market decided to take a conservative stance prior to the election and that led rates higher again. But the election wasn’t the only reason why rates rose.
You see, COVID 19 cases that were dropping, improved vaccine distribution appeared to be in place, there were several stronger than expected economic reports released, and progress on a fiscal stimulus package. All of these factors led rates higher because, as you know, when economic news is positive, that is actually bad for bond yields as people move back into equities and out of bonds which is obviously bad for mortgage rates as bonds need to offer a higher interest rate to attract the few buyers that were out there.
Mortgage Rate Forecast
So that’s where we are today, but what of the future?
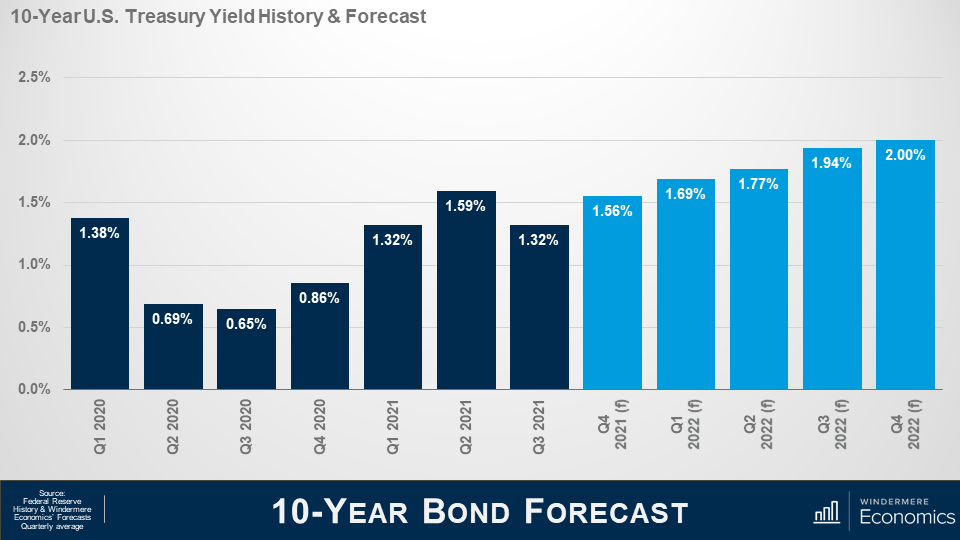
Here is my forecast for 10-Year treasuries through the end of next year and you will see that I am looking for rates to rise gradually as we move into next year and this will lead mortgage rates to start notching higher as well.
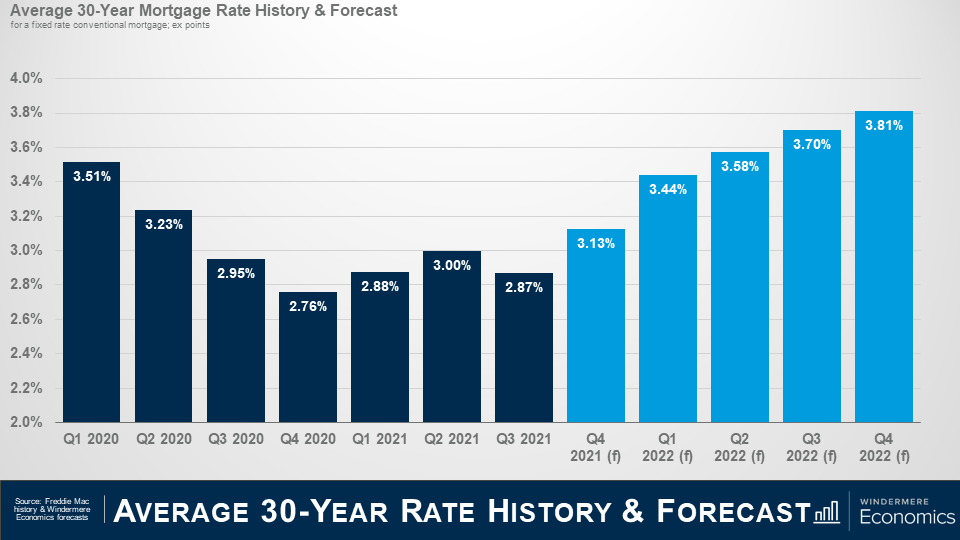
And here is my forecast for mortgage rates. Although they should move higher, I am still not seeing rates break above 4% until 2023 at the earliest and – even as they start to increase – I really don’t see it as a major deterrent to home buyers.
But before you start to say that this is only one person’s forecast and it could be wrong, lets look at my forecast compared to some of my industry colleagues.
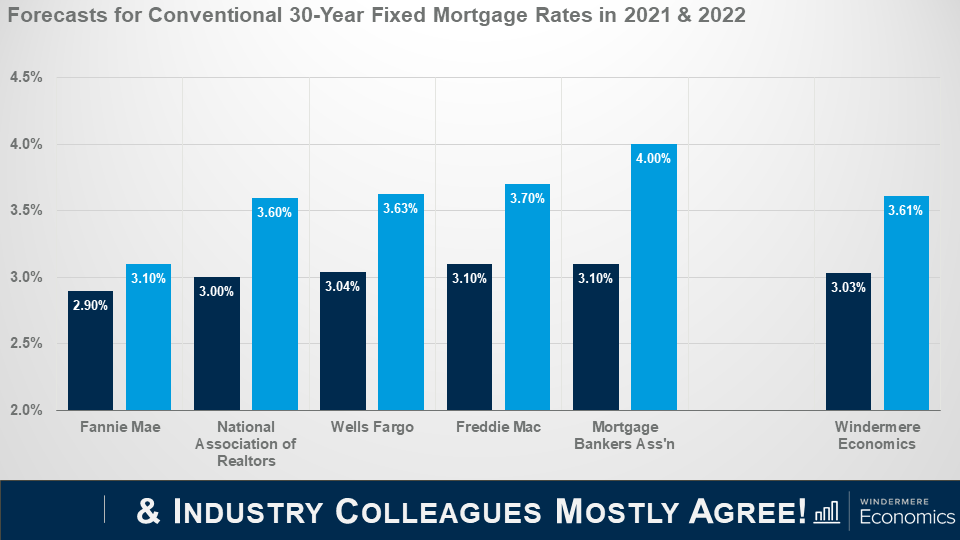
As you can see, we are all in a pretty tight range when it comes to forecasting the average rate this year and next.
The bottom line is that although rates will rise, they will remain very competitive when compared to historic averages and the upward trend in rates is unlikely to have any significant impact on prices. That said, many markets are already having an affordability crisis and rising rates will certainly act as an additional headwind to price growth; however, it would take a significantly greater increase in rates to negatively impact prices.
Well, I hope that you have found this month’s discussion to be interesting. As always if you have any questions or comments about this topic, please do reach out to me but, in the meantime, stay safe out there and I look forward the visiting with you all again, next month.
Bye now!
7/26/2021 Housing and Economic Update from Matthew Gardner
This video is the latest in our Monday with Matthew series with Windermere Chief Economist Matthew Gardner. Each month, he analyzes the most up-to-date U.S. housing data to keep you well-informed about what’s going on in the real estate market.
Hello there! I’m Windermere Real Estate’s Chief Economist, Matthew Gardner, and welcome to the latest episode of Mondays with Matthew.
This month, we are going to take another look at forbearance activity across the U.S. Now I know that we have talked about this subject several times over the past year, but it is worthwhile to look at it again if only for the fact that the program stopped taking new applications for forbearance at the end of June.
So, let’s take a look at where we were when the forbearance program started and where we are today.
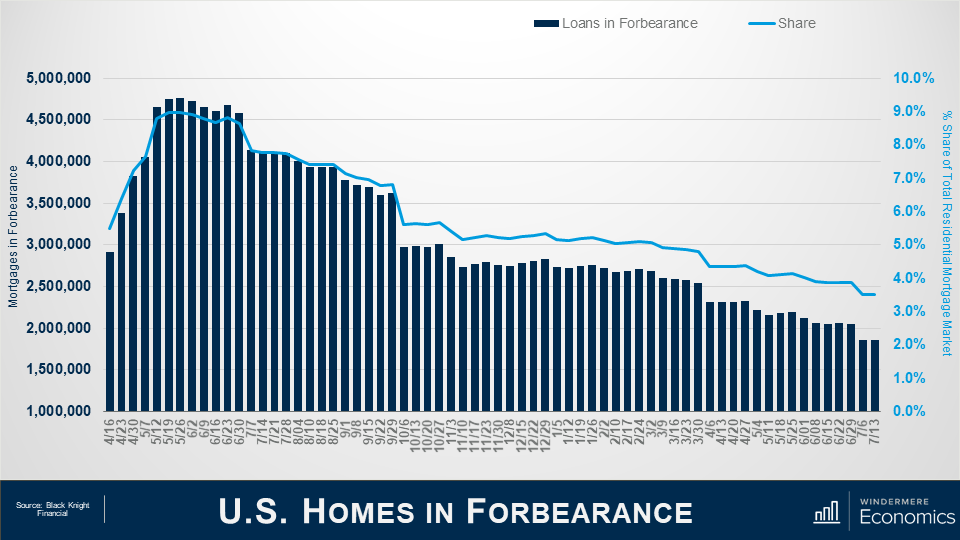
And as you can see from this first chart, the situation today is a vast improvement from where we were last May when there were more than 4.76 million homes in the program. For context, that meant that more than 9% of all homes with a mortgage were in the program last May – a huge number.
But the latest data from Black Knight Financial shows that – by mid-July of this year – the number had dropped to just over 1.86 million homes, or roughly 3.5% of houses with a mortgage.
This is certainly a pretty impressive recovery, as it means that 2.9 million homeowners left the program between May of 2020 and mid-July 2021.
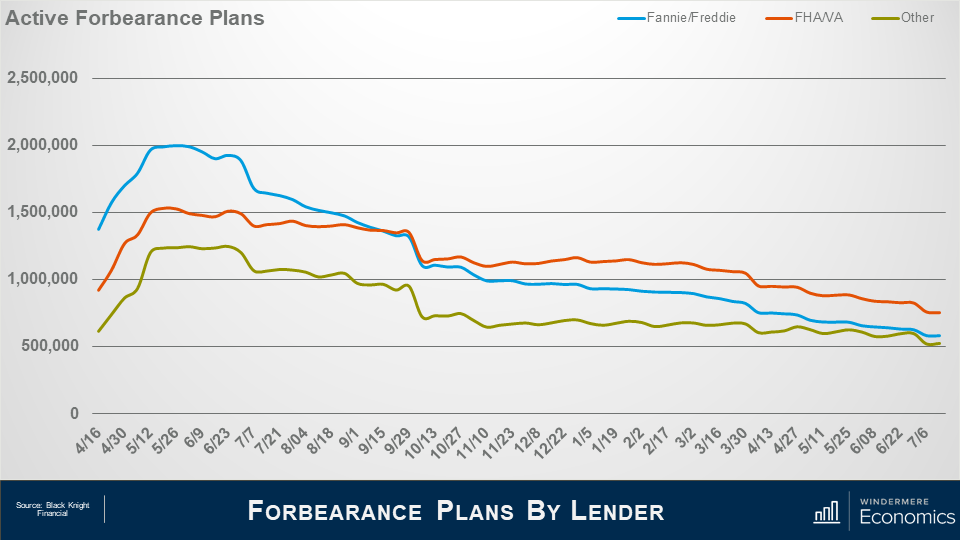
And when we look at the makeup of mortgages in forbearance, the largest share came from loans backed by Fannie Mae and Freddie Mac – not surprising given the size of their mortgage portfolio – with, at the peak, just shy of two million homes in the program – roughly 7.2% of their total portfolio.
But that number has now dropped to 582,000 or just 2.1% of loans outstanding.
Loans backed by the FHA or VA also peaked last May at about 1.53 million or 12.6% of their portfolio.
But today that number has dropped to 755,000 or 6.2% of the mortgages they hold.
And finally, loans showed here as “other” represent private label securities or portfolio loans, and it’s interesting to see that their numbers didn’t peak until late June when just short of 1.25 million homes – or 9.6% of their portfolio – were in the program.
However, today that number had dropped to 524,000, or 4% of mortgages backed by these entities.
What I see from the slides that we have looked at is that the number of active forbearance plans continues to fall; however, the pace of the drop has certainly slowed over the last quarter or so.
After seeing a monthly drop of 12% in April – as a large volume all plans hit their 12-month review date – the pace of improvement has since slowed to just 5% over the past 30 days.
Although the number of homes in forbearance is still higher than I would like to see, fewer than 4% of all mortgages are in the program and we haven’t seen this level since April of 2020, just as the pandemic was kicking in.

As we look forward, you can see that almost 600,000 homes currently in forbearance are coming up for review so the potential for a greater rate of improvement in the overall number of homes in the program is certainly possible – but not guaranteed.
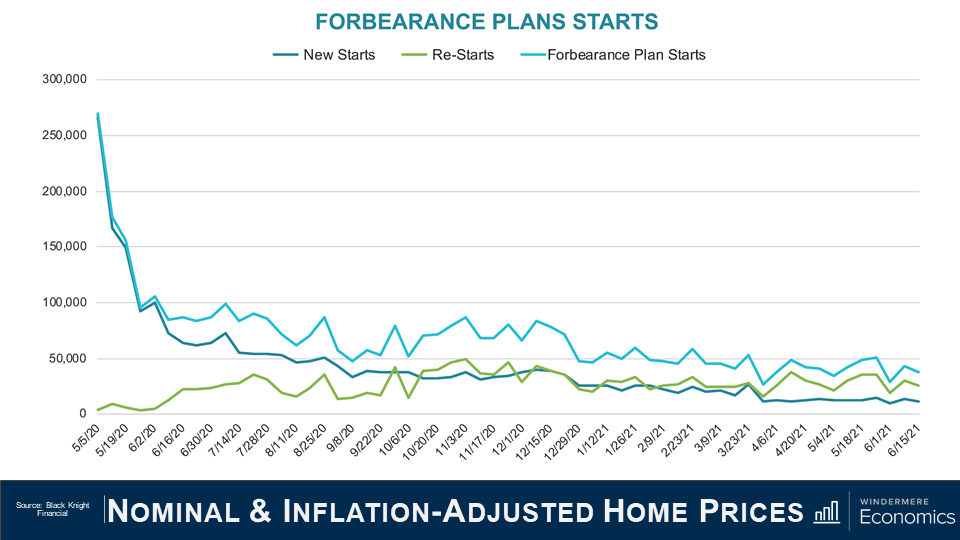
Unsurprisingly the number of homes entering the program for the first time as well as repeat plan starts is lower than we saw last summer but again the pace of improvement has slowed. That said, overall starts are down by 3% on the month and when we combine new and repeat starts the number is 3 to 4% lower.
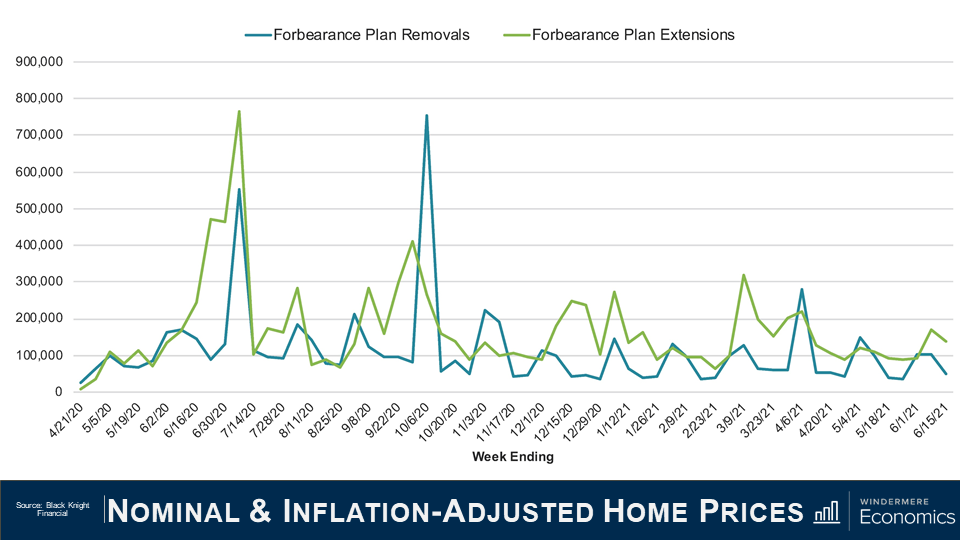
Of the roughly 460,000 homes in forbearance that were reviewed for either extension or removal from the program in the first two weeks of June, 33% left the program while 67% had the term extended. This is a lower removal rate than we saw during the first two weeks of either April or May, but I expect to see more homeowners come out of the program, but only as long as the country continues to reopen, and that is not a certainty given the rise of the Delta and Lambda variants of the COVID-19 virus.
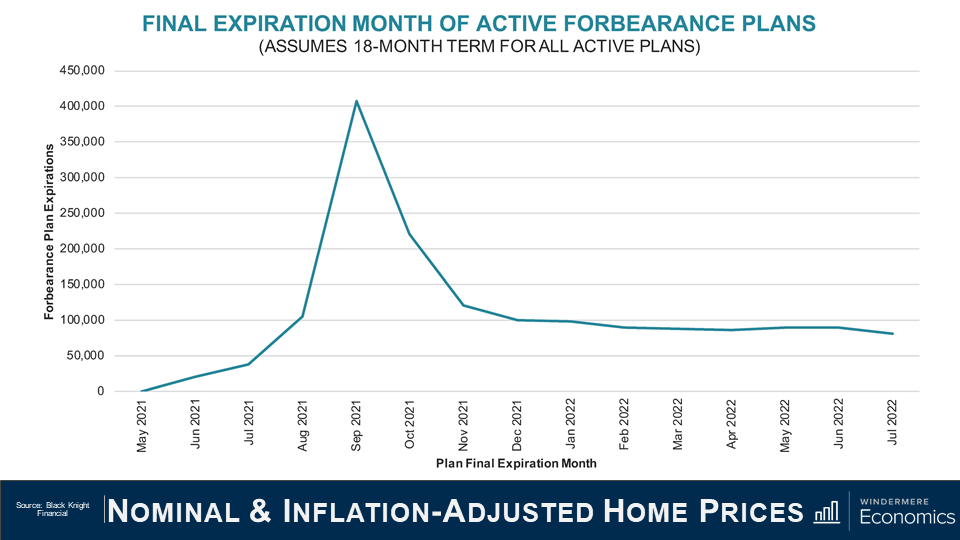
I actually found this chart to be very interesting. Of the more than two million active forbearance plans, approximately half are scheduled to reach their 18-month terminal expiration date in September and October of this year.
And if we take this data, and then project a fairly modest 3% monthly rate of homeowners leaving the forbearance program, it means that over 900,000 homes would exit the program in the third and fourth quarters of this year.
And with 575,000 thousand plans scheduled to expire in September and October alone – that means that mortgage services will be faced with the daunting task of having to process nearly 15,000 plans per business day during that time. It’s going to be a lot of work!
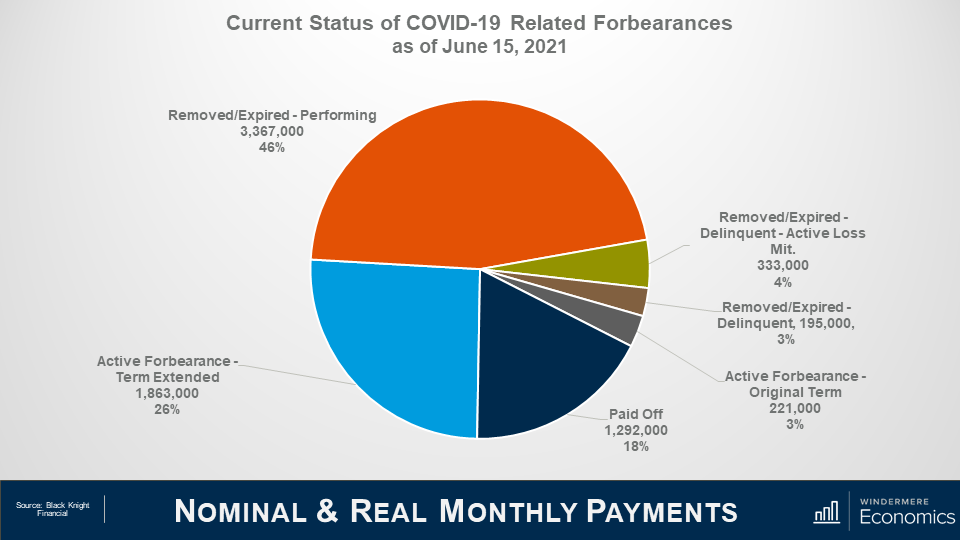
Roughly 7.25 million borrowers have used the forbearance program at one time or another through the course of the pandemic and that represents roughly 14% of all homeowners in the country.
Of that 7.25 million, the chart here shows that 72% have left the plan, and 28% remain in active forbearance, but you can also see that loan performance remains pretty robust among homeowners who have left the program with 46% of them getting things squared away with their lenders in regard to missed payments, and 18% having paid off their loan in full – likely from selling or refinancing with a different lender.
You will also see that the number of borrowers in post forbearance loss mitigation is down a tad to 333,000, while those who have left forbearance but still remain delinquent and not in loss mitigation accounts for roughly 3% of total loans in the program or just 195,000.
So, the way I see it, although the number of homes leaving the program has certainly slowed which, quite frankly, doesn’t surprise me, I still expect further improvement as we move through the year not just because the economy continues to reopen and people are getting reestablished at work, but also because we won’t be seeing any new owners enter the program.
And finally, I want to show you what parts of the country have a high share of homes in forbearance.
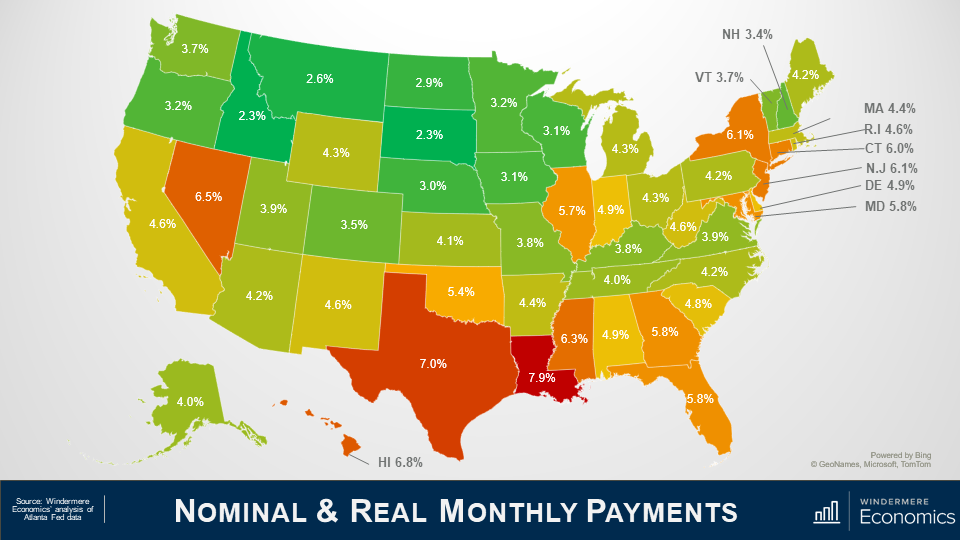
I must tell you first off, that this data isn’t that timely – in fact these numbers are from March as the data I get at the State and County grain is subject to a three month lag.
Anyway, as you can see from this map, not all states are created equal, with the share of homes in forbearance still elevated in Louisiana, Texas and, to a lesser degree, New York State.
Out here in the West, the rate in Nevada is still high, and California and New Mexico are both somewhat higher than I would like to have seen but, as I just said, this data is a little old, and I believe that the share of homes in forbearance in both Nevada and California is lower today than you see here.
Given everything that we’ve looked at today, there are a couple of conclusions that can be drawn.
The first, and most obvious, is that anyone believing but there will be a flood of homes that will be foreclosed on either toward the end of this year or in 2022, is likely to be disappointed. Even if every home still in the program does enter foreclosure which, by the way, is basically impossible, the number of homes that would be foreclosed on would be minimal when compared to the fallout following the financial crisis of more than a decade ago.
And when I say that it’s virtually impossible to expect to see all homes will be foreclosed on, it’s mainly because of the remarkable run up in home values that the country has seen since 2012.
The buildup of equity that all homeowners have seen whether they bought before 2012, or even as recently as the past 2 or 3 years, suggests that if, for whatever circumstance, owners in forbearance can’t get their heads back above water, they will choose to sell their home – in order to keep the equity that they have accumulated.
A typical homeowner in forbearance has a sizeable equity in their home, with median equity of a homeowner in the program measured at just over $100,000. And this significant amount of cash in their homes would allow them to pay the bank back any missed payments, sell, and still walk away with a sizable amount of equity.
The bottom line is that the forbearance program was needed and it can be said that it has been successful so far in warding off home foreclosures because of the remarkable impact of the pandemic.
Although it would be naïve to suggest that foreclosure rates won’t rise at all, as the forbearance program winds down, I do see them ticking higher but, given all the data that I’ve been looking at, I would be very surprised to see overall foreclosure rates rise to a level significantly above the long-term average.
Well, I hope that you have found this month’s discussion to be interesting. As always if you have any questions or comments about this topic, please do reach out to me but, in the meantime, stay safe out there and I look forward the visiting with you all again, next month.
Bye now.
5 Mistakes to Avoid After Pre-Approval

Getting pre-approved is a great first step for buyers, but there can be a number of hurdles in the process. Here are a few cautionary steps that can be taken to make the experience as smooth and worry-free as possible.
Pre-Approval
Getting pre-approved has many benefits for buyers: it strengthens their buying power, assists in identifying their price range, helps communicate their preparedness to sellers, and, once their offer is accepted, helps to speed up the closing process.
Pre-approval is broken down into two steps: pre-qualification and pre-approval. During pre-qualification, buyers will share their financial information with their bank or lender to understand the approximate loan amount they can expect to qualify for. The pre-approval process is a little more involved, as the lender will conduct a thorough review of the buyer’s financial health to give them a more detailed picture of how much they can borrow, estimated monthly costs, and what interest rate they can expect on their loan.

Image Source: Getty Images
5 Mistakes to Avoid After Pre-Approval
Being pre-approved doesn’t mean buyers are all set. There are certain mistakes that can throw buyers off course, and in some cases, lead to a denial of financing. Here are five common mistakes that can do just that:
-
Large Purchases
Any large purchases—credit or cash—made after getting pre-approved can easily cause trouble for buyers. Making a large credit purchase equates to increasing debt, which raises a buyer’s debt-to-income ratio. Large cash purchases decrease a buyer’s cash-readiness from the time when they were pre-approved. In both scenarios, the lender may call into question a buyer’s ability to make their mortgage payments.
-
Quitting or Changing Jobs
Knowing that a buyer has a stable source of income is important to lenders. Accordingly, it is best for a buyer to wait until after the home loan process is complete before taking steps to change their employment. Not only could changing jobs potentially put their mortgage pre-approval at risk, but it could also delay their settlement, since it takes time to prove a new salary.
-
Unpaid Bills
Missing bill payments can be especially harmful to a buyer’s candidacy in the time between getting pre-approved and closing on the home. During pre-approval, lenders are using your ability to pay bills on time to help them paint a picture of your finances and it’s important to keep that picture consistent.
-
New Credit
Opening new credit accounts will likely change a buyer’s credit score, which may cause adjustments in their interest rate. Lenders, upon seeing a new line of credit, even a store credit card, may elect to review the buyer’s risk of non-payment.
-
Paying Off Debt
While most people would think paying off debt is a good thing, if a buyer pays off any significant loans or credit card debt after pre-approval, their lender will want to know where the money came from. The decrease in debt will also have an effect on the buyer’s debt-to-income ratio, which may alter their creditworthiness.
The period of time between pre-approval and closing on a home can be a tedious one for buyers. Before making any significant financial decisions, it’s helpful for buyers to speak with their lender to get an idea of how it may impact their financial standing. The complexities of this process also highlight the importance of working with an experienced agent.
For assistance planning a home purchase, connect with a Windermere Real Estate agent here:
Are You Better Off Paying Your Mortgage Earlier or Investing Your Money?

Few topics cause more division among economists than the age-old debate of whether you’re better off paying off your mortgage earlier, or investing that money instead. And there’s a good reason why that debate continues; both sides make compelling arguments.
On the one hand, your mortgage is quite likely the largest expense you will ever incur in your life. So if given the chance, it only…
")


