
 Facebook
 X
X
 Pinterest
 Copy Link
10 Housing Predictions for 2024

This video shows Windermere Chief Economist Matthew Gardner’s Top 10 Predictions for 2024. Each month, he analyzes the most up-to-date U.S. housing data to keep you well-informed about what’s going on in the real estate market. See more market insights on our blog here.
Matthew Gardner’s Top 10 Predictions for 2024
1. Still no housing bubble
This was number one on my list last year and, so far, my forecast was spot on. The reason why I’m calling it out again is because the market performed better in 2023 than I expected. Continued price growth, combined with significantly higher mortgage rates, might suggest to some that the market will implode in 2024, but I find this implausible.
2. Mortgage rates will drop, but not quickly
The U.S. economy has been remarkably resilient, which has led the Federal Reserve to indicate that they will keep mortgage rates higher for longer to tame inflation. But data shows inflation and the broader economy are starting to slow, which should allow mortgage rates to ease in 2024. That said, I think rates will only fall to around 6% by the end of the year.
3. Listing activity will rise modestly
Although I expect a modest increase in listing activity in 2024, many homeowners will be hesitant to sell and lose their current mortgage rate. The latest data shows 80% of mortgaged homeowners in the U.S. have rates at or below 5%. Although they may not be inclined to sell right now, when rates fall to within 1.5% of their current rate, some will be motivated to move.
4.Home prices will rise, but not much
While many forecasters said home prices would fall in 2023, that was not the case, as the lack of inventory propped up home values. Given that it’s unlikely that there will be a significant increase in the number of homes for sale, I don’t expect prices to drop in 2024. However, growth will be a very modest 1%, which is the lowest pace seen for many years, but growth all the same.
5. Home values in markets that crashed will recover
During the pandemic there were a number of more affordable markets across the country that experienced significant price increases, followed by price declines post-pandemic. I expected home prices in those areas to take longer to recover than the rest of the nation, but I’m surprised by how quickly they have started to grow, with most markets having either matched their historic highs or getting close to it – even in the face of very high borrowing costs. In 2024, I expect prices to match or exceed their 2022 highs in the vast majority of metro areas across the country.
6. New construction will gain market share
Although new construction remains tepid, builders are benefiting from the lack of supply in the resale market and are taking a greater share of listings. While this might sound like a positive for builders, it’s coming at a cost through lower list prices and increased incentives such as mortgage rate buy downs. Although material costs have softened, it will remain very hard for builders to deliver enough housing to meet the demand.
7. Housing affordability will get worse
With home prices continuing to rise and the pace of borrowing costs far exceeding income growth, affordability will likely erode further in 2024. For affordability to improve, it would require either a significant drop in home values, a significant drop in mortgage rates, a significant increase in household incomes, or some combination of the three. But I’m afraid this is very unlikely. First-time home buyers will be the hardest hit by this continued lack of affordable housing.
8. Government needs to continue taking housing seriously
The government has started to take housing and affordability more seriously, with several states already having adopted new land use policies aimed at releasing developable land. In 2024, I hope cities and counties will continue to ease their restrictive land use policies. I also hope they’ll continue to streamline the permitting process and reduce the fees that are charged to builders, as these costs are passed directly onto the home buyer, which further impacts affordability.
9. Foreclosure activity won’t impact the market
Many expected that the end of forbearance would bring a veritable tsunami of homes to market, but that didn’t happen. At its peak, almost 1-in-10 homes in America were in the program, but that has fallen to below 1%. That said, foreclosure starts have picked up, but still remain well below pre-pandemic levels. Look for delinquency levels to continue rising in 2024, but they will only be returning to the long-term average and are not a cause for concern.
10. Sales will rise but remain the lowest in 15 years
2023 will likely be remembered as the year when home sales were the lowest since the housing bubble burst in 2008. I expect the number of homes for sale to improve modestly in 2024 which, combined with mortgage rates trending lower, should result in about 4.4 million home sales. Ultimately though, demand exceeding supply will mean that sellers will still have the upper hand.
About Matthew Gardner
As Chief Economist for Windermere Real Estate, Matthew Gardner is responsible for analyzing and interpreting economic data and its impact on the real estate market on both a local and national level. Matthew has over 30 years of professional experience both in the U.S. and U.K.
In addition to his day-to-day responsibilities, Matthew sits on the Washington State Governors Council of Economic Advisors; chairs the Board of Trustees at the Washington Center for Real Estate Research at the University of Washington; and is an Advisory Board Member at the Runstad Center for Real Estate Studies at the University of Washington where he also lectures in real estate economics.
U.S. Housing Market 2023: Updated Analysis

Windermere Chief Economist Matthew Gardner gives an updated analysis of the U.S. housing market in 2023, using data released by The National Association of REALTORS® on listing activity, home sales, price growth, and more.
This video is the latest in our Monday with Matthew series with Windermere Chief Economist Matthew Gardner. Each month, he analyzes the most up-to-date U.S. housing data to keep you well-informed about what’s going on in the real estate market.
U.S. Housing Market 2023
Hello there, I’m Windermere Real Estate’s Chief Economist Matthew Gardner and welcome to this month’s episode of Monday with Matthew. The National Association of REALTORS® released their data on the U.S. housing market in August, and it contained a few things which I found interesting and wanted to share with you.
Listing Activity
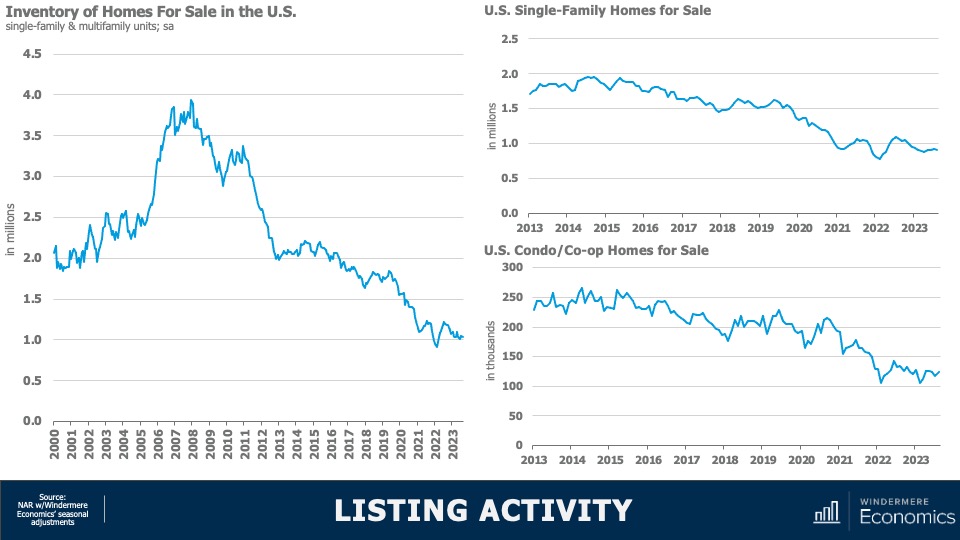
As you can clearly see here, the number of homes for sale remains at close to historic lows. When adjusted for seasonality, there were just 1.03 million single-family and condominium homes for sale in the month of August, and that’s down 8.3% from a year ago and the second lowest level in 2023. When adjusted for seasonal variations, there were just over 911,000 single-family homes for sale in the month, that’s 15% lower than a year ago and 36% below August of 2019. And the condominium market is not faring any better with just over 123,000 units available for purchase, listing activity was down year-over-year by just over 9%.
Homes for Sale August 2023
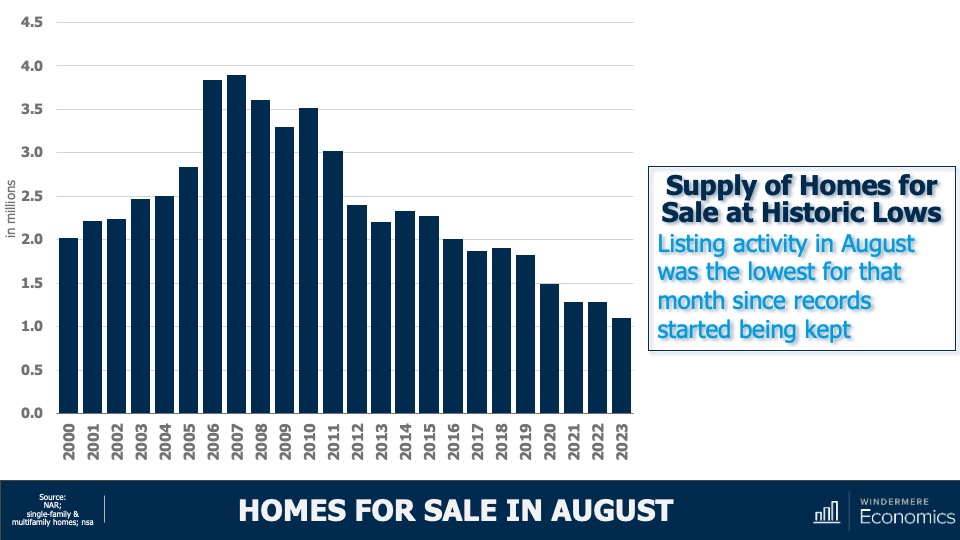
And to give you a little different perspective, this chart shows you the total number of units for sale in the month of August going back more than 20 years and I think it gives a pretty good indication as to how tight the U.S. housing market really is.
Now, we’ve talked before about the reasons why supply is so limited, and the blame is almost totally attributable to mortgage rates with sellers remarkably reluctant to move because that would mean losing the historically low mortgage rate that they currently benefit from. And as the old saying goes, “you can’t buy what’s not for sale,” and this is certainly true in the housing market today.
U.S. Housing Market 2023: Sales Activity
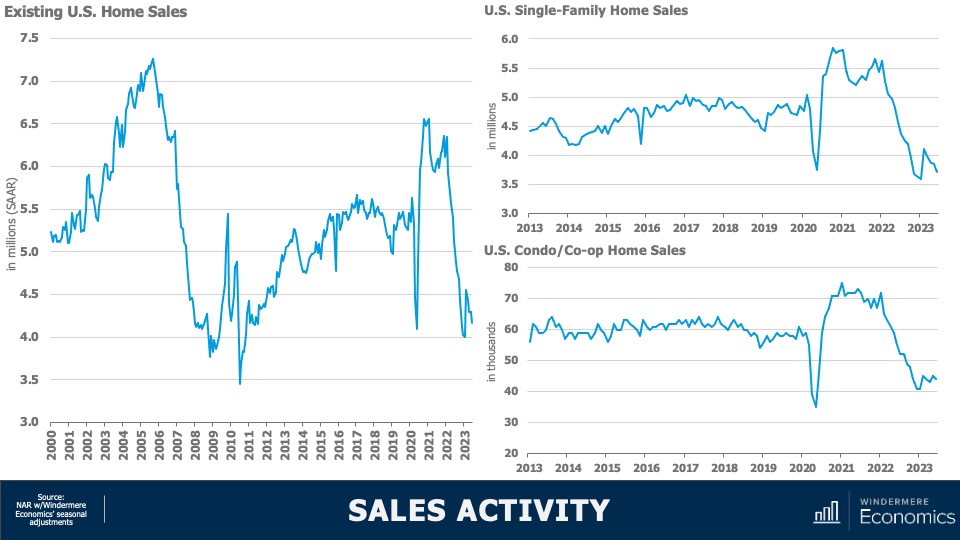
With such limited choice in the marketplace, it’s unsurprising to see home sales having plummeted following the pandemic induced surge we saw in 2021. At an annual sales rate of 4.04 million units, that is only 40,000 more than the low seen this January and we are now holding at levels we haven’t seen since 2010. Interestingly, single-family sales did see a little jump at the start of this year, but they have since pulled back—likely a function of rising financing costs, which were getting close to 7% in June.
But the condominium market, while certainly down significantly, appears to be somewhat more resilient. I find this interesting as we have not seen any palpable increase in listing activity for multifamily units.
Home Sale Prices Off All-Time High
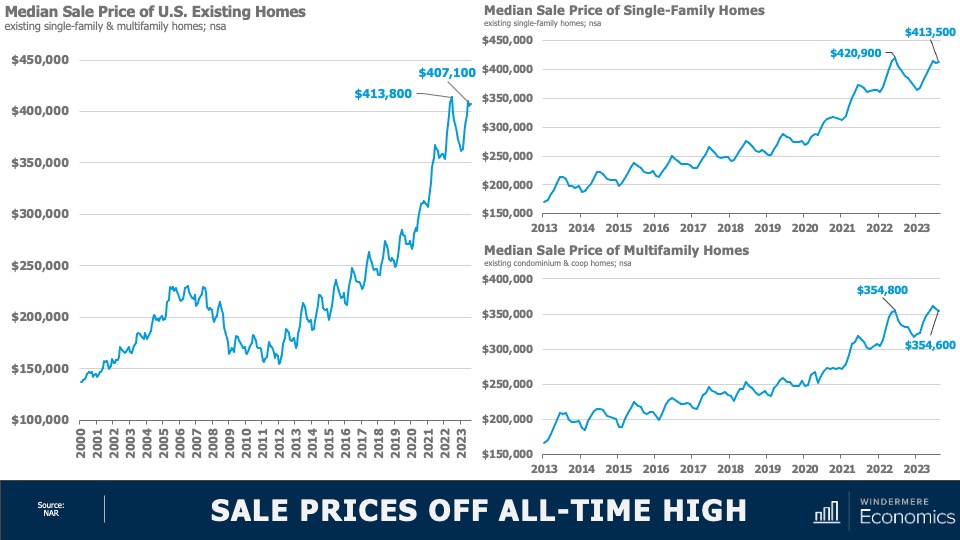
When prices started to fall in the summer of 2022, many expected to see them continue to plunge in a manner similar to that seen following 2007 collapse, but that has certainly not been the case. Sale prices have rebounded and remain remarkably resilient—especially given significantly higher financing costs.
- Although we did see a small drop in home prices between June and July of this year, U.S. home prices are only 1.6% below their 2022 peak; they’re up 3.9% year over year; and up by 11.1% from the start of 2023.
Single-family home prices paint a similar picture with prices down by 1.8% from peak; but up 3.7% year over year, and up 11.2% from the start of the year. Interestingly, sale prices in the Northeast were actually 3.5% higher in August than their 2022 peak. And condominium prices are just 0.1% below the high seen in June of last year. Prices are now up 6.2% year over year and are 11.6% higher than we saw at the end of 2022.
Now, of course the data shown here is unlikely to reflect the recent surge in mortgage rates so it will be interesting to see what impact that has not just on sales but sale prices when the September and October data is published.
My intuition suggests that—even with mortgage rates where they are today—as long as they don’t move significantly higher, prices at the national level are unlikely to collapse. But I do see sales volumes pulling back further as listing activity remains very constrained.
Price Growth vs Payment Growth
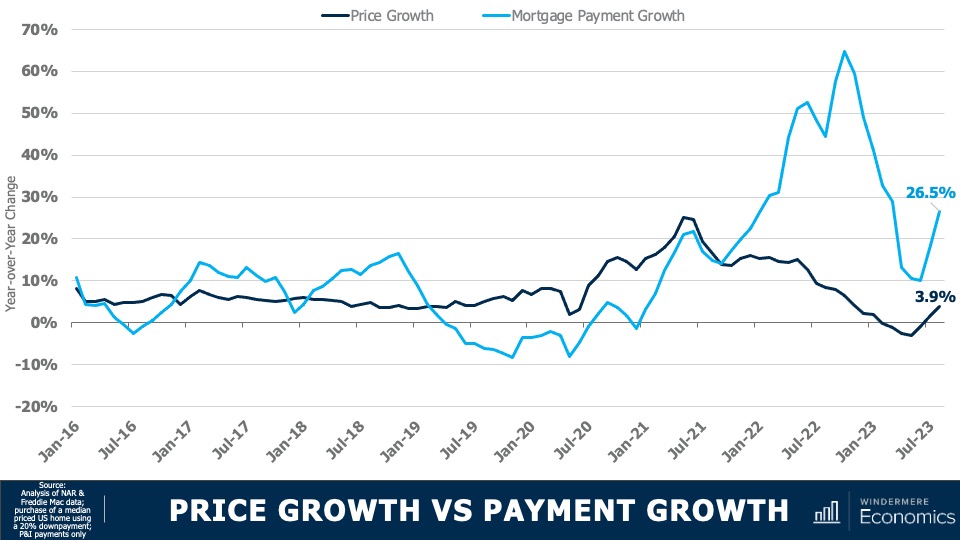
This chart shows a different way to look at the impact that mortgage rates are having on the market. The dark blue line shows year-over-year home price growth, and the light blue line shows the 12-month change in average mortgage payments.
Although we did see that annual growth in mortgage payments fall to just 10% in June of this year—the first time we have seen that since 2021—it has subsequently jumped back up. This means that a buyer of a median priced house in the U.S. is faced with payments that are 26 and a half percent higher than they were 12 months ago. At the same time, home price growth has stalled.
As I’ve mentioned in several past videos, I find it unlikely that inventory levels will increase significantly in 2023, and I also believe that supply will be constrained next year as well as rates remain at elevated levels.
As we know, it is this lack of inventory that has helped to support home prices; however, there is a breaking point. 10-year bond yields are holding at multi-year highs and do not appear to be thinking of pulling back at any time soon—especially given new bond issuances that the country is going bring to market in order to address our burgeoning debt levels.
And it’s because of this that I now expect to see rates remaining higher for longer, and the question then becomes how much tolerance will buyers have if mortgage rates hold where they are today or if they head closer to 8%.
Although I am not expecting this to happen, it is possible. And if it does, then sales will fall further and the underpinning of price stability will certainly be eroded. And there you have it. As always, I’d love to hear your thoughts on this subject so feel free to leave your comments below. Until next month, stay safe out there and I’ll see you soon. Bye now.
To see the latest housing data for your area, visit our quarterly Market Updates page.
About Matthew Gardner
As Chief Economist for Windermere Real Estate, Matthew Gardner is responsible for analyzing and interpreting economic data and its impact on the real estate market on both a local and national level. Matthew has over 30 years of professional experience both in the U.S. and U.K.
In addition to his day-to-day responsibilities, Matthew sits on the Washington State Governors Council of Economic Advisors; chairs the Board of Trustees at the Washington Center for Real Estate Research at the University of Washington; and is an Advisory Board Member at the Runstad Center for Real Estate Studies at the University of Washington where he also lectures in real estate economics.
How Low Inventory Is Affecting the Housing Market
Windermere Chief Economist Matthew Gardner demonstrates how the U.S. housing market is adapting to low inventory levels. He touches on the new construction industry, supply changes in large metro areas, median home sale prices, and more.
This video is the latest in our Monday with Matthew series with Windermere Chief Economist Matthew Gardner. Each month, he analyzes the most up-to-date U.S. housing data to keep you well-informed about what’s going on in the real estate market.
Low Inventory Housing Market
Hello there, I’m Windermere Real Estate’s Chief Economist Matthew Gardner and welcome to this month’s episode of Monday with Matthew. As we are all aware, the housing market has softened considerably with the number of existing homes available to buy close to record lows. Today we are going to talk about supply, and how the market is starting to adapt to low inventory levels.
Housing Market Inventory
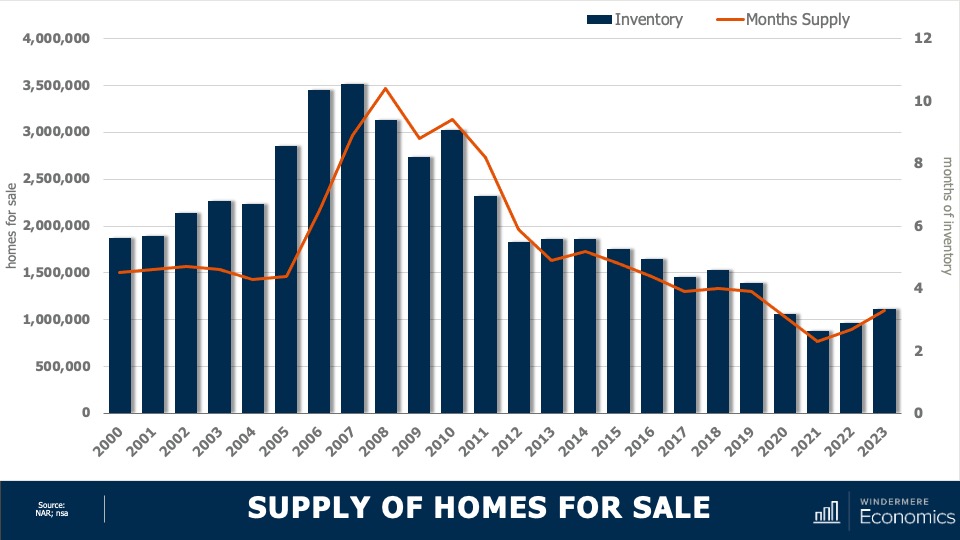
This chart shows the average number of homes on the market by year. Although year to date we have seen a little bit of an uptick, it’s clear the country remains supply-starved. And with just over three months of inventory—as opposed to the normal four to six—the market is clearly out of balance. But even though inventory levels have risen nationally, as I’ve said many times before, not all markets are equal.
Housing Inventory Changes in Metro Areas
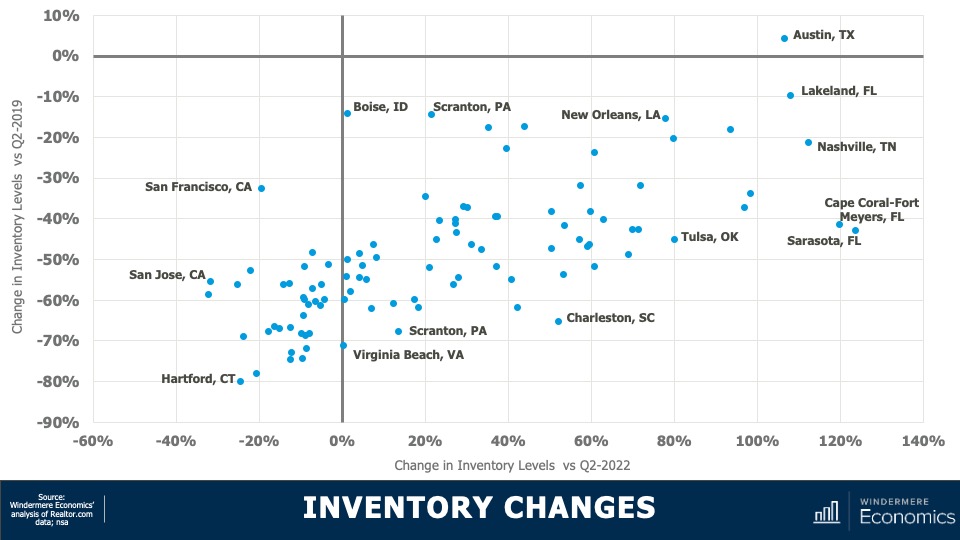
This chart shows how supply levels have changed. The data here is representative of the 100 largest metropolitan areas in the country. The horizontal axis shows the change in inventory versus the second quarter of 2022, while the vertical axis shows the difference and the number of homes for sale versus the second quarter of 2019. I think you’ll agree that the difference is stark. Although two-thirds of the metropolitan areas have seen the number of homes for sale improved versus the same period a year ago, just one (Austin, TX) had more homes for sale higher in the second quarter of this year than it had in the second quarter of 2019.
- And even more stark was the fact that inventory levels in 53 of the 100 largest metropolitan areas were down by more than 50% compared to the same period three years ago.
Interestingly, on a percentage basis, smaller metro areas saw the greatest decline compared to three years ago. For example, in Hartford, CT, the average number of homes on the market in the second quarter was just over 900, down by 80% from the second quarter of 2019 where there was an average of over 4,400 units for sale. Supply levels were down by 78% in Stamford, CT; 75% in New Haven, CT; and 74% in Allentown, PA.
It is true that supply levels are generally higher when compared to a year ago, with the greatest increase being seen in select markets in Florida, Tennessee, Texas, and Oklahoma; however, other than in Austin, supply levels remain well below their long-term averages. So, how is the market adapting? The answer is rather interesting. Even with all the talk of escalating material, land, and labor costs, it’s the new home industry that has been taking advantage of the lack of housing supply.
New Construction Market Trends
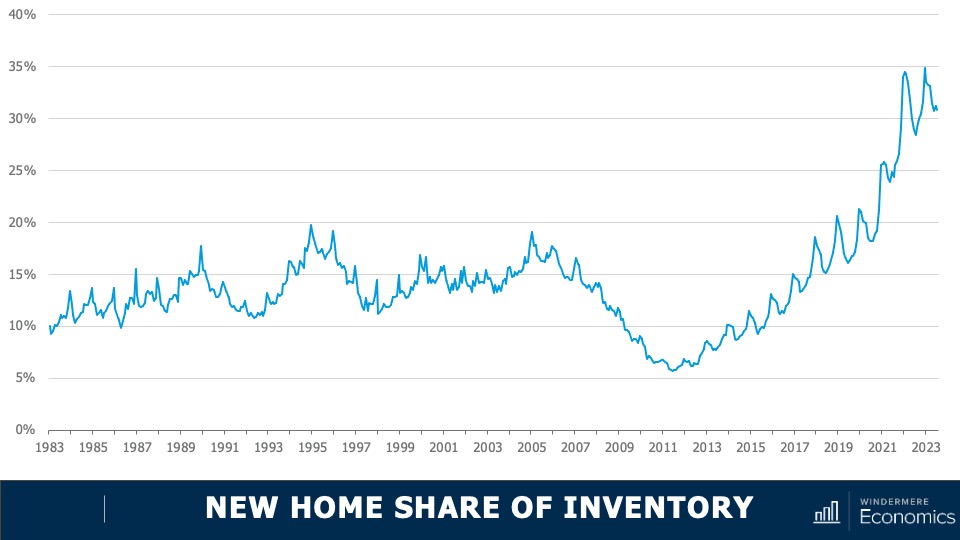
This chart shows the share of new homes on the market compared to their resale counterparts—here we are just looking at single-family homes. Historically, new construction makes up roughly 10% of active listings at any one time, but as you can see here, that share has been rising not just since the end of the pandemic but for the past several years. Although off the high seen a few months ago, 30% of the single-family homes for sale this July were brand new. I find this particularly interesting because, historically speaking, a premium was paid in order to buy a new home rather than an existing one.
Median Sale Prices: New and Existing Homes
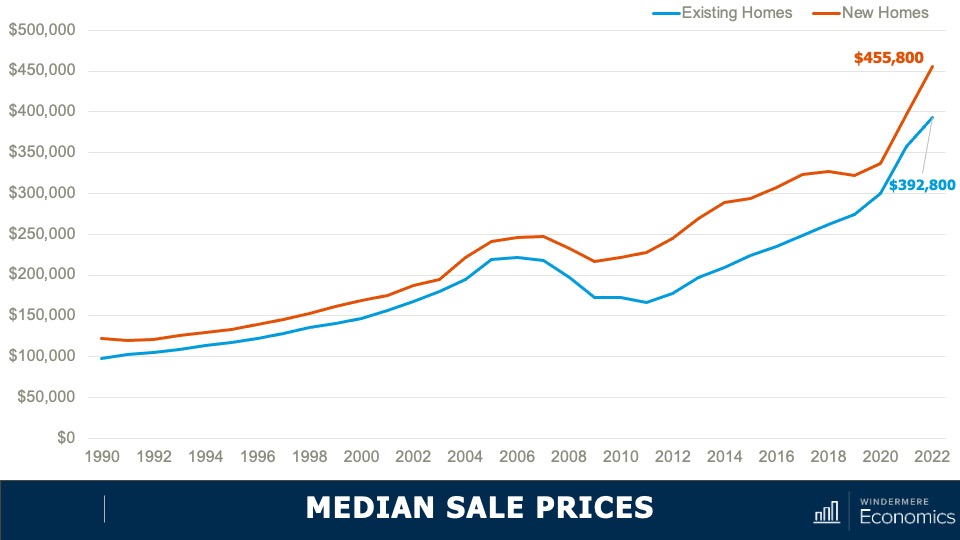
- As you can see here, the spread in median sale prices, which was pretty stable from 1990 until the bursting of the housing bubble, grew significantly starting in 2011 and in 2022. The premium averaged 16%. But when we look a bit closer at the numbers, they gives us a somewhat different picture.
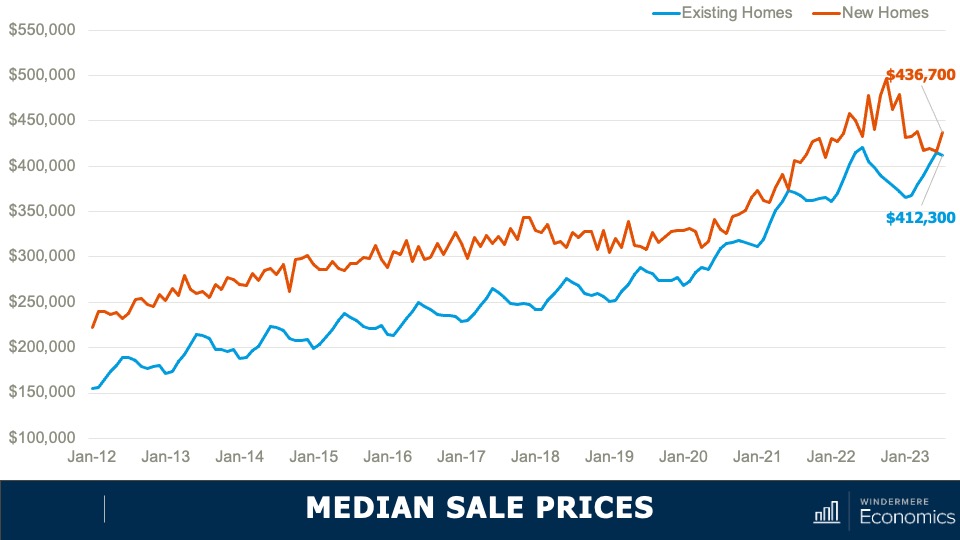
- You can see here the spread has dropped to just 6%. And in June of this year, the difference was a mere $1,000.
With the share of new homes for sale holding at a four-decade high, the share of sales themselves is at a level we haven’t seen since 2005. But even though we know that there is demand for housing, shouldn’t sales be constrained by mortgage rates? Well, what is happening is that builders are attracting buyers through incentives, and here we’re talking about mortgage rate buydowns which are becoming increasingly prevalent across the country.
In fact, a recent survey from John Burns Consulting suggested that 30% of home builders reported using interest buydowns more in the second quarter of this year than they had previously. And this is attracting buyers to visit new development communities.
An example of these buydowns is the 2/1 program that DR Horton—the largest home builder in the country—is offering at some communities. This program gives buyers a mortgage rate that starts at 3% for the first year, rises to 4% in year two, and then goes to 5% for the balance of the 30-year term. That’s pretty compelling, given where mortgage rates are today.
The bottom line is that as far as I can see, the new home industry will continue to take an outsized share of the market for the balance of 2023 and likely through most of 2024. That said, once the market starts to normalize, I expect them to pull back from these incentive programs, making them more likely to start raising asking prices, and we will return to the traditional spread between the prices of new and resale homes.
Although it’s pleasing to see more homes being built, I still believe that the country will still be running a housing deficit when it comes to meeting demographic demand and this will continue to hurt first-time buyers who continue to be priced out of the market.
As always, I’d love to hear your thoughts on this subject so feel free to leave your comments below. Until next month, stay safe out there and I’ll see you soon. Bye now.
To see the latest real estate market data for your area, visit our Market Update page.
About Matthew Gardner
As Chief Economist for Windermere Real Estate, Matthew Gardner is responsible for analyzing and interpreting economic data and its impact on the real estate market on both a local and national level. Matthew has over 30 years of professional experience both in the U.S. and U.K.
In addition to his day-to-day responsibilities, Matthew sits on the Washington State Governors Council of Economic Advisors; chairs the Board of Trustees at the Washington Center for Real Estate Research at the University of Washington; and is an Advisory Board Member at the Runstad Center for Real Estate Studies at the University of Washington where he also lectures in real estate economics.
U.S. Home Prices and Housing Affordability in 2023
Windermere Chief Economist Matthew Gardner gives an updated look at U.S. home prices and housing affordability in 2023 by examining two key second-quarter reports from ATTOM Data Solutions and the National Association of Home Builders (NAHB).
This video is the latest in our Monday with Matthew series with Windermere Chief Economist Matthew Gardner. Each month, he analyzes the most up-to-date U.S. housing data to keep you well-informed about what’s going on in the real estate market.
U.S. Home Prices 2023
Hello there, I’m Windermere Real Estate’s Chief Economist Matthew Gardner and welcome to this month’s episode of Monday with Matthew. Today we are going to look at home prices and housing affordability. To do this I will be looking at the second quarter sales price data from ATTOM Data Solutions and we will also look at the just released National Association of Home Builders Housing Opportunity Index for the second quarter.
Are home prices dropping?
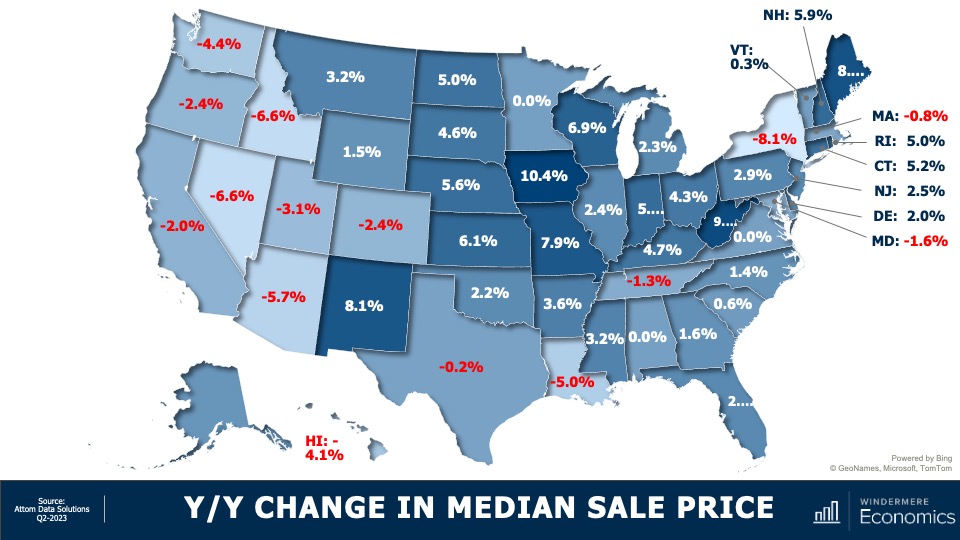
Starting with the year-over-year change in sale prices at the state level, there aren’t any great surprises. For the past several months I’ve been saying that as the Western U.S. saw the greatest price growth during the pandemic, so it’s not surprising to see most states sale prices in the quarter below the level seen a year ago. But it was pleasing to see that sale prices in 36 states either matched the level seen a year ago or were higher, and in some instances quite significantly so.
U.S. Home Sale Prices 2023 By State
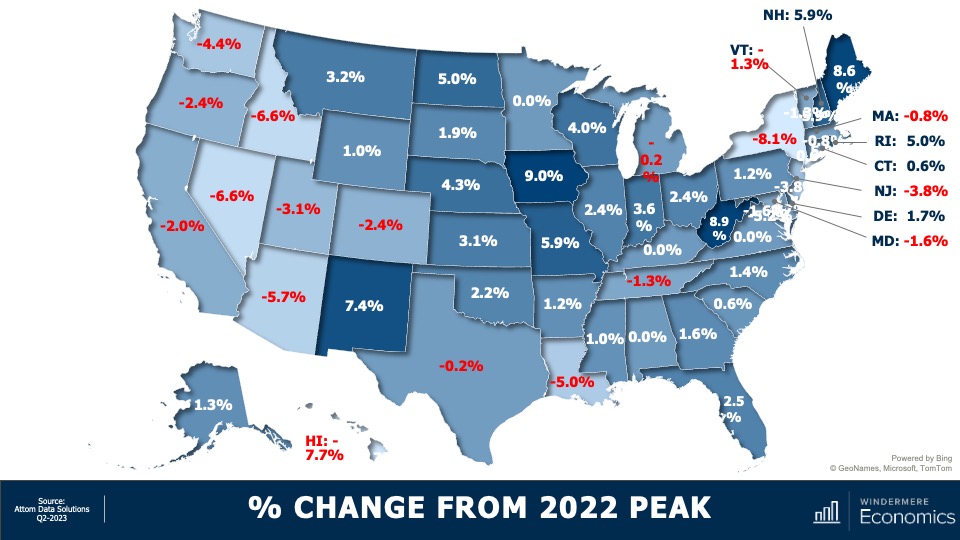
And when we compare second quarter sale prices to their 2022 peaks, 33 states are at or above the highs seen last year, but most of the Western States have yet to fully recover. In the South, Louisiana is still lagging by a good amount, as is New York State on the East Coast.
But as you are all very aware, all markets are different. I thought it would be interesting to dig a little deeper into the data to see which metro markets have seen significant gains over the past 12 months. It’s going to be interesting specifically because of the fact that mortgage rates have risen so much.
Metro Areas: Home Sale Prices 2023
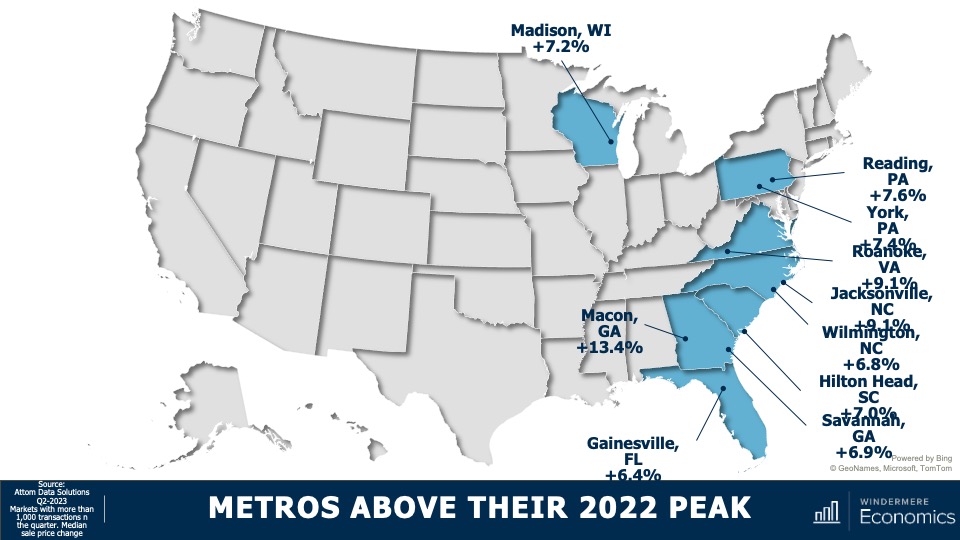
These are markets where sale prices are far above their 2022 peak sale prices. Now I must add that I only looked at markets where more than 1,000 transactions occurred in the last quarter, which takes out some of the volatility. Notably, even though the state of Virginia’s home prices in the quarter were flat when compared to their 2022 peak, the Roanoke market was up by over 9%. And in Pennsylvania, where state prices were only 1.2% above their 2022 peak, Reading is up by 7.6% and York by 7.4%. And in Georgia, where state sale prices were up a modest 1.6%, homes in Macon have leapt by over 13% and prices are up by 6.9% in Savannah.
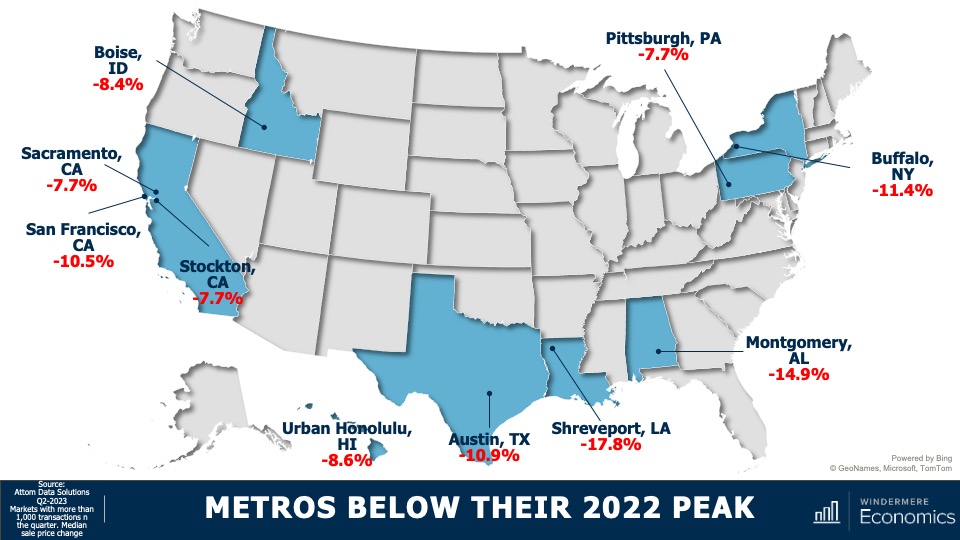
But, on the other end of the spectrum, there are markets which are underperforming their respective states and, unsurprisingly, California tops the list with three of their metros seeing prices significantly below that of the state as a whole. In other parts of the country, several metro areas which were relatively affordable before the pandemic saw an influx of remote workers and this led prices to skyrocket, and these will take some time to recover. This is particularly true in the Austin and Boise market areas.
I would add that, of the counties across the country where there were more than 1,000 transactions in the second quarter, half have met or exceeded their prior peak and—of the half where sale prices were still lower—the average shortfall is only around 4% and there are just seven counties in the country where sale prices are down by more than 10% from their 2022 peaks.
Now, what I see in the data is that the U.S. housing market, although certainly not fully healed, is headed in the right direction even when faced with mortgage rates that remain remarkably high. So, with sale prices recovering and still faced with stubbornly high financing costs, what does affordability look like?
U.S. Housing Affordability 2023
Well, according to the National Association of Homebuilders (NAHB), of the 241 metros that they track, just 40.5% of sales in the second quarter were affordable to households making the area’s median income—that’s the second lowest share of sales seen since they started generating this dataset a decade ago. Now, their data does go back to 2004, but the interest rate series that they used to use was discontinued, so it’s not accurate to compare their data today with anything before 2012.
Most Affordable U.S. Housing Markets
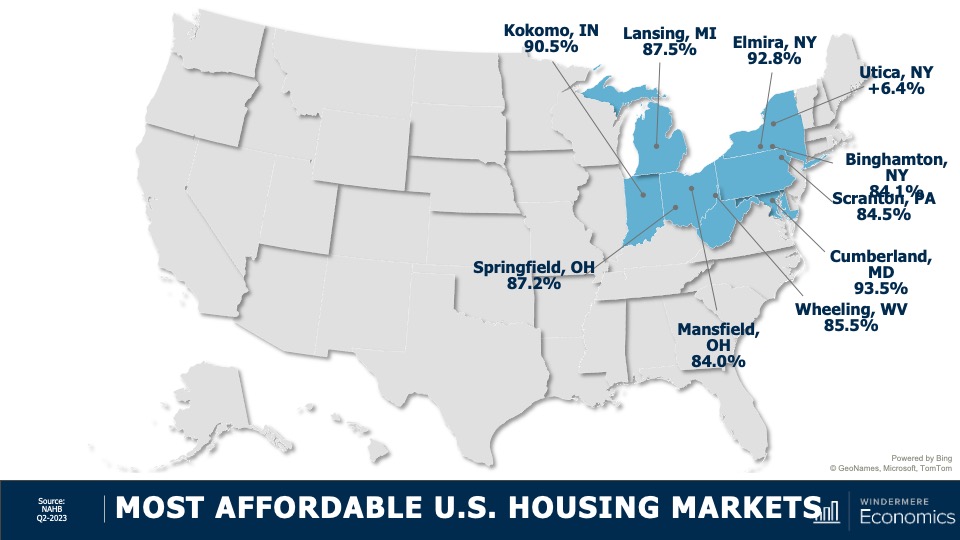
These were the most affordable markets in the second quarter and their locations should not be of any great surprise. Average sale prices in these markets were measured around $203,000—that’s just marginally above 50% of the national sale price in the quarter, which was $402,600.
Least Affordable U.S. Housing Markets
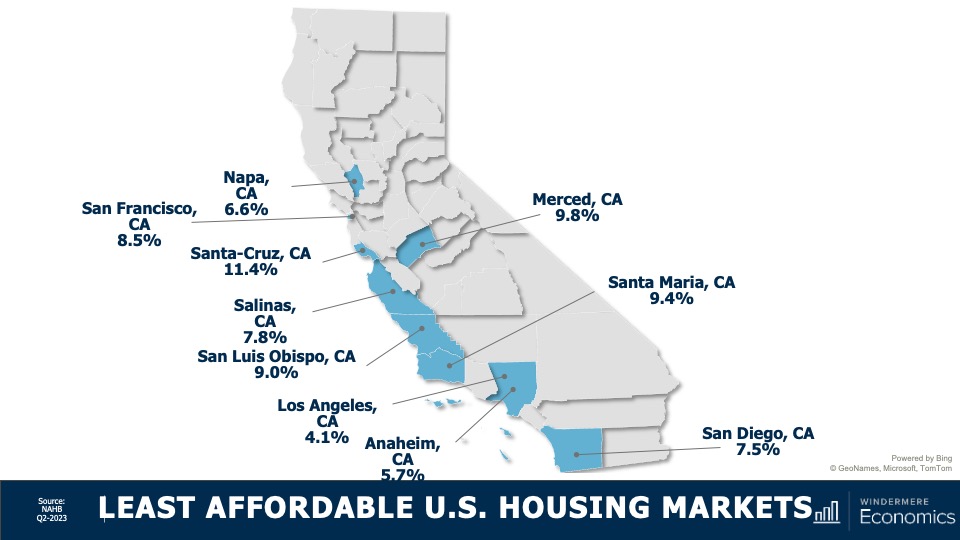
And unfortunately this should not surprise you either. On the other end of the spectrum, the top-10 least affordable housing markets were all in California, but it gets worse than that. The top 15 least affordable markets again, all in California, and 19 out of the top 25 were in the Golden State!
As far as I can see, the ownership housing market is still showing remarkable resiliency, especially given that mortgage rates have more than doubled from their lows and they’ve risen from 4.8% at the start of the second quarter of last year to 7% at the end of the second quarter of 2023.
Now, I still expect to see rates starting to slowly move lower as we go through the second half of the year. This will help with prices and, to a degree, affordability, but until we see a significant increase in the number of homes listed for sale, the market is going to remain unbalanced.
As always, I’d love to hear your thoughts on this subject so feel free to leave your comments below. Until next month, stay safe out there and I’ll see you soon. Bye now.
To see the latest real estate market data for your area, visit our quarterly Market Updates page.
About Matthew Gardner
As Chief Economist for Windermere Real Estate, Matthew Gardner is responsible for analyzing and interpreting economic data and its impact on the real estate market on both a local and national level. Matthew has over 30 years of professional experience both in the U.S. and U.K.
In addition to his day-to-day responsibilities, Matthew sits on the Washington State Governors Council of Economic Advisors; chairs the Board of Trustees at the Washington Center for Real Estate Research at the University of Washington; and is an Advisory Board Member at the Runstad Center for Real Estate Studies at the University of Washington where he also lectures in real estate economics.
Housing Market 2023: Home Prices, U.S. Demographics, and More
Harvard University’s latest edition of “The State of the Nation’s Housing” has arrived, and Windermere Chief Economist Matthew Gardner is here to break down what the data presented in the report means for the U.S. housing market in 2023 and beyond.
This video is the latest in our Monday with Matthew series with Windermere Chief Economist Matthew Gardner. Each month, he analyzes the most up-to-date U.S. housing data to keep you well-informed about what’s going on in the real estate market.
Housing Market 2023
Hello there, I’m Windermere Real Estate’s Chief Economist Matthew Gardner, and welcome to this month’s episode of Monday with Matthew. I spend a lot of time reading reports that relate to the housing market, but there is one in particular I’m always impatiently waiting for, and it’s published by my colleagues at the Joint Center for Housing Studies at Harvard University. Every year they release the The State of the Nation’s Housing report and it’s packed full of fascinating data about the ownership and rental housing markets, demographics, and it also discusses the challenges that lay ahead. So today, I wanted to touch briefly on just a few of the report’s high points, but I highly recommend you download it from their website.
What’s happening in the housing market?
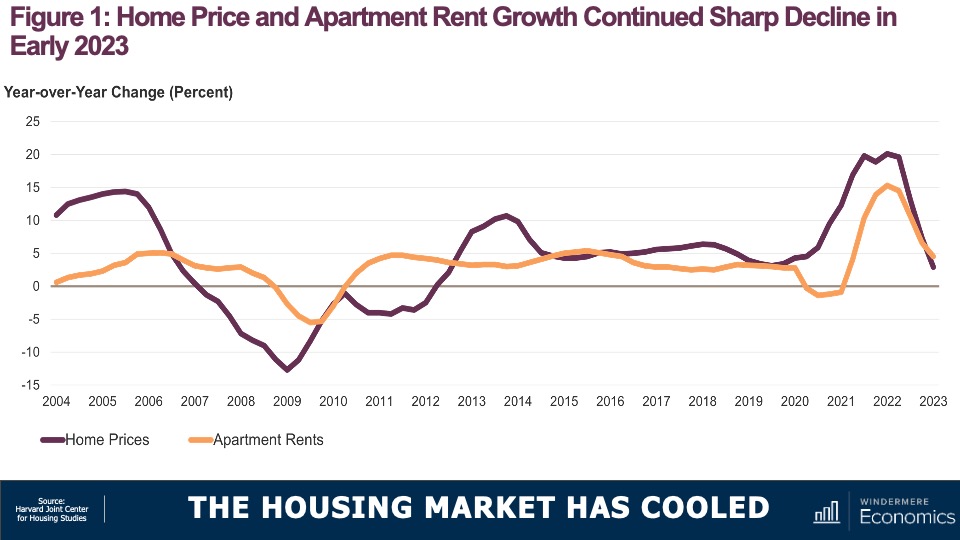
As we all know, the for-sale housing market started softening in mid 2022 in response to rising interest rates and deteriorating affordability. What was particularly notable was that seasonally adjusted home prices fell month over month last July and that was the first monthly drop in over a decade. And over in the rental market, asking rents—while still up year over year—also saw their pace of growth slow considerably, and that is a concern.
Is home construction slowing down?
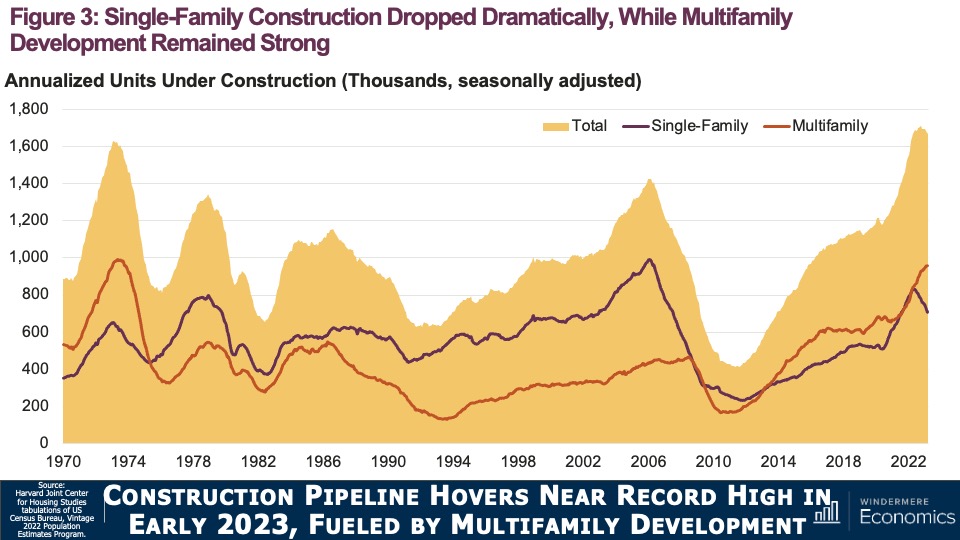
As you see here, multifamily construction continued to rise last year even as rental demand was softening. In fact, 547,000 new multifamily units were started in 2022, the highest number since the mid-1980s, and the 960,000 units under construction in March 2023 was the highest number seen in half a century. On the ownership side, it wasn’t surprising to see single-family construction falling significantly as buyers reacted to sharply higher borrowing costs.
The report also suggested that the decline in new construction was particularly acute for lower-priced homes. Builders just can’t produce entry-level product with current material, labor, and land costs; limited lot availability; and regulatory barriers such as minimum lot sizes that restrict production of entry-level housing production.
U.S. Population Demographics
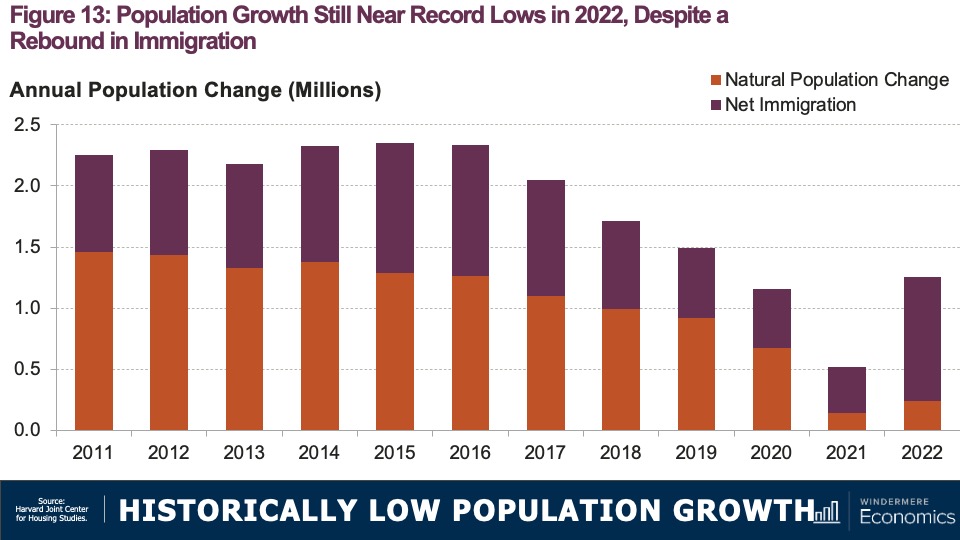
Now turning to demographics. Population growth—naturally the primary long-term driver of household growth—remains historically low. Overall, the U.S. population grew by 1.26 million people last year, or just 0.38%. Now, while this does represent a slight uptick from previous years that’s really not saying much as U.S. population growth hit 100-year lows in 2019, 2020, and 2021.
Increases in a country’s population come in two ways. The first is “natural” growth—which equals the number of persons born minus the number that have died—and the second is via immigration. Now, gains from immigration can be fickle because they are subject to unpredictable government policy changes as well as economic cycles here in the U.S. as well as in other countries. But natural growth is more predictable because it is driven by slow-moving factors like birth and mortality rates. Until last year, natural growth had been the primary source of population growth in the U.S., but, as you saw in that last chart, things have shifted.
U.S. Population Growth & Migration
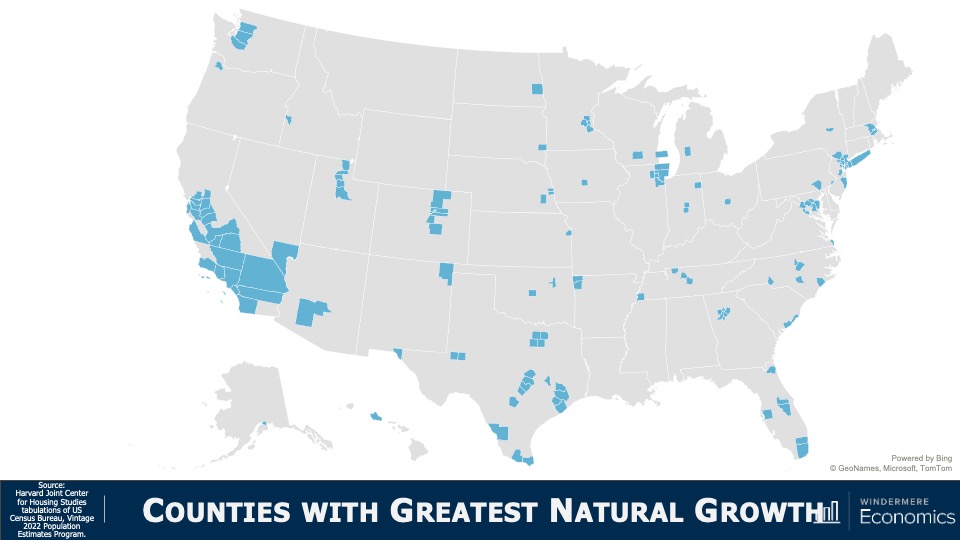
This map shows counties with the highest level of natural growth and it’s dominated by large metro markets in California, Texas, Southern Florida and parts of the Northwest. But, what I found very interesting was that the numbers were remarkably low. Only six counties—three in California, two in Texas, and one in New York—saw natural growth above the 10,000 level and 75% of counties across the country saw negative natural growth.
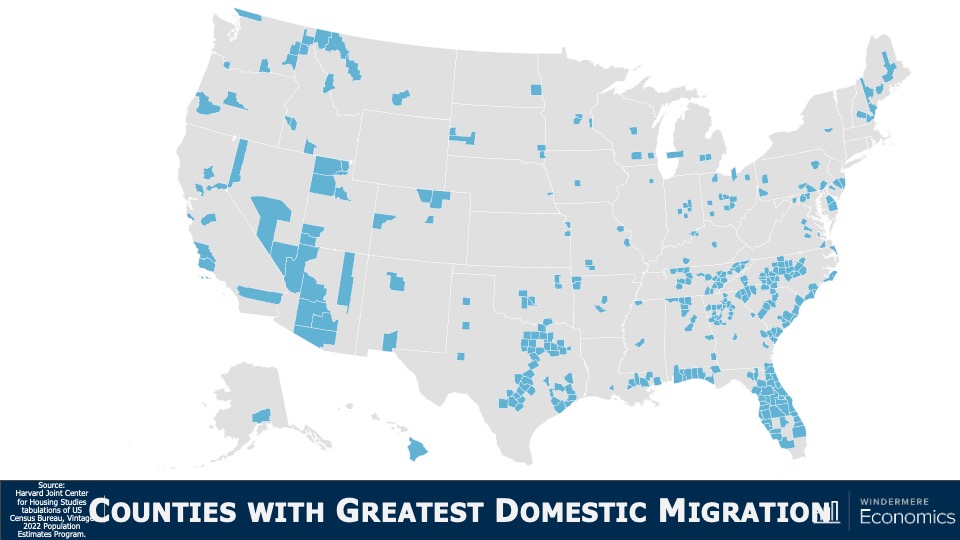
So with natural growth slowing, states will understand the importance of attracting new residents from other markets as domestic migration will become a more important driver of household growth and housing demand. Here you see that Maricopa County, AZ saw the largest gains from domestic migration but, statewide, Florida dominated last year with 319,000 people moving there. Texas came in second with a net gain of over 230,000 people. But on the other end of the spectrum, California was the biggest loser with net 343,000 people leaving, followed by New York who lost 300,000 residents.
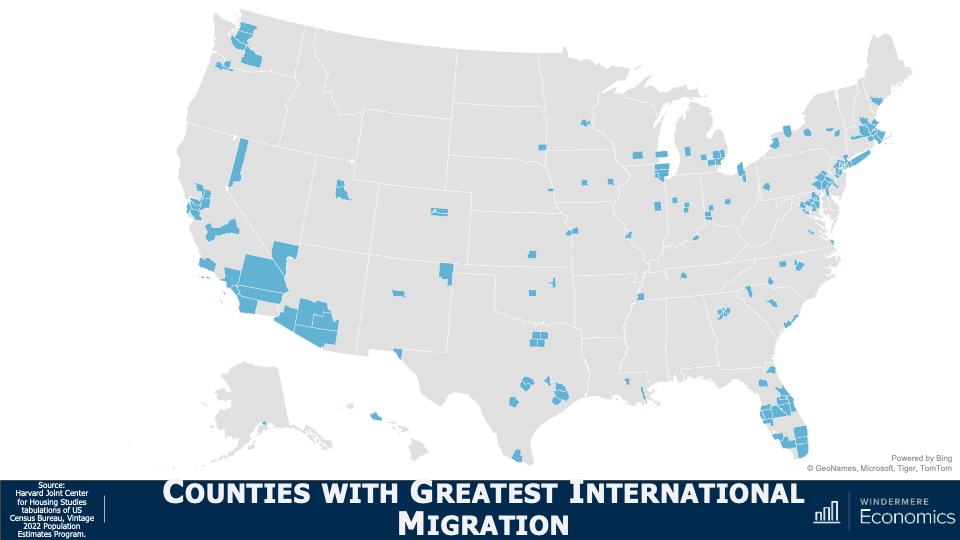
It was international migration that accounted for a full 80% of total growth last year and it was the largest source of total population growth for 26 states and 29% of all counties across the country. The biggest winners were LA County in California, Miami-Dade County in Florida, and Harris County, Texas.
These were just some of the highlights of the report and the biggest conclusions I found were that, in the ownership market, supply will remain tight in the resale arena and new construction will not fill that void, especially as it comes to the entry level product. Housing affordability will not improve. This will continue to be a big issue across the country.
An oversupply of apartments coming online will further moderate rents, but renters will also find affordability to be a big concern. Demographic trends suggest that low domestic population growth going forward will lower new household formations and it’s quite likely that population and household growth will start to rely wholly on immigration earlier than the government expects.
So, there you have it. As always, I’d love to hear your thoughts on this subject so feel free to leave your comments below. Until next month, stay safe out there and I’ll see you soon. Bye now.
To see the latest real estate market data for your area, visit our quarterly Market Updates page.
About Matthew Gardner
As Chief Economist for Windermere Real Estate, Matthew Gardner is responsible for analyzing and interpreting economic data and its impact on the real estate market on both a local and national level. Matthew has over 30 years of professional experience both in the U.S. and U.K.
In addition to his day-to-day responsibilities, Matthew sits on the Washington State Governors Council of Economic Advisors; chairs the Board of Trustees at the Washington Center for Real Estate Research at the University of Washington; and is an Advisory Board Member at the Runstad Center for Real Estate Studies at the University of Washington where he also lectures in real estate economics.
2023 Top 10 Predictions | Mid-Year Update
Windermere Chief Economist Matthew Gardner revisits his Top 10 Predictions for 2023. Reviewing his forecasts for home prices, mortgage rates, and more, he highlights recent changes in the real estate market and updates his predictions for the near future.
This video is the latest in our Monday with Matthew series with Windermere Chief Economist Matthew Gardner. Each month, he analyzes the most up-to-date U.S. housing data to keep you well-informed about what’s going on in the real estate market.
Top 10 Real Estate Market Predictions 2023 | Mid-Year Update
Hello there, I’m Windermere Real Estate’s Chief Economist Matthew Gardner and welcome to this month’s episode of Monday with Matthew. You may remember that at the end of last year, I published my Top-10 Predictions for 2023 and, as we hit the mid-year mark, some of you have been asking me how well my forecasts have been holding up. So, I thought it would be interesting to take another look at them to see how accurate they have or have not been! These were the predictions I made last November, and they covered everything from my expectations for home sales and prices to shifting government policies.
U.S. Home Sale Prices
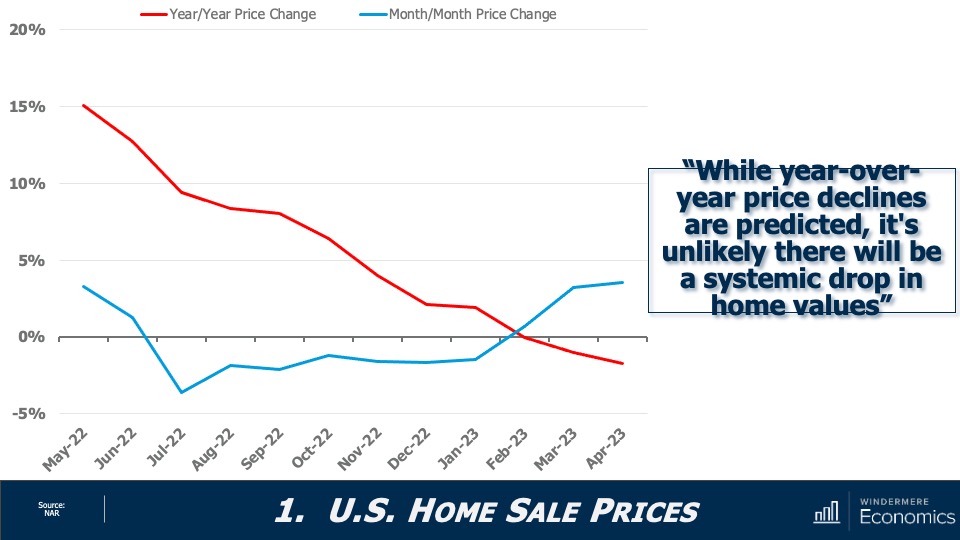
My first forecast suggested that sale prices would fall in 2023; however, I was not expecting any sort of systemic decline in values. Here you can see that year-over-year prices are down by a bit less than 2%, but when you look at how prices have changed month over month, they rose by 3.6% in April and are up by more than 6% since the end of last year.
I stand by my forecast that the median sale price in 2023 will be modestly lower than the 2022 number; and the monthly increase in sale prices that we have seen so far this year also supports my forecast that we are not seeing any long-term decline in home values.
2023 Mortgage Rates
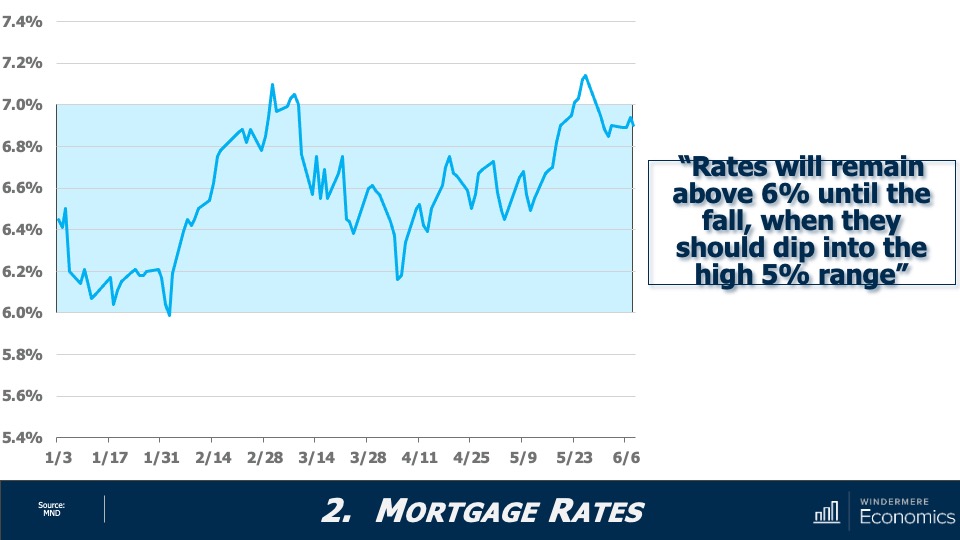
Although mortgage rates have broken above 7% eight times so far this year—the first time because of the banking crisis, and the second because of the looming debt ceiling—I expect them to become a little less frantic as we move through the second half of the year. That said, my call for them to drop below 6% this year is now likely to be inaccurate given where they are today. I still expect them to drop into the “fives” though, but not until early next year.
Is housing inventory increasing?
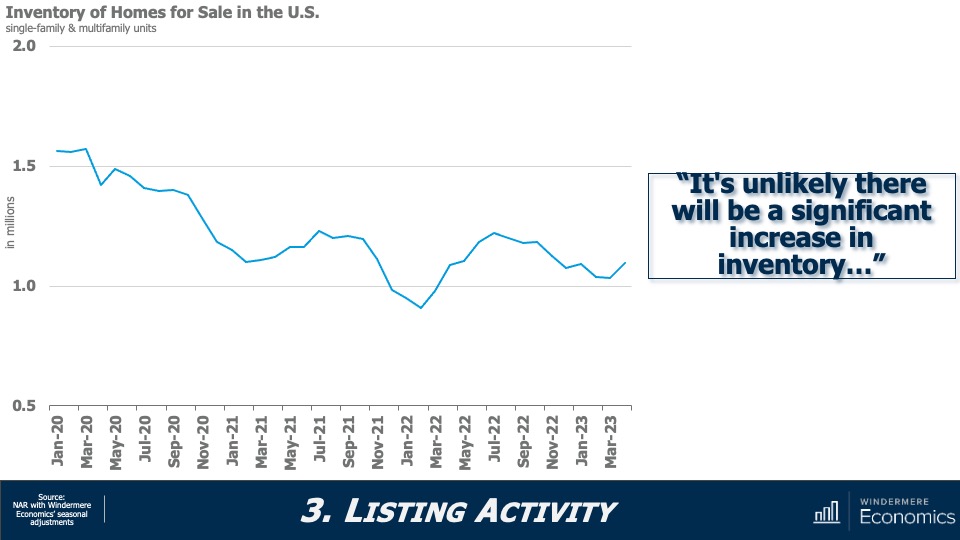
Listing activity saw a very modest late spring bump, but for perspective, the number of homes for sale is running at about 40% of its long-term average, and I still don’t see much growth this year. Why? Well, by my calculations, there could be over 20 million homeowners with mortgage rates around 3%. Why would they move!
Is 2023 a buyer’s or seller’s market?
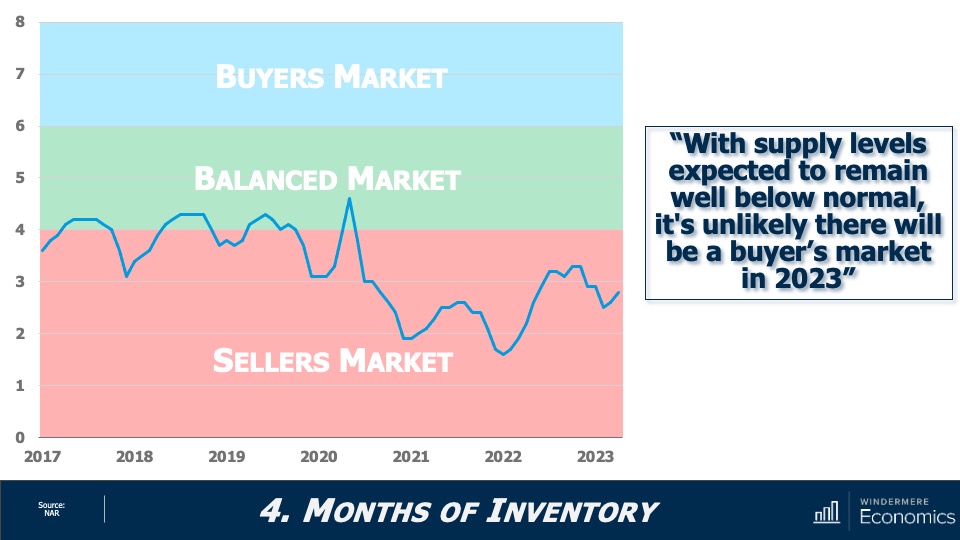
And with limited inventory, the market still “technically” favors home sellers. Now, this is a little speculative because what defines a traditional “buyer’s” or “seller’s” market varies by location, but with relatively few homes on the market and the share of homes with price reductions dropping and list prices rising again, I just can’t see a buyer’s market appearing this year.
Are home prices falling?
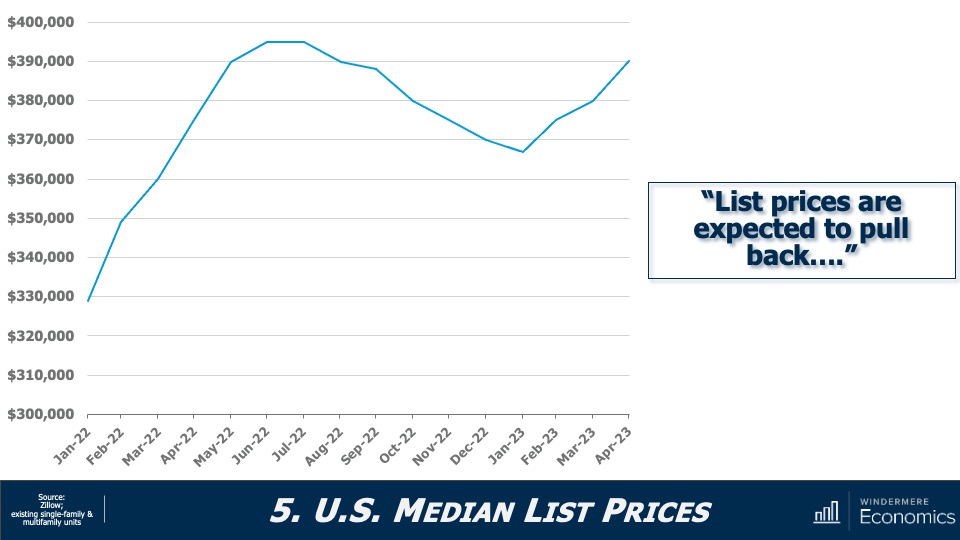
Well, this doesn’t look to be meeting my forecasts, does it! Sellers have been pretty bullish so far this year, but I would add that this is not true across the whole country. List prices are still down significantly in markets such as Hailey, Idaho; Jasper, Alabama; and Elko, Nevada, where list prices for single-family homes are down between 30 and 50% from their peak. So, I admit that the country has outperformed my forecast for list prices.
Return to Office Statistics 2023
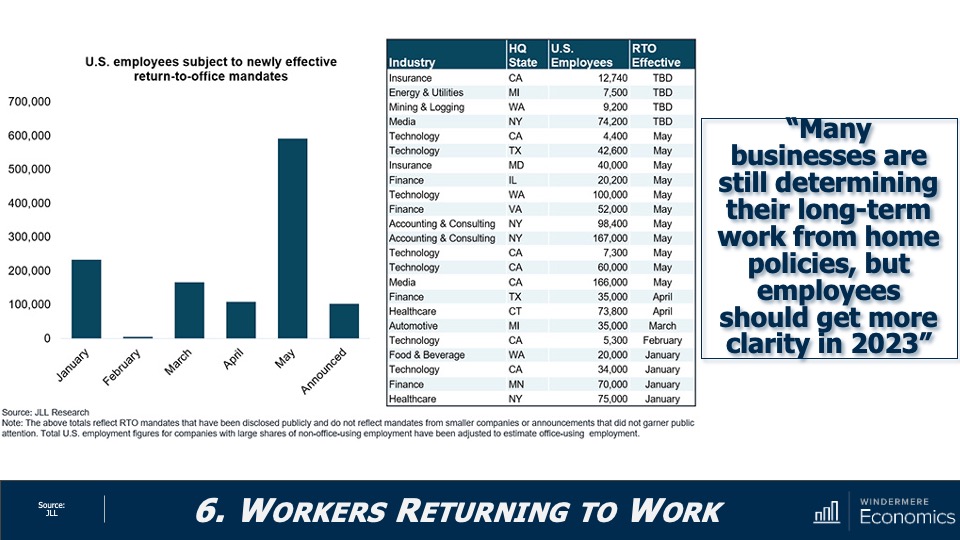
As I had expected, the pace of workers heading back to the office has not been very robust. In fact, the share of people in the office full time dropped to 42% in the second quarter of 2023, down from 49% in the first quarter, that according to The Flex Report. Meanwhile, the share of offices with hybrid work arrangements hit 30% in the quarter, up from 20% the previous quarter. But I still expect to see more workers heading back to their offices, albeit very reluctantly.
New Home Permits and Starts Have Fallen
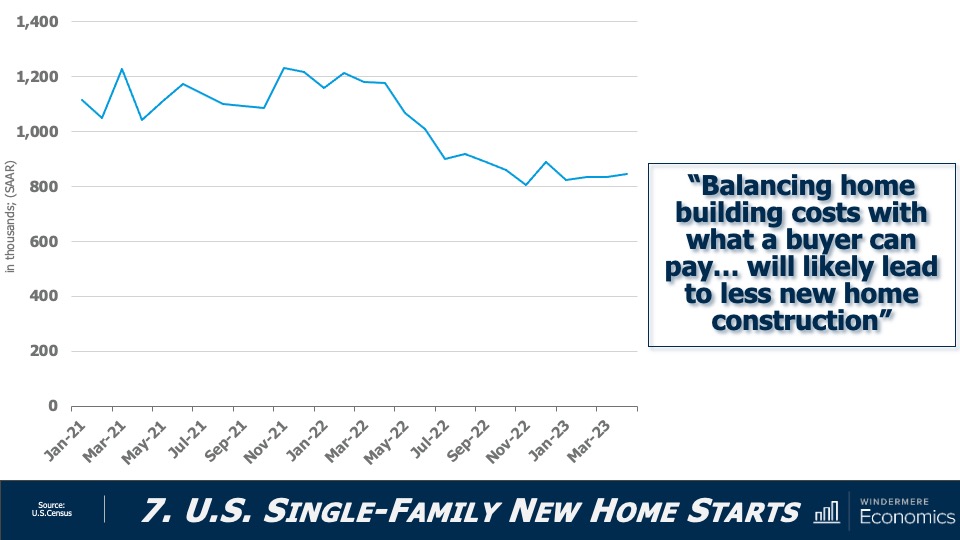
With new home permits down 21% year-over-year, and new home starts off by 28%, I think its accurate to say that activity in the new construction sector has slowed. Builders continue to be hit by high financing rates as well as high material prices.
Are U.S. home prices dropping?
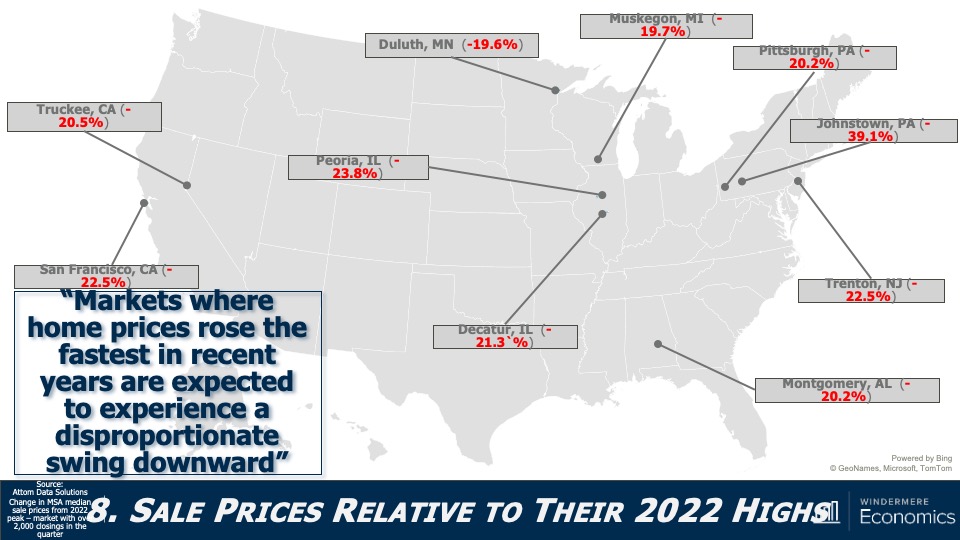
As we all know, not all markets are created equal, and this chart shows how far below their 2022 highs some of the country’s metro areas are. On the opposite end of the spectrum, there are some markets where prices have already exceeded the highs seen last year (see map below).

Housing Affordability 2023
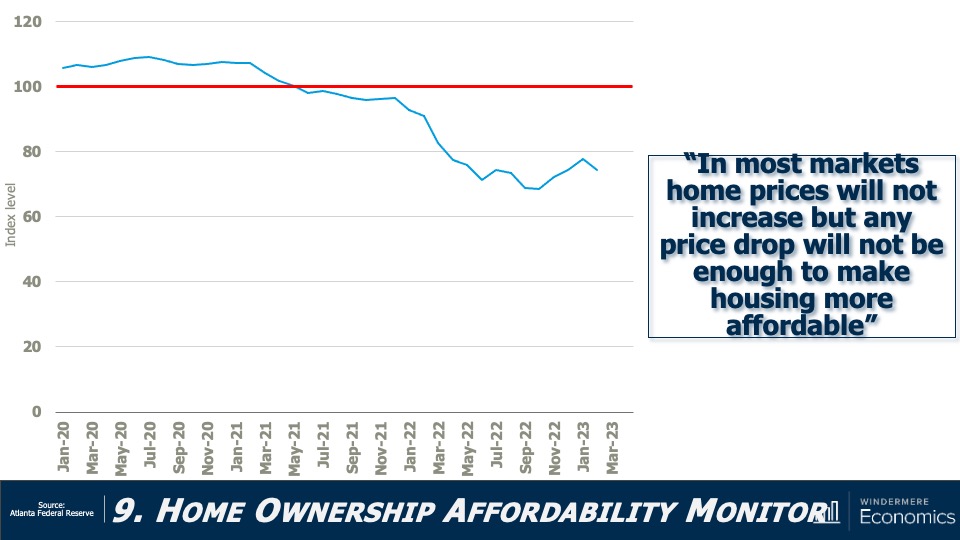
Affordability has not improved, mainly due to home prices that remain out of sync with incomes as well as financing costs that remain well above the level that buyers had become used to. I still believe that this will not improve in 2023.
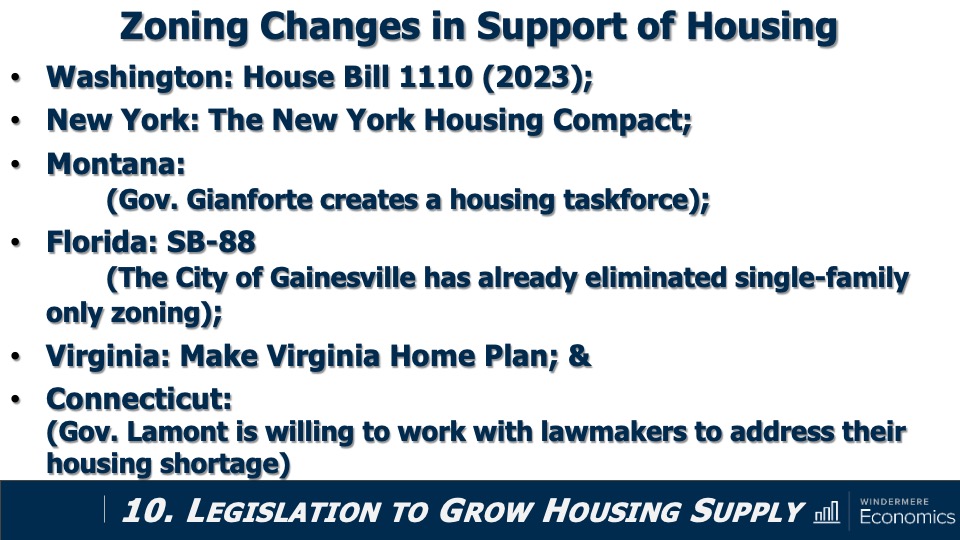
And finally, I told you that governments would start to move to address the significant housing shortage that the country is experiencing, and they have. As you can see, in Washington State, Governor Inslee recently signed House Bill 1110 into law which allows the development of duplex up to six-unit buildings within any area zoned for single-family-only development. Additionally, jurisdictions in a significant number of states are either pursuing legislation to tackle this problem or have at least created task forces to look at the issue. It’s a good start, but more needs to be done.
Although it’s really cheating to grade one’s own work, I think that I have been pretty accurate with my forecasts. Yes, I was too pessimistic when it came to list prices and a little optimistic regarding the direction of mortgage rates. But other than those two items, the data seems to suggest that the housing market is headed in the direction that I had suggested.
What do you think? I’d love to hear your thoughts on this subject so leave your comments below. As always, stay safe out there and I’ll see you all next month. Bye now.
To see the latest real estate market data for your area, visit our quarterly Market Updates page.
About Matthew Gardner
As Chief Economist for Windermere Real Estate, Matthew Gardner is responsible for analyzing and interpreting economic data and its impact on the real estate market on both a local and national level. Matthew has over 30 years of professional experience both in the U.S. and U.K.
In addition to his day-to-day responsibilities, Matthew sits on the Washington State Governors Council of Economic Advisors; chairs the Board of Trustees at the Washington Center for Real Estate Research at the University of Washington; and is an Advisory Board Member at the Runstad Center for Real Estate Studies at the University of Washington where he also lectures in real estate economics.
Would the FHFA Mortgage Fee Changes Have Favored Buyers with Low Credit Scores?
The Federal Housing Finance Authority recently put a hold on raising upfront mortgage fees given pushback that suggested home buyers with good credit were being penalized. Windermere Chief Economist Matthew Gardner looks at Loan Level Price Adjustments (LLPAs) to explain why some headlines were misleading.
This video on the proposed FHFA mortgage fee changes is the latest in our Monday with Matthew series with Windermere Chief Economist Matthew Gardner. Each month, he analyzes the most up-to-date U.S. housing data to keep you well-informed about what’s going on in the real estate market.
FHFA Mortgage Fee Changes
Hello there, I’m Windermere Real Estate’s Chief Economist Matthew Gardner, and welcome to this month’s episode of Monday with Matthew. As most of you are aware, the Federal Housing Finance Authority announced that they were going to raise the upfront fees for mortgages backed by Fannie Mae and Freddie Mac, and that led to significant backlash from some suggesting that borrowers with good credit would now be paying more than borrowers with bad credit.
And as these voices grew louder, Congress stepped in with House Financial Services Committee Chair Patrick McHenry and Housing and Insurance subcommittee Chair Warren Davidson announcing a plan to repeal these fee increases if they were introduced. Well, this did not go unnoticed, and the FHFA announced on May 10th that they were putting a hold on a new fee structure in order to engage industry stakeholders and better understand their concerns.
So, for now nothing has changed, but I still think it’s a subject worth discussing because we will see another proposal from the FHFA at some point in the future. So, what’s going on?
Well, periodically the FHFA raises the upfront fees that the Agencies charge borrowers for the purchase and refinance of mortgages that they guarantee, and these fees are called Loan Level Price Adjustments, or LLPAs.
In April of 2022, these fees went up for several types of loans including ones in expensive markets that have a higher conforming loan limit than seen nationally, and they also raised fees on second home mortgages. But to support affordable housing, the lower rates for certain programs including HomeReady, Home Possible, and HFA Advantage weren’t increased. And they didn’t raise fees for loans to first-time home buyers in high-cost areas if they earned at or below the area median income.
And the new round of fee increases that was scheduled to start in May of this year has many believing that it was just another subsidy given to households with lower credit that’s being paid for by households with better credit. But is that really an accurate statement? I don’t necessarily think so.
First off, the FHFA had to increase fees this year simply because they needed the money to cover higher capital requirements that went into effect last year, but that’s a topic for another day. For now, let’s take a look at the changes that would have been made.
Changes to LLPAs

The matrix you see here shows you the difference between the fee that was in place and the one that was proposed. Remember, this is not the actual fee itself, but the spread between the old and new pricing. And, as you can see, on face value it really does look to benefit borrowers with lower credit scores and penalize households with better credit. For example…
Changes to LLPAs: Credit Score 640 – 659
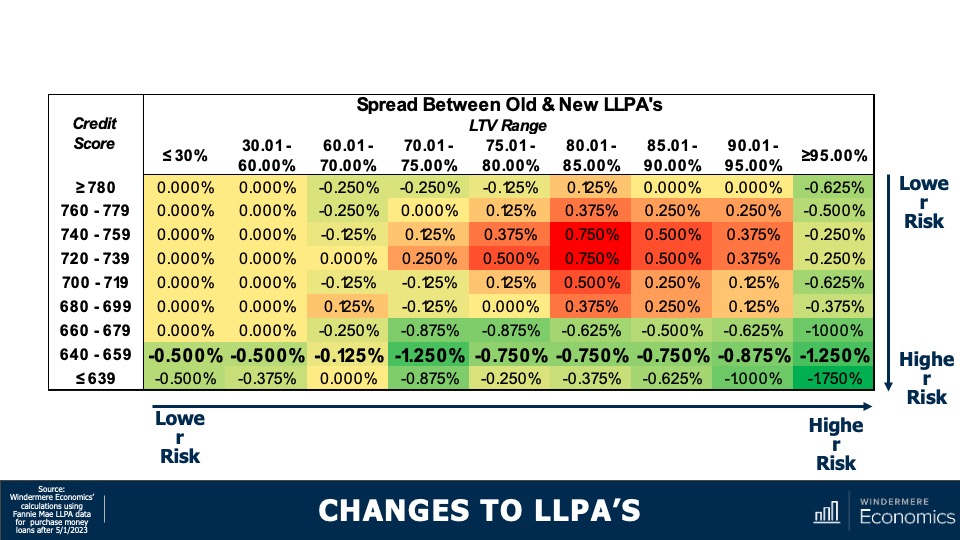
A household with a credit score of between 640 and 659 would see savings across all loan-to-value ranges versus the following:
Changes to LLPAs: Credit Score 740 – 759

A household with a credit rating of 740 to 759 who would be paying the same or more in all bar two scenarios with fees increasing between 0.125% and three quarters of a percent.
But is this really something to be worried about?
There are two things that stand out to me. The first is that a household putting down less than 20% has to buy private mortgage insurance. So, in reality, these households are actually less of a risk to the agencies than those who don’t, so isn’t it right that they should pay less in fees? Secondly, although I can’t disagree with anyone who states that families with lower credit will see fees go down and, generally speaking, they will go up for those with better credit, but people are confusing the CHANGE in the fee with the ACTUAL fee itself.
What I am saying is that low credit borrowers aren’t paying less than high credit borrowers. It’s just the spread in the rates between households with lower credit and those with higher credit has simply gotten smaller.
There is absolutely no scenario where someone with lower credit gets a lower fee. Let me show you.
Loan Level Pricing as of March 1, 2023
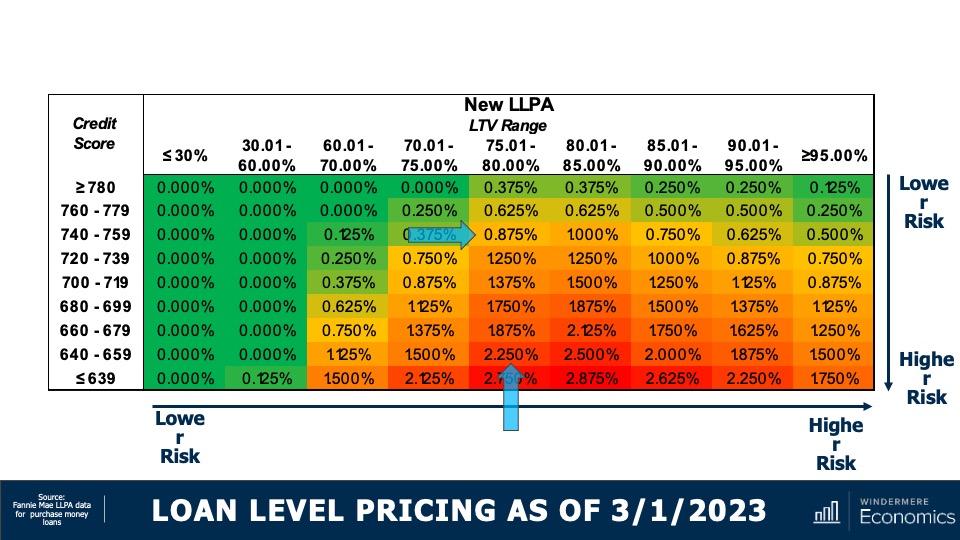
This was the new pricing schedule had it actually come into effect. Now let’s say there are two households wanting to buy houses for $500,000 and both looking to borrow 80% of the purchase price.
One buyer has a credit score of 640, so their LLPA would be 2.25% of the loan amount, or $9,000. The other buyer had a credit score of 740 so their fee would be 0.875%. That means the household with higher credit would be paying $5,500 less than the household with lower credit on a $400k loan.
No one is arguing that households with lower credit scores would have paid less in upfront fees, but I actually don’t see a problem with that. Remember, Fannie and Freddie’s mission is, in part, to facilitate access to affordable housing. Moreover, these fees don’t even apply to non-conforming or jumbo loans and they don’t impact FHA or VA loans either.
Although I certainly don’t know where the FHFA will end up regarding fee changes, they will have to do something at some point. I just hope that any modified plan is presented in a way that fully describes the situation and isn’t one that’s able to be interpreted in a manner which allows for headlines that don’t describe the full picture.
As always, I’d love to hear your thoughts on this subject but, in the meantime, stay safe out there and I’ll see you all next month. Bye now.
To see the latest housing data for your area, visit our quarterly Market Updates page.
About Matthew Gardner
As Chief Economist for Windermere Real Estate, Matthew Gardner is responsible for analyzing and interpreting economic data and its impact on the real estate market on both a local and national level. Matthew has over 30 years of professional experience both in the U.S. and U.K.
In addition to his day-to-day responsibilities, Matthew sits on the Washington State Governors Council of Economic Advisors; chairs the Board of Trustees at the Washington Center for Real Estate Research at the University of Washington; and is an Advisory Board Member at the Runstad Center for Real Estate Studies at the University of Washington where he also lectures in real estate economics.
Mortgage Rate Predictions and Misconceptions
The Federal Reserve Bank of New York just released their 2023 Housing Survey, which shows how the U.S. population feels about the housing market. Windermere Chief Economist Matthew Gardner digs into the mortgage rate predictions, showing how demographics played a role in the results.
This video on mortgage rate predictions is the latest in our Monday with Matthew series with Windermere Chief Economist Matthew Gardner. Each month, he analyzes the most up-to-date U.S. housing data to keep you well-informed about what’s going on in the real estate market.
Mortgage Rate Predictions
Hello there! I’m Windermere Real Estate’s Chief Economist Matthew Gardner. This month we’re going to take a look at the latest SCE Housing Survey, which gives us a really detailed look at consumers’ psyche in regard to the housing market.
I’ve always been fascinated by surveys, as they frequently give me insights that I simply don’t get from just looking at raw data and, as luck would have it, the New York Fed just released its 2023 Consumer Expectations Housing Survey. Now, this particular survey has always given me some great and often surprising insights as to how the U.S. population views the overall housing market. We certainly don’t have time to cover all of the questions that the survey poses, but there was one section I wanted to share with you today as it really resonated with me, and it relates to mortgage rates.
Will mortgage rates continue to rise?
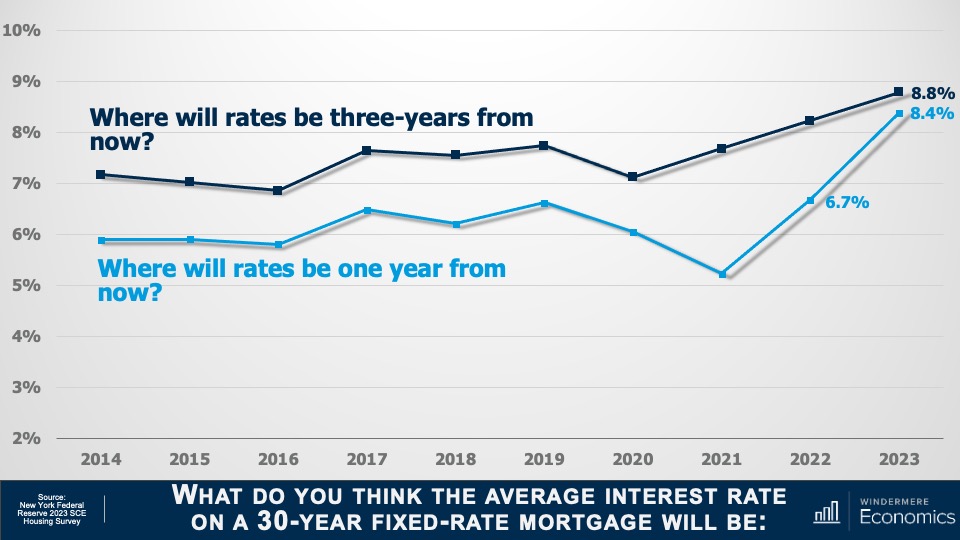
The first question asked was where they expected mortgage rates to be one year from now. And as you see here that, on average, households expected rates to rise all the way up to 8.4%. Although some may see this as extreme, you can see that in the 2022 survey respondents predicted rates would hit 6.7%, almost exactly where they were at the beginning of this March.
And when asked where they thought rates would be three years from now, on average, households expected to see them climb to 8.8%. Now, that’s a rate we haven’t seen since early 1995!
Well, I’m not sure about you, but I was very surprised by these results as they counter just about every analyst’s expectation regarding where rates will be over the next few years. In fact, myself and every economist I know believes that rates will slowly pull back as we move through this year. I haven’t seen a single forecast suggesting that mortgage rates will rise to a level this country hasn’t seen in decades.
But as they say, the devil’s in the details. When I dug deeper into the numbers, it became very clear to me that demographics played a pretty big part in guiding people’s answers. Let me explain.
1-Year Mortgage Rate Expectations by Education
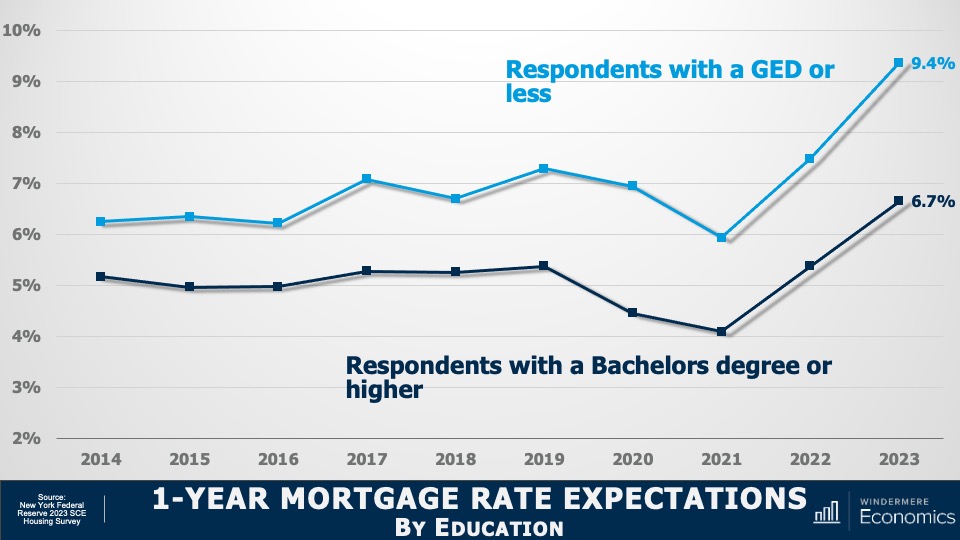
Here the data is broken down by educational achievement. You can see that survey respondents who didn’t have a college degree thought that mortgage rates would rise to 9.4% within a year. But college graduates were far more optimistic, and they expected rates to be in the high 6’s.
3-Year Mortgage Rate Expectations by Education
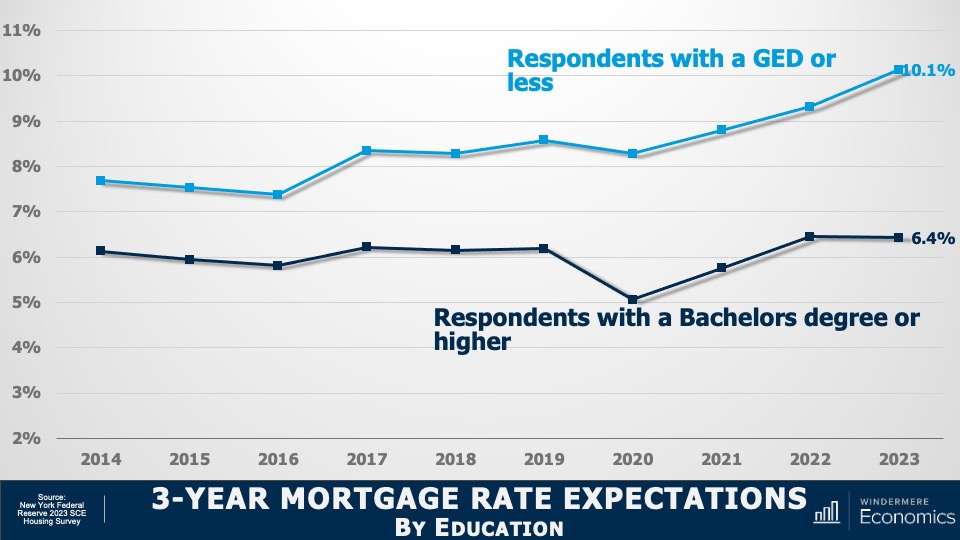
And when asked to look three years out, respondents without degrees expected rates to break above 10%. While college graduates saw them pulling back a little from their one-year expectations of 6.7%, down to 6.4%.
Now we are going to look at the survey results broken down by housing tenure.
1-Year Mortgage Rate Expectations by Tenure
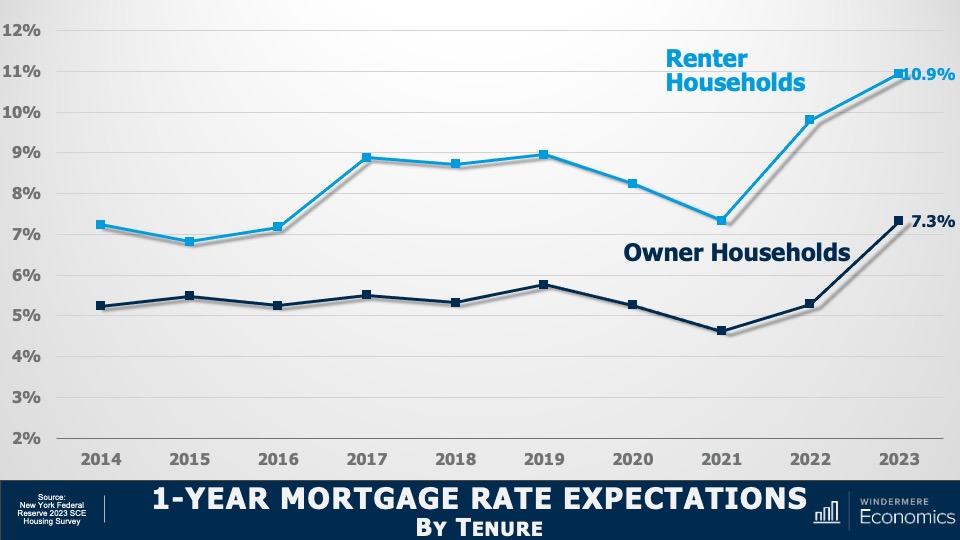
And here you see that renters expect mortgage rates to be at almost 11% within a year. And homeowners also saw them rising, but only up to 7.3%.
3-Year Mortgage Rate Expectations by Tenure
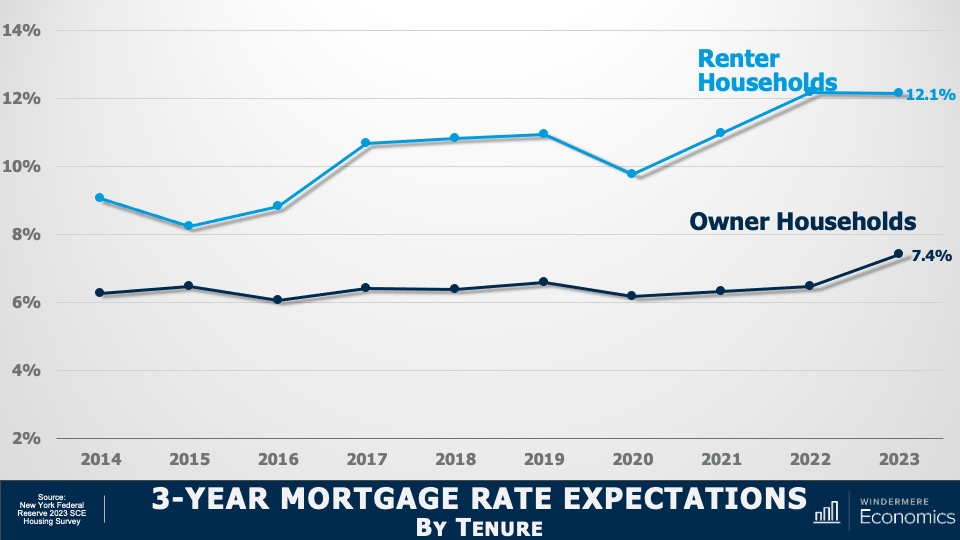
And over the next three years, renters expected rates to break above 12%. That’s a level not seen since the fall of 1985. But homeowners expected to see rates at a somewhat more modest 7.4%.
So, what does this tell us? I see two things.
Firstly, the rapid increase in mortgage rates that we all saw starting in early 2022 has a lot of people believing that we will see rates continuing to rise, sometimes at a very fast pace, over the next few years. I mean, if it happened before, why can’t it happen again? And this mindset leads me to my second point, which is that it’s very clear that a lot of would-be home buyers just don’t understand how mortgage rates are calculated.
The bottom line here is that I see a potential buyer pool out there that needs educating and that can give an opportunity to brokers to discuss how rates are set and where the market is expecting to see them going forward.
This may alleviate the concerns that many households have who may be thinking that they will never be able to afford to buy a home because of where they expect borrowing costs to be in the future. Education is everything, don’t you agree?
As always, I’d love to get your thoughts on this topic so please comment below! Until next month, take care and I will see you all soon. Bye now.
To see the latest housing data for your area, visit our quarterly Market Updates page.
About Matthew Gardner
As Chief Economist for Windermere Real Estate, Matthew Gardner is responsible for analyzing and interpreting economic data and its impact on the real estate market on both a local and national level. Matthew has over 30 years of professional experience both in the U.S. and U.K.
In addition to his day-to-day responsibilities, Matthew sits on the Washington State Governors Council of Economic Advisors; chairs the Board of Trustees at the Washington Center for Real Estate Research at the University of Washington; and is an Advisory Board Member at the Runstad Center for Real Estate Studies at the University of Washington where he also lectures in real estate economics.
Will Rising Foreclosures Impact the Housing Market?
How will rising foreclosures impact the U.S. housing market? To give his answer, Windermere Chief Economist Matthew Gardner sheds light on the latest foreclosure data and shows how prepared home buyers are to manage their mortgage debt today compared to the 2000s.
This video on foreclosures is the latest in our Monday with Matthew series with Windermere Chief Economist Matthew Gardner. Each month, he analyzes the most up-to-date U.S. housing data to keep you well-informed about what’s going on in the real estate market.
Rising U.S. Foreclosures
The market has certainly shifted since mortgage rates started skyrocketing last year and, with prices pulling back across much of the country, some have started to become concerned about the likelihood of foreclosures rising—clearly a timely topic given current circumstances.
Hello there! I’m Windermere Real Estate’s Chief Economist Matthew Gardner and for this month’s episode of Monday with Matthew, I pulled the latest data on foreclosure starts and looked and the quality of mortgages that have been given to buyers in order to give you a clear idea of how foreclosures will impact the overall housing market.
For the purposes of this exercise, I’m going to concentrate on foreclosure starts rather than foreclosure filings because data shows us that a majority of homeowners where a foreclosure filing has been submitted to a court by their lender are able to avoid it by refinancing or selling the home, which makes total sense as over 93% of owners in the U.S. have positive equity.
U.S. Foreclosures: Starts 2007-2022
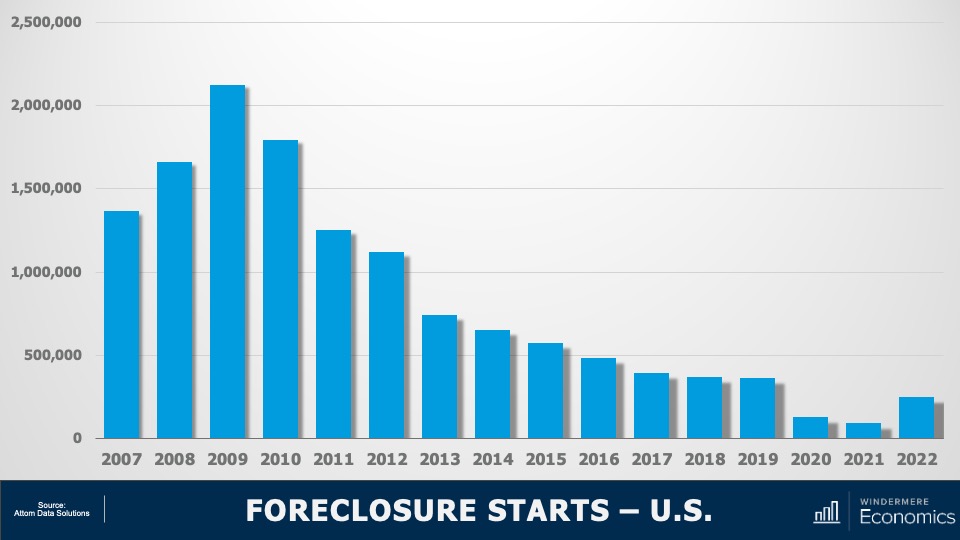
As you can see here, foreclosure starts rose significantly last year. In fact, they were 181% higher than in 2021. But if we zoom out, it’s important to note that foreclosure starts were 31% lower than 2019 and 88% lower than the 2009 peak.
Am I surprised at the increase in foreclosure starts? Not really. The forbearance program was put in place at the start of the pandemic, and it allowed homeowners to temporarily stop making mortgage payments and not be foreclosed on, but that program ended 18 months ago.
And, although a vast majority of the 4.7 million households who entered the program have left it and sold or refinanced their homes, there were always going to be some who were not able to, and this has led to the overall foreclosure activity rising. Let’s take a closer look.
U.S. Foreclosures in 2022
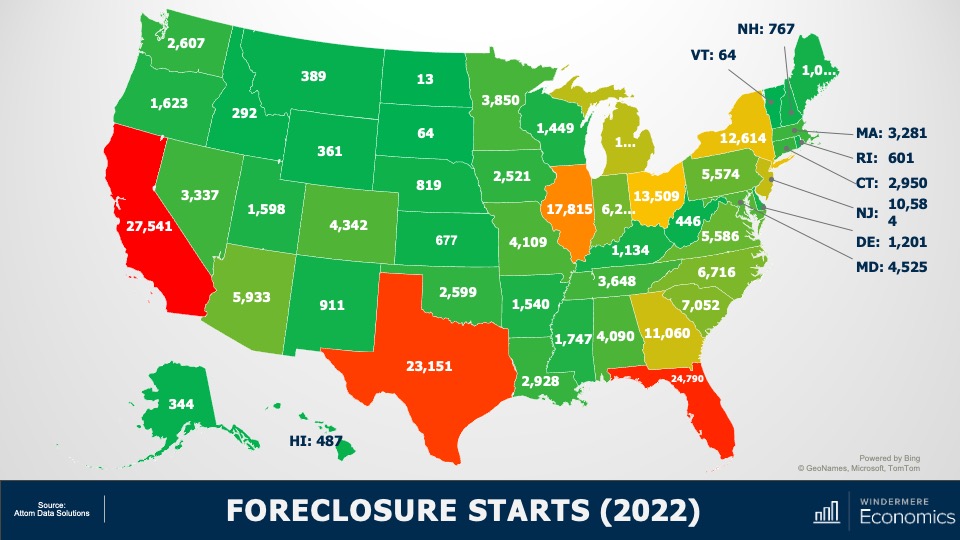
This is a heat map of foreclosure starts by state. And you can see that California, Florida, and Texas saw the highest numbers in 2022. But remember that these are the states that have the greatest number of homes with mortgages so, statistically, we would expect the total number of homes in foreclosure in those states would be higher than the rest of the country. That said, foreclosure starts were significantly higher in Florida, California, Texas, and New York than they were in 2019, the last “pre-COVID” year and before the forbearance program started.
And when we look more myopically, metro areas including New York/New Jersey, Washington DC, the Delaware Valley, Atlanta, Miami, Baltimore, and Dallas all saw total foreclosure starts rise well above what they were in 2019. This may suggest that there are some markets that could see foreclosure activity rise to a level that could materially impact housing in those locations.
But looking at the country as a whole, there are other factors leading me to believe that we will not see the number of homes entering foreclosure rising above the long-term average, and certainly not sufficient to have a material impact on U.S. housing prices.
Let me show you what’s happening on the mortgage side of things. First: credit quality.
Median FICO Scores for New Mortgages 2003-2022
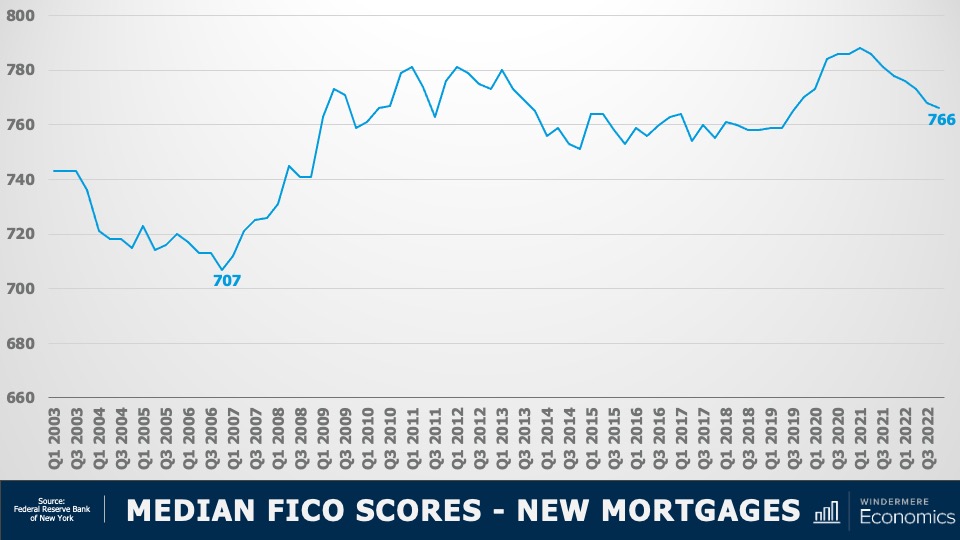
The median FICO score for new mortgages was 766 in the 4th quarter of 2022. Yes, this is down from the peak seen in early 2021 when it was a whopping 788 but as shown here, it’s far higher than we saw before the housing crisis. Buyers over the past several years had very good credit and, given the tight labor market, we are certainly in a very different place than back before the housing bubble burst.
Mortgage Debt Payments Percentages 2007-2022
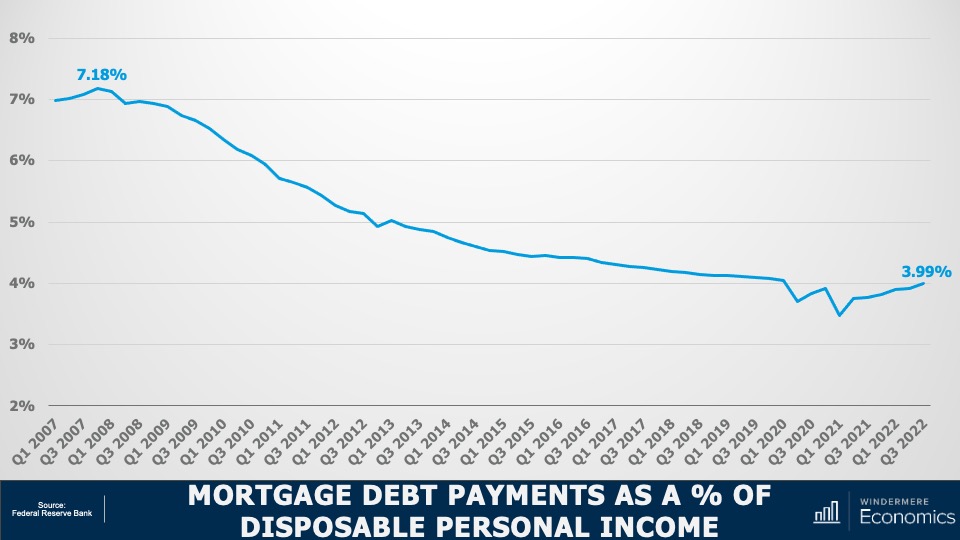
Secondly, buyers are using larger down payments than in the mid-2000’s, and with the historically low mortgage rates that we saw during the first two years of the pandemic benefitting new buyers as well as allowing existing homeowners to refinance, the share of disposable income that is used to cover mortgage payments remains very low. This basically means that owners aren’t as burdened by their house payments as they were in 2007-2009. And finally…
Equity Rich Households Q4 2022
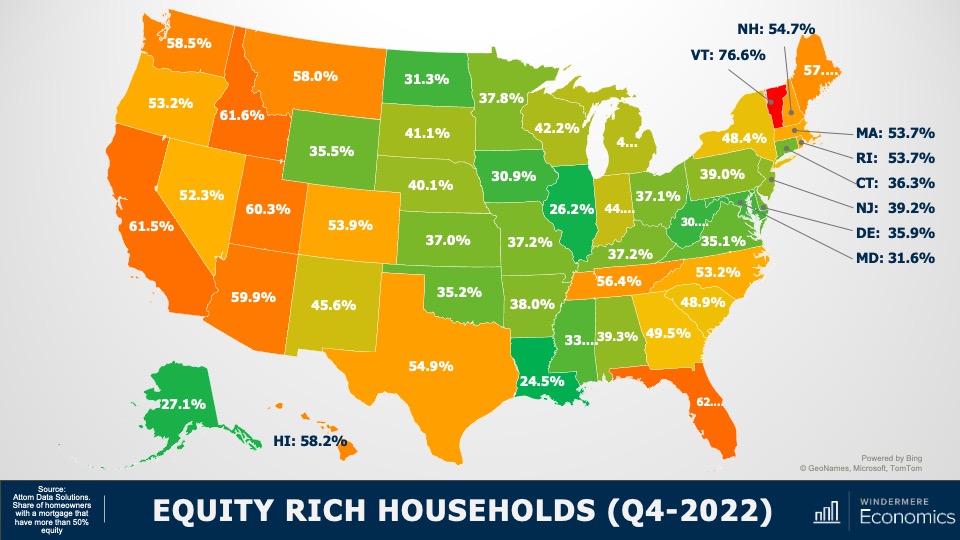
With the significant run-up in housing values that we have seen over the past few years, 48% of all homeowners with a mortgage have more than 50% equity. Although this share has pulled back a little as mortgage rates rose and values pulled back, it’s still a massive amount of money and, as I mentioned earlier, many homeowners who are faced with foreclosure will end up selling their homes as they still have positive equity rather than go through the foreclosure process.
So, my answer to those of you wondering if we will see foreclosures rise to a level that could impact the overall housing market is “no.”
I don’t see any reason to believe that distressed sales will hurt the market in general, but I will say that there are some local markets where distressed sales could rise to levels that could act as a headwind to price growth in these areas. As always, I’d love to get your thoughts on this topic so please comment below! Until next month, take care and I will see you all soon. Bye now.
To see the latest housing data for your area, visit our quarterly Market Updates page.
About Matthew Gardner
As Chief Economist for Windermere Real Estate, Matthew Gardner is responsible for analyzing and interpreting economic data and its impact on the real estate market on both a local and national level. Matthew has over 30 years of professional experience both in the U.S. and U.K.
In addition to his day-to-day responsibilities, Matthew sits on the Washington State Governors Council of Economic Advisors; chairs the Board of Trustees at the Washington Center for Real Estate Research at the University of Washington; and is an Advisory Board Member at the Runstad Center for Real Estate Studies at the University of Washington where he also lectures in real estate economics.
Renting vs. Buying a Home: The Financial Benefits of Homeownership
This video is the latest in our Monday with Matthew series with Windermere Chief Economist Matthew Gardner. Each month, he analyzes the most up-to-date U.S. housing data to keep you well-informed about what’s going on in the real estate market.
Renting vs. Buying a Home
One of my followers asked me about some of the financial benefits of owning your home as opposed to renting. I find this topic interesting as there really is a “laundry list” of reasons that, from a financial standpoint, owning a home is better than renting.
I’m Matthew Gardner Chief Economist at Windermere Real Estate and welcome to this month’s episode of Monday with Matthew. Let’s get to the topic at hand. Of course, I don’t have time to go through them all today but here are the ones that I think are the most compelling: wealth building and tax benefits.
The Financial Benefits of Homeownership
The first thing to understand is that, over time, a mortgage becomes easier to afford. You see, when you buy a home, the mortgage payments themselves don’t change and, over time, your earnings rise but the mortgage payment doesn’t. Simply put, unlike renters who generally see their rents going up every year, your mortgage payment never will and because you’ll hopefully be making more money as time goes by, the share of your income that you spend on a mortgage payment becomes less & less.
The next advantage to owning your home is that it is a good long-term investment. Of course, some will say that this is not the case because we went through the housing bubble bursting back in 2006 but there have actually been very few times in history when home prices have seen any long-term downward adjustment.
Now I know some will say that investing in stocks would give you a higher long-term return. My response to that would be I’ve never seen anyone living under a stock certificate. Have you?
My next reason for believing that ownership is better than renting is rather simple, and that is because a portion of every mortgage payment you make goes toward reducing the principal amount of the loan. Of course, during a majority of the term of the mortgage most of the payment is going towards interest but, a small portion is paying down the debt itself—in essence making it a forced savings plan, building wealth along the way.
Tax Advantages of Owning a Home
But what about the tax advantages? Owning a home offers unique and substantial ways to save on your taxes every year. Firstly, you can deduct your real estate taxes every year. Now, tax reform has limited the total allowed deduction, but it is still meaningful. You can also deduct the interest you pay on your mortgage. Again, there are some limitations but, depending on where you live you could save a significant amount.
And finally, let’s talk Capital Gains Taxes. When you sell your primary residence and have seen its value grow since you purchased it, up to $250,000 of that profit (if you’re a single person) or $500,000 if you’re married and filing jointly is tax free. Now, this is only true if you meet certain requirements with the biggest one being that you have to have lived in the house for a minimum of two years during the preceding five-year period.
If that’s not enough to convince you that there are very significant advantages to owning a home over renting, I will leave you with one last datapoint that you may find of interest.
Renting vs. Owning a Home: Household Net Worth
Using Federal Reserve data as a base, I’ve been able to calculate the median net worth of a household in America who owned their homes versus a household that rents.
- In 2022, the median household wealth of a homeowner household here in America was approximately $330,000.
- The median household wealth for a renter household in this country last year was just $8,000.
As you can see, that’s quite the discrepancy between the two. I think it’s very clear that homeownership for a vast majority of families is how they create most of their wealth.
I hope you found this topic of interest. Of course, if you have any questions or comments please do let me know as I do enjoy hearing from you. Take care and I look forward to talking to you all again next month.
Data combined and calculated by Windermere Economics
About Matthew Gardner
As Chief Economist for Windermere Real Estate, Matthew Gardner is responsible for analyzing and interpreting economic data and its impact on the real estate market on both a local and national level. Matthew has over 30 years of professional experience both in the U.S. and U.K.
In addition to his day-to-day responsibilities, Matthew sits on the Washington State Governors Council of Economic Advisors; chairs the Board of Trustees at the Washington Center for Real Estate Research at the University of Washington; and is an Advisory Board Member at the Runstad Center for Real Estate Studies at the University of Washington where he also lectures in real estate economics.
")


