
 Facebook
 X
X
 Pinterest
 Copy Link

This is the latest in a series of videos with Windermere Principal Economist Jeff Tucker where he delivers the key economic numbers to follow to keep you well-informed about what’s going on in the real estate market.
This week I’m jumping right back in to check on the elephant in the room this spring: tariffs. The first number to know is
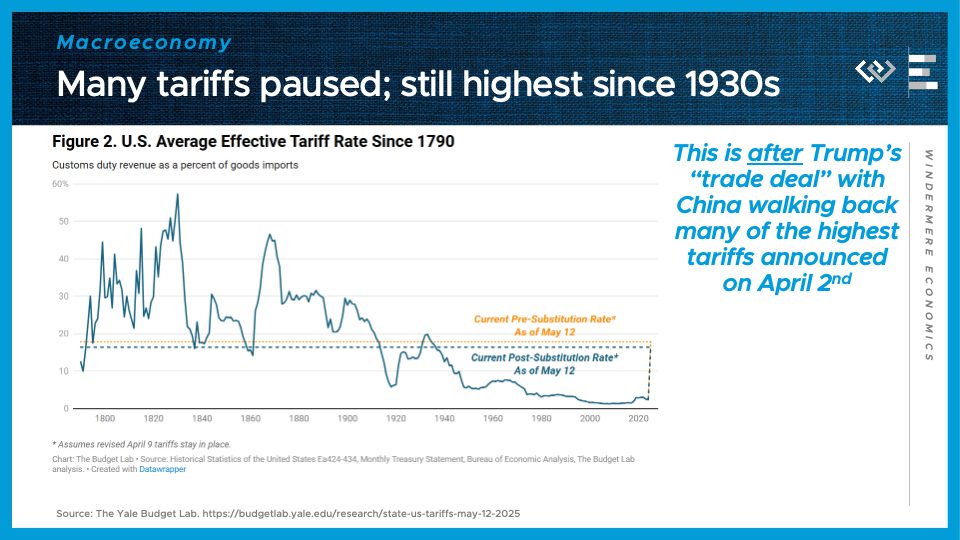
17.8%
The new average effective tariff rate on US imports, which is down sharply from 27% last month, but still the highest since 1934, and still about 5 times the level prevailing at the start of this year. That’s according to the Yale Budget Lab’s latest estimates as of the week of May 12.
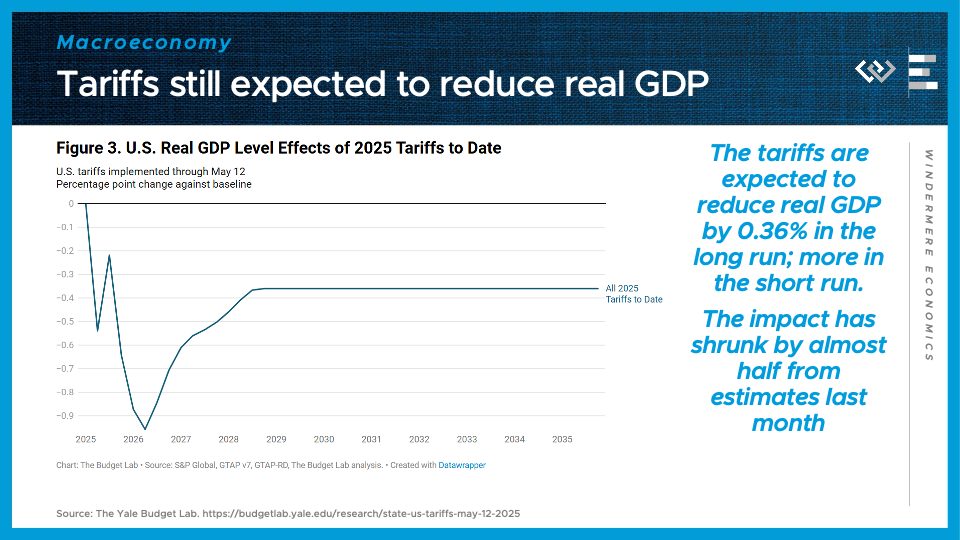
This smaller tariff hike will still be expected to reduce real GDP in the United States. The Yale Budget Lab’s model predicts a decline in real GDP of 0.36 percentage points in the long run, after a deeper short-run negative shock. But like the tariffs themselves, that impact has shrunk by almost half from what was projected under the much harsher tariffs last month.
Just as important as the reduction in proposed tariffs, is the sense that investors are getting that this means more walkbacks are on their way.
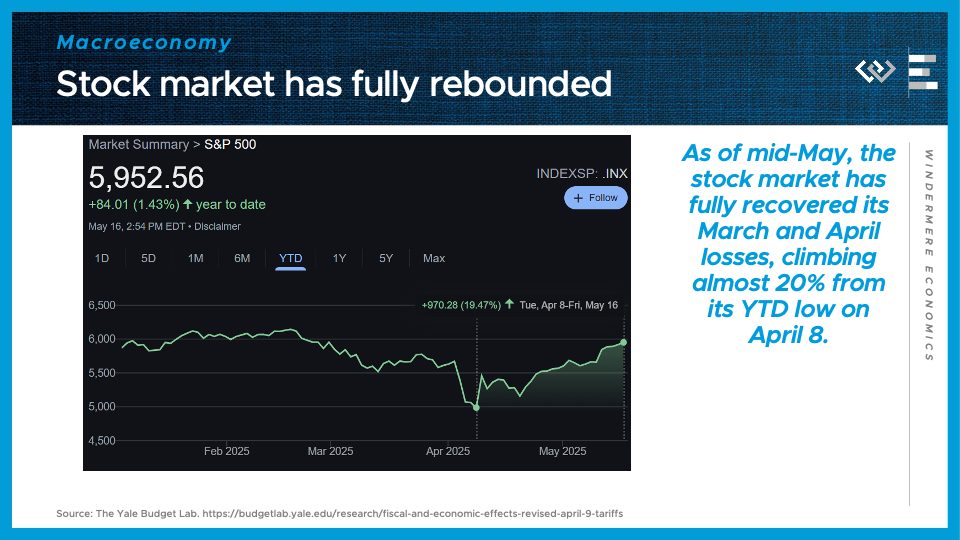
The stock market in particular has now fully regained all its losses, and has now risen slightly year-to-date, or about 20% from its early April trough. That suggests to me that investors have concluded we won’t actually see a major hit to growth of US companies’ profits, and US economic output, after all this year.
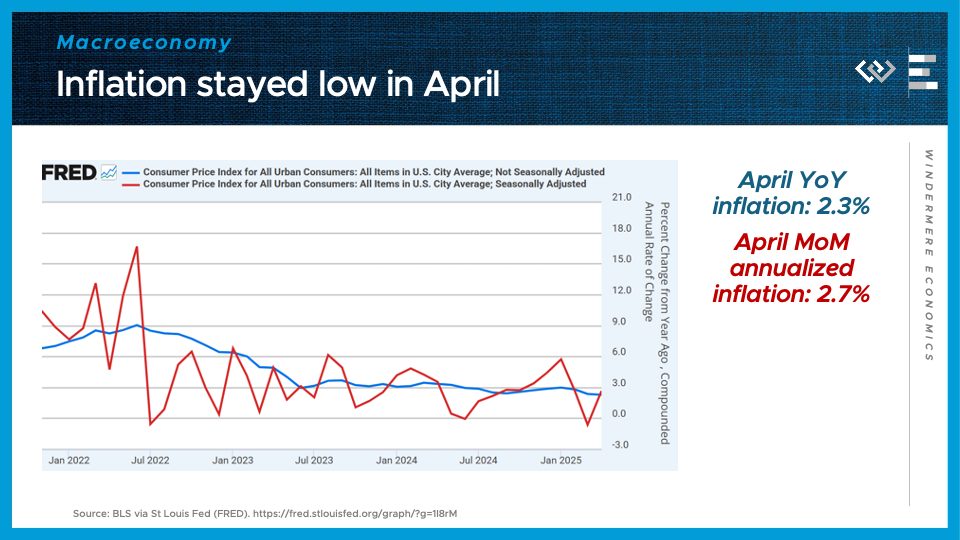
The tariffs that have gone into effect are still not passing through much of a price shock to consumers. April inflation data came in about as expected, without a spike in goods prices yet, so year-over-year inflation ticked down again, now to 2.3%.
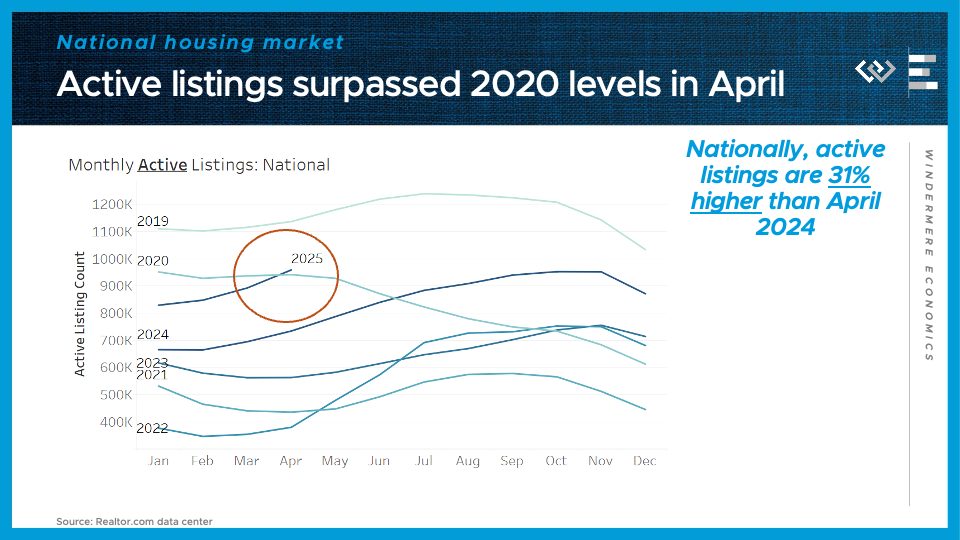
Turning to the national housing market, we reached a major milestone of seeing more active listings at the end of April than the same month in 2020 – the first time that has happened since the inventory plunge began that spring. Many parts of the country now have inventory even above 2019 levels, including the Pacific Northwest. Active listings ended the month of April 31% higher than the same time last year.
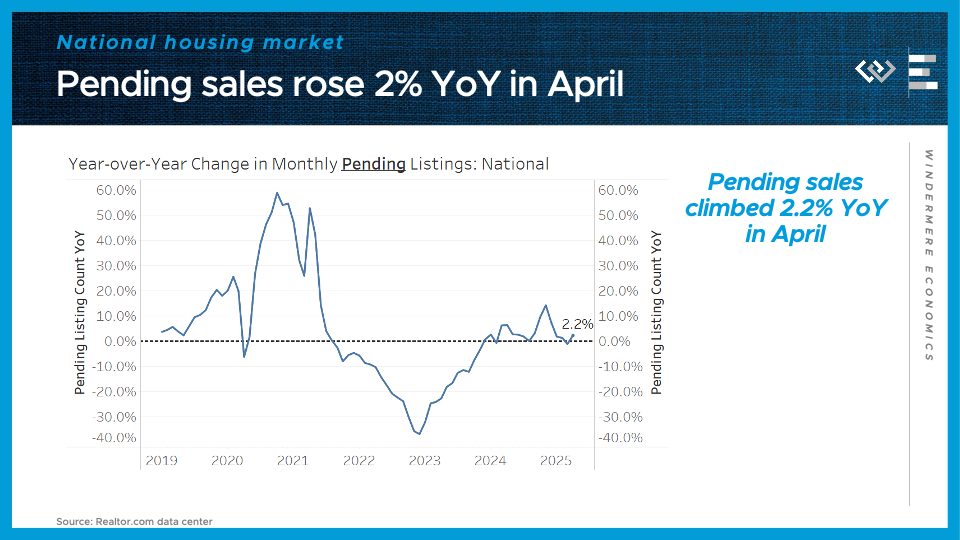
Pending sales actually ticked up slightly year-over-year in April, by 2.2%. This was surprisingly upbeat, given the negative turn in consumer sentiment last month, and I think it masks a lot of regional variation, like a 12.7% year-over-year decline in the Seattle metro area this April.
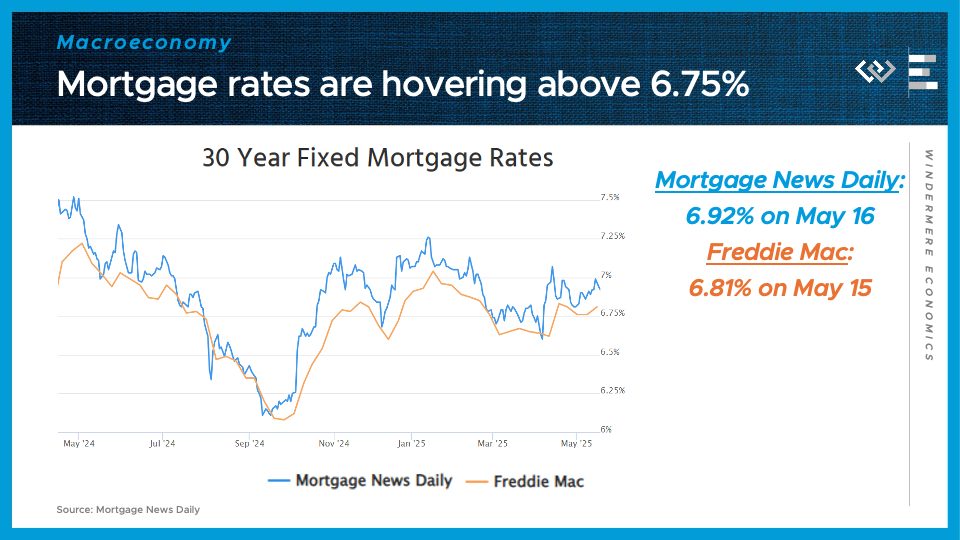
Finally, I’ll end by checking in with the USUAL elephant in the room: mortgage rates, which are still stuck in a range between 6 and ¾, and 7%. It seems like the bond market just can’t catch a break this year, because even after the stock market recovered from the tariff turmoil, the falling fear of a recession, and rising expectations for an explosion in the deficit based on Congressional budget drafts now circulating, are conspiring to keep bond yields and mortgage rates high for the foreseeable future.
")


