
 Facebook
 X
X
 Pinterest
 Copy Link

The following analysis of the greater Las Vegas real estate market is provided by Windermere Real Estate Chief Economist Matthew Gardner. We hope that this information may assist you with making better-informed real estate decisions. For further information about the housing market in your area, please don’t hesitate to contact your Windermere Real Estate agent.
Regional Economic Overview
The Las Vegas labor market continues to recover from the pandemic, but the question is whether the latest variant of COVID-19 will slow the job recovery. The area has recovered over 204,000 of the more than 280,000 jobs that were lost in early 2020, which means Las Vegas is still 76,000 jobs shy of pre-pandemic levels. As jobs return, the unemployment level drops. The latest data shows that 6.3% of the workforce is still unemployed. This is a high number given that the pandemic started over 22 months ago, but it is still a significant improvement over the pandemic peak of 33.3%. The employment picture is one of a somewhat slow, but steady, recovery. The question remains as to what impacts, if any, the rise of the Omicron variant of COVID-19 will have.
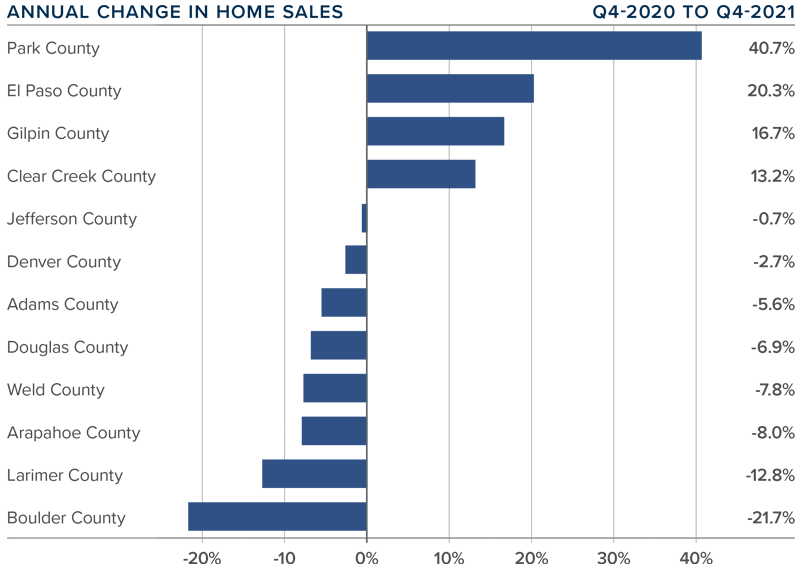
nevada Home Sales
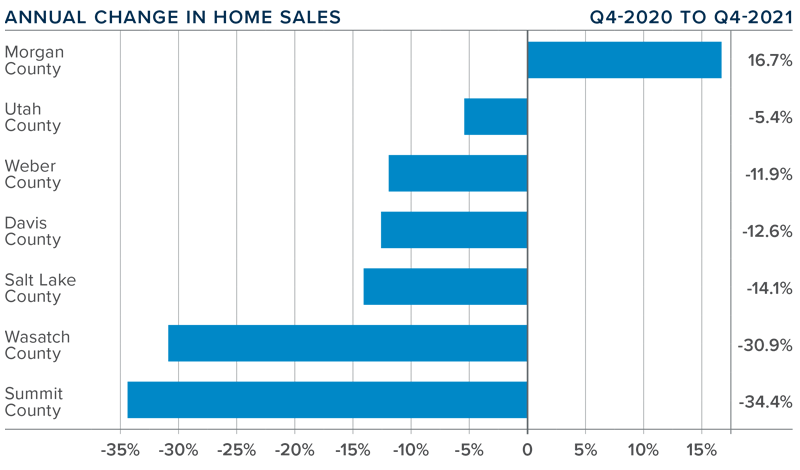
❱ A total of 10,222 homes sold in the final quarter of 2021—an increase of 2.1% compared to the same period a year ago, but 4.4% lower than the previous quarter.
❱ Pending sales, which are an indicator of future closings, fell 11.3% compared to the third quarter of the year, suggesting that closings in the first quarter of 2022 may not be robust.
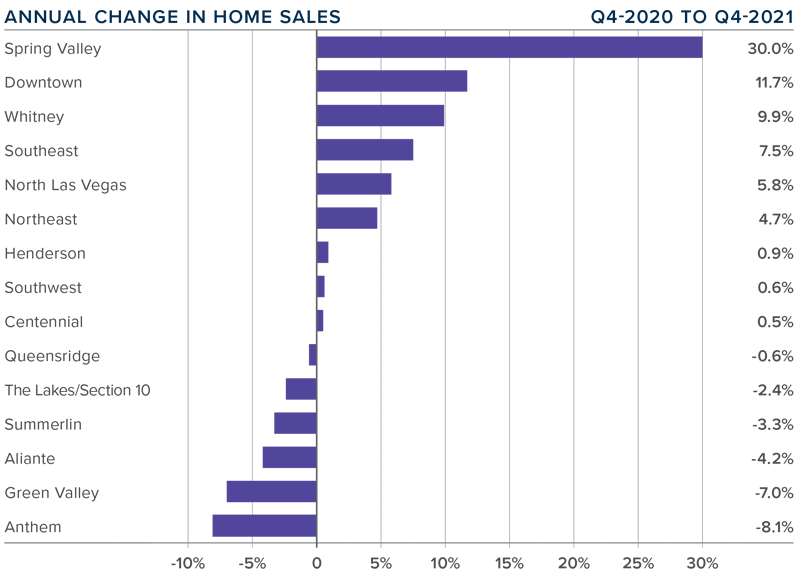
❱ Sales were a mixed bag, rising in nine neighborhoods but falling in six. Spring Valley and Downtown saw significant increases. Where sales fell, the drop was modest. Compared to the third quarter, sales fell in all markets other than Northeast Las Vegas, Spring Valley, and Queens Ridge, but this can be attributed to seasonality as well as remarkably low supply levels.
❱ There were 34.9% fewer homes for sale in the quarter compared to the previous year, which likely impacted closed and pending sales.
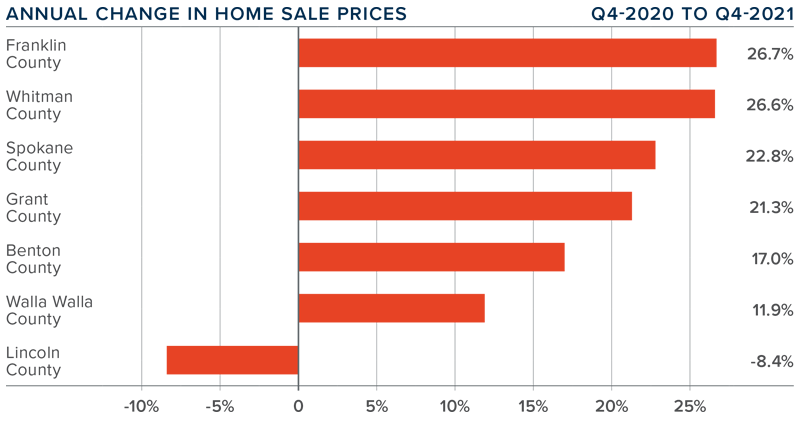
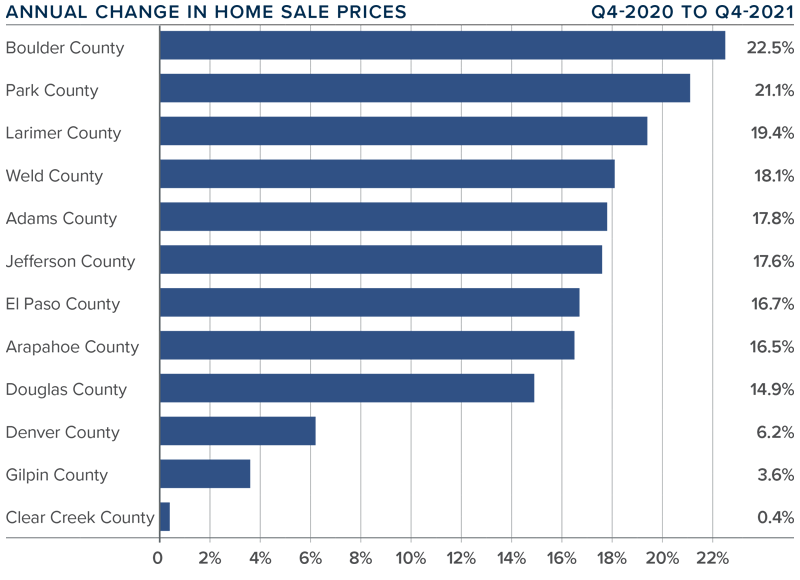
nevada Home Prices
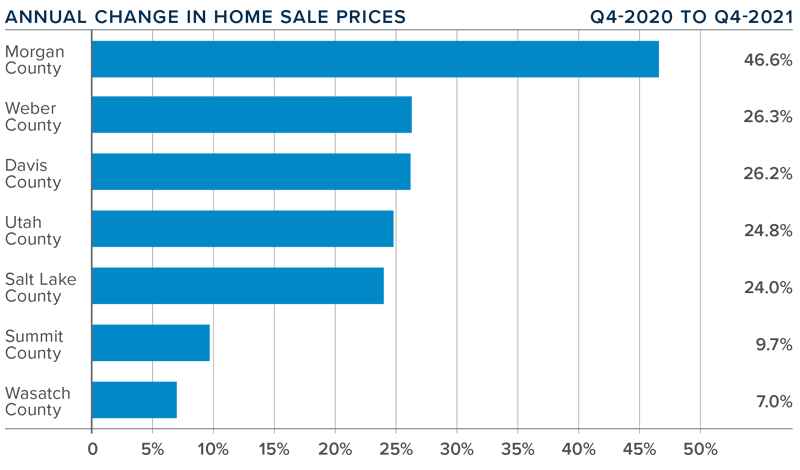
❱ Home prices rose 19.7% from a year ago to an average of $459,151. Prices were also 4.6% higher than in the third quarter of 2021.
❱ Mortgage rates notched up last fall, but the impact was not enough to significantly slow price growth. Additionally, fewer homes for sale meant that the market remained hot.
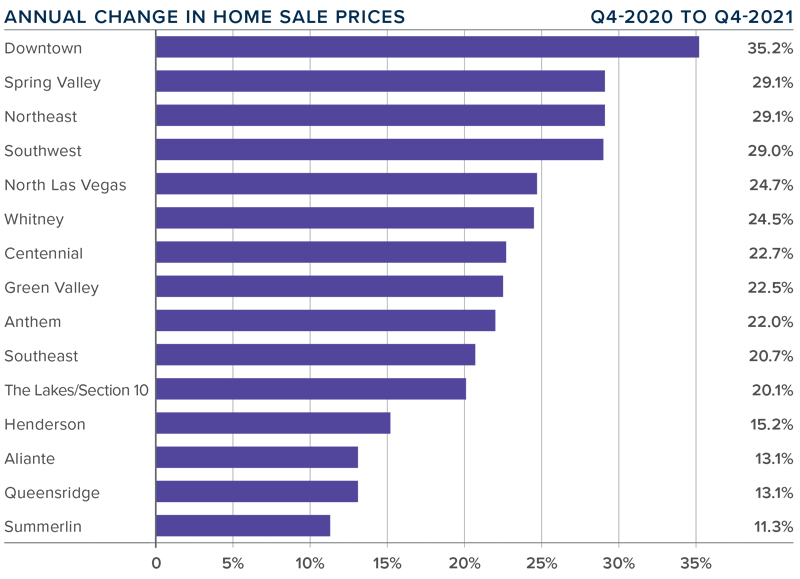
❱ Prices rose by double digits in every sub-market compared to the same quarter last year and rose in all markets other than Henderson and Queens Ridge compared to the third quarter.
❱ The labor market continues to improve, and mortgage rates have yet to get to a point where they could have a tangible impact on prices. That said, I expect them to rise as we move through 2022, which will likely act as somewhat of a headwind to price appreciation.
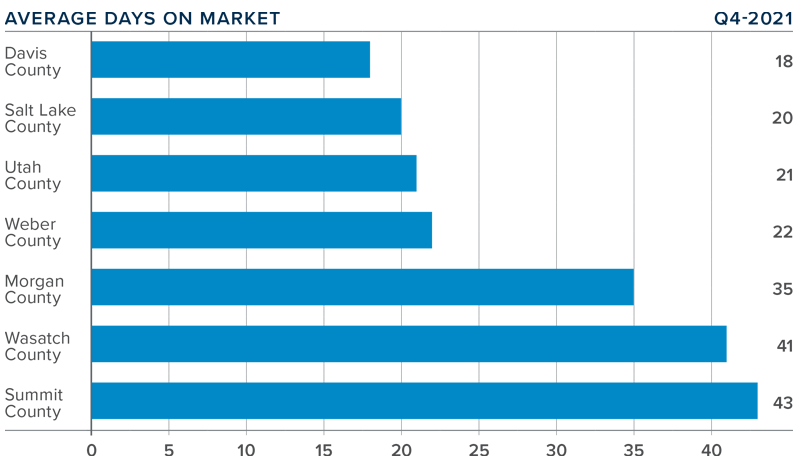
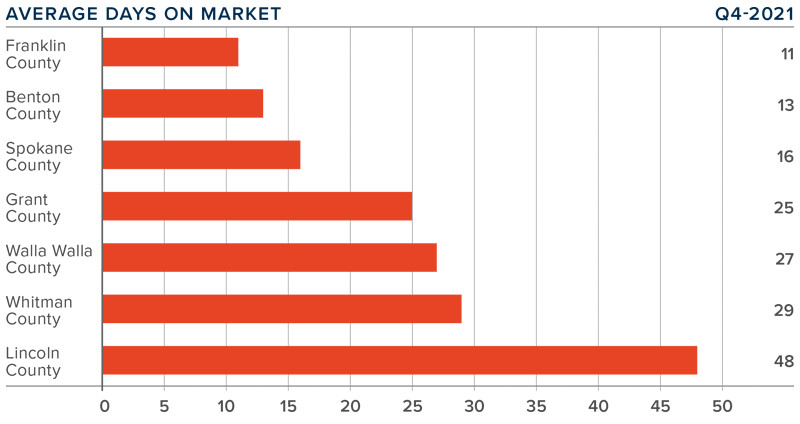
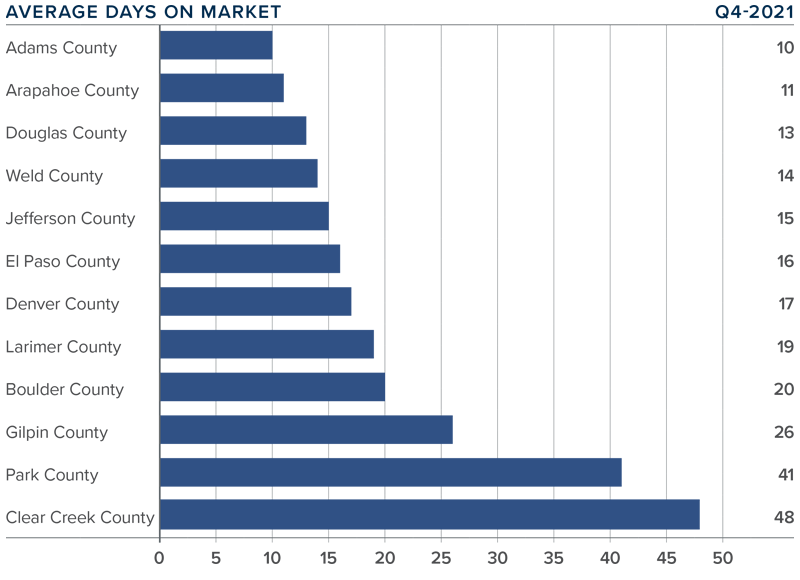
Days on Market
❱ The average time it took to sell a home in the region dropped 14 days compared to the fourth quarter of 2020.
❱ It took an average of 23 days to sell a home in the quarter, which was 5 more days than in the third quarter of the year.
❱ Days-on-market dropped across the board compared to a year ago but rose in all areas other than Downtown and Queens Ridge compared to the prior quarter.
❱ The greatest drop in market time was in the Aliante market, where the length of time it took to sell a home fell 31 days compared to a year ago.

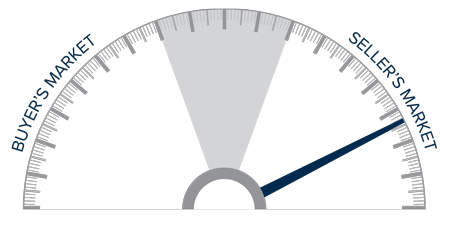
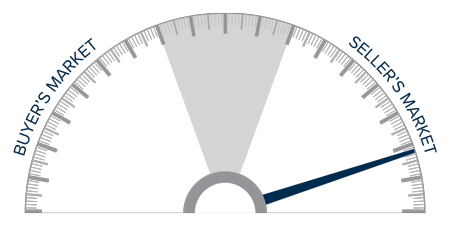
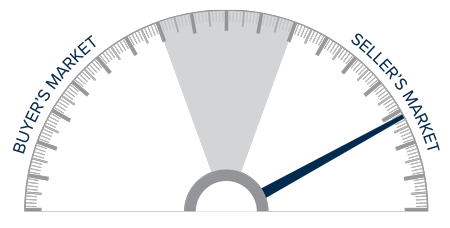
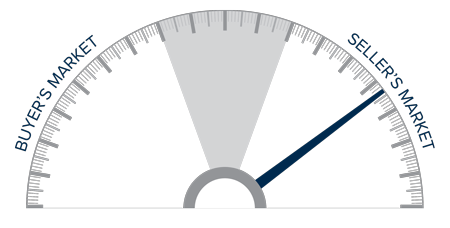
Conclusions
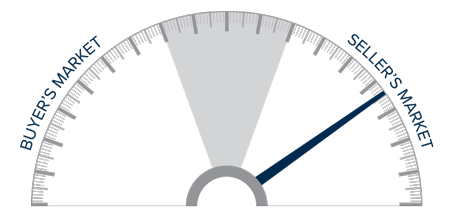
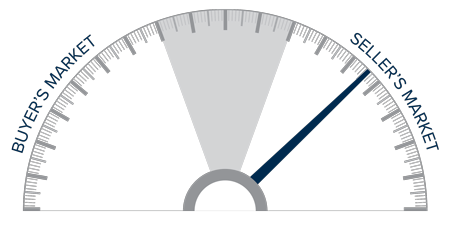
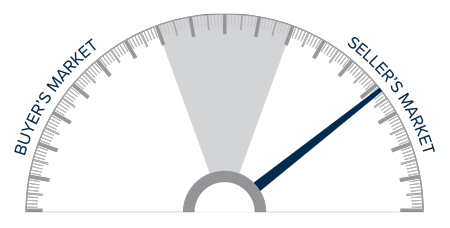
This speedometer reflects the state of the region’s real estate market using housing inventory, price gains, home sales, interest rates, and larger economic factors.
The job market continues to improve and, despite rising mortgage rates, there appears to still be significant demand from home buyers. Listing prices leveled off last summer, which might have led some to believe that the market was cooling off, but they started rising again in the fall. This was probably disappointing for home buyers who have been in a highly competitive market for quite some time.
Given all the data, and even in the face of mortgage rates that will continue rising for the foreseeable future, I have moved the needle a little more toward sellers as they are still in control.
About Matthew Gardner

As Chief Economist for Windermere Real Estate, Matthew Gardner is responsible for analyzing and interpreting economic data and its impact on the real estate market on both a local and national level. Matthew has over 30 years of professional experience both in the U.S. and U.K.
In addition to his day-to-day responsibilities, Matthew sits on the Washington State Governors Council of Economic Advisors; chairs the Board of Trustees at the Washington Center for Real Estate Research at the University of Washington; and is an Advisory Board Member at the Runstad Center for Real Estate Studies at the University of Washington where he also lectures in real estate economics.


")


