
 Facebook
 Twitter
 Pinterest
 Copy Link

ECONOMIC OVERVIEW
The State of Utah added 37,300 non-agricultural jobs over the past 12 months, a growth of 2.6%. Although this represents a slowing in employment gains, it is not a cause for concern because the economy is running at full employment and only so many new jobs can be created. That said, my latest forecast model is suggesting that the pace of employment growth is likely to kick back up during the last quarter of the year.
In August, the unemployment rate in the state was 3.5%, up from 3.3% a year ago. The increase in the unemployment rate is a function of a burgeoning labor force, which has risen by almost 56,000 over the past year.
HOME SALES ACTIVITY
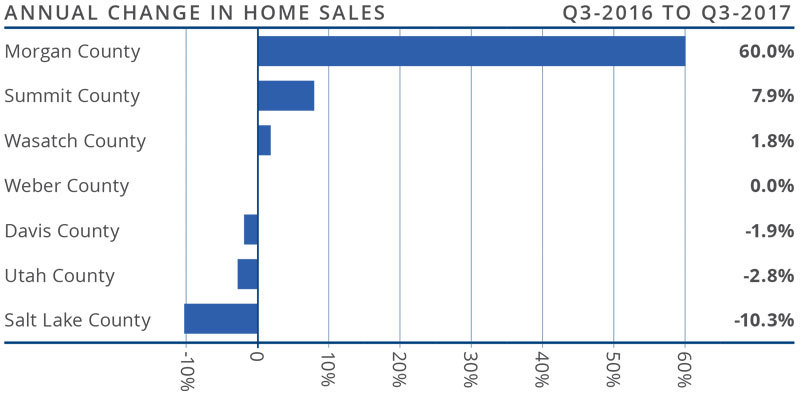
- There were 9,907 home sales during the third quarter of 2017, which was a drop of 5.3% from the same period in 2016.
- Sales rose in just one of the counties analyzed in this report: small Morgan County saw sales grow 60% year-over-year. It’s worth noting though that this equates to an increase of just 18 units. There were more marginal sales increases in Summit and Wasatch Counties. Sales fell marginally in Davis and Utah Counties, with a more severe drop in Salt Lake County.
- Home sales slowed due to very low levels of available inventory. Listing activity continues to trend at well below historic averages, with the total number of homes for sale in the third quarter 26.6% below the level seen a year ago.
- The takeaway here is that unless we see a drastic increase in listings, sales growth will remain at below-average levels.
HOME PRICES
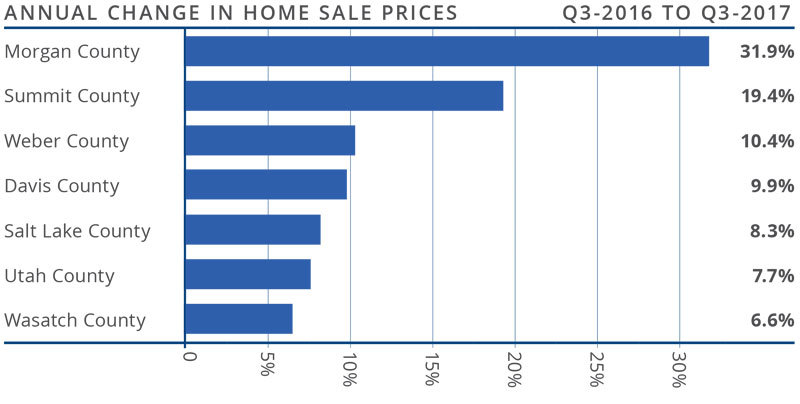
 Because of considerable competition for the few available homes, prices continue to rise. Average prices in the region were up 10.2% year-over-year to an average of $340,031.
- There was substantial price growth in Summit and Weber Counties, where prices rose by double digits. That said, all counties saw higher home prices in the third quarter than a year ago.
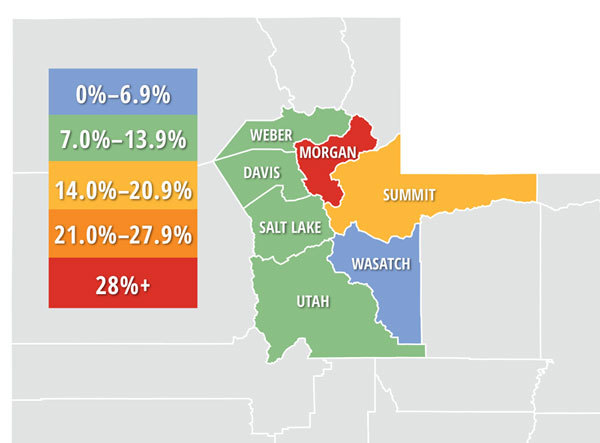
- Appreciation was strongest in Morgan County, where prices rose by 32%.
- There is clearly an ongoing imbalance between supply and demand, with home prices continuing to appreciate at above-average rates. This is likely to continue for the foreseeable future.
DAYS ON MARKET
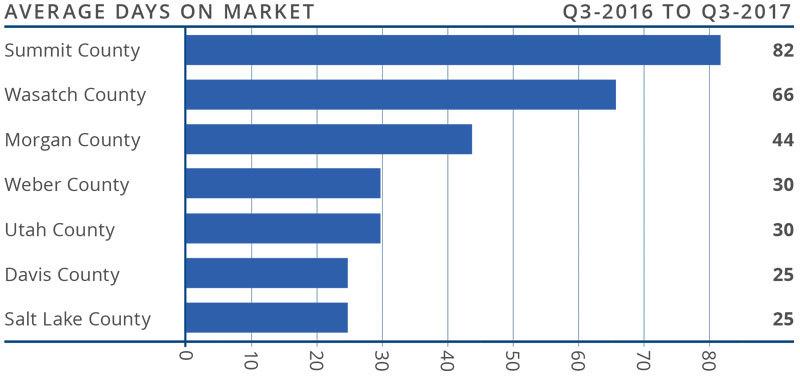
- The average number of days it took to sell a home rose by five days when compared to the third quarter of 2016.
- It took an average of less than a month to sell a home in Salt Lake, Davis, Utah, and Weber Counties.
- During the third quarter, it took an average of 43 days to sell a home in the region.
- Although demand remains robust, it appears as if buyers are being a little more “choosy,” which may be the reason why the time on market rose in four of the six counties in this report.
CONCLUSIONS
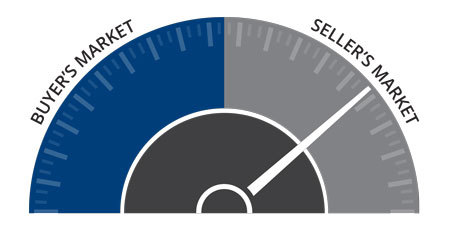 This speedometer reflects the state of the region’s housing market using housing inventory, price gains, home sales, interest rates, and larger economic factors.
In the third quarter of 2017, I have placed the needle well into seller territory. The supply of available homes remains at very low levels, which continues to create competition for well-priced and well-located homes. An increase in the time it takes to sell a home may suggest that the market is either getting weary of all the competition or that would-be buyers are possibly putting off buying until they see more choices in the number of homes for sale. All of that considered, it remains a seller’s market.

Matthew Gardner is the Chief Economist for Windermere Real Estate, specializing in residential market analysis, commercial/industrial market analysis, financial analysis, and land use and regional economics. He is the former Principal of Gardner Economics, and has more than 30 years of professional experience both in the U.S. and U.K.
")


