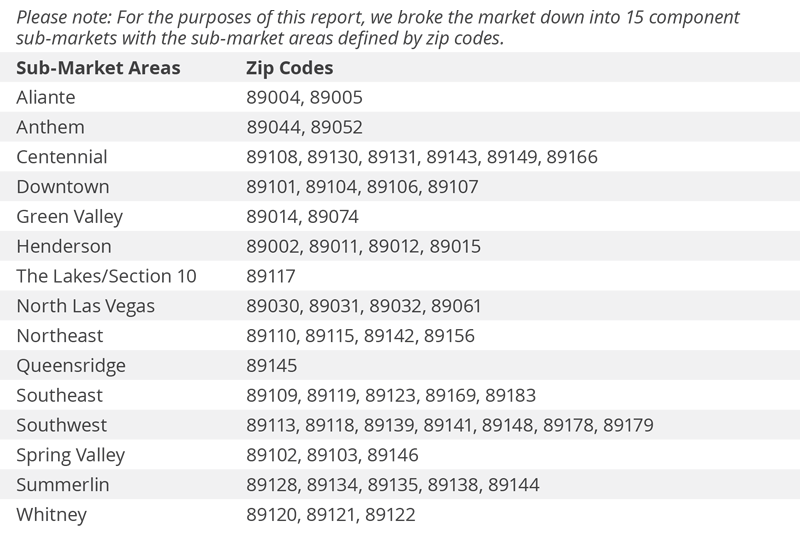
The following analysis of the greater Las Vegas real estate market is provided by Windermere Real Estate Chief Economist Matthew Gardner. We hope that this information may assist you with making better-informed real estate decisions. For further information about the housing market in your area, please don’t hesitate to contact your Windermere agent.
ECONOMIC OVERVIEW
COVID-19’s massive impact on jobs has started to taper, but the market is still a long way from a full recovery. Las Vegas shed almost 247,000 jobs in only two months, but more than 118,000 of them have returned. Naturally, the Leisure & Hospitality sector was significantly impacted, but I am pleased to report that well over half of those 136,000 lost jobs have now returned. With major declines in employment, it was not surprising to see the unemployment rate rise from 3.9% in February to 34% in April. Given the return of a significant number of jobs, the rate in September came down to 15.5%. The market still has a long way to go to get back to where it was pre-COVID, but the improvement is palpable. Although it is certainly too early to say we are out of the woods, the direction the economy is heading is positive. That said, COVID-19 infection rates in Nevada started increasing in June and that may slow the economic recovery if the direction is not reversed.
HOME SALES
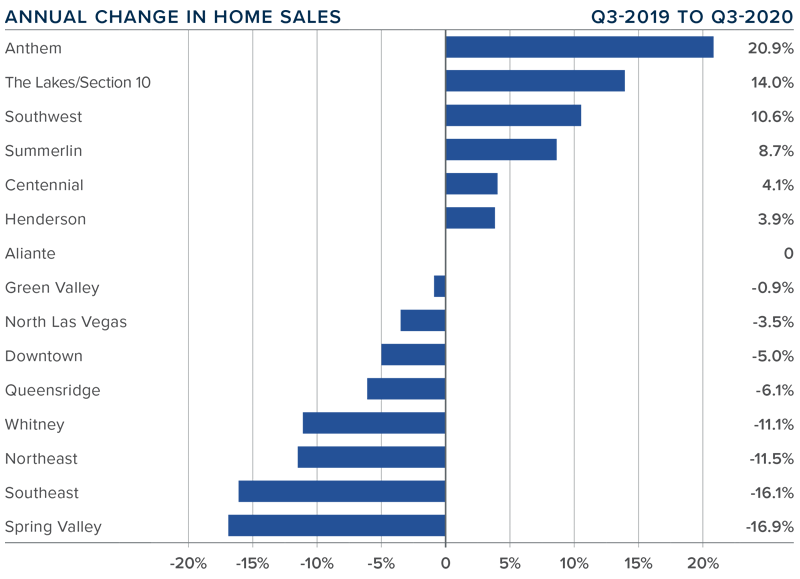
❱ A total of 9,515 homes sold in the third quarter of 2020. This was an increase of only 0.9% compared to the same period a year ago, but a significant 56% higher than in the second quarter of 2020.
❱ Pending sales jumped 33.6% over the second quarter, suggesting that faith in the market is returning, which bodes well for closings in the fourth quarter.
❱ Sales rose in six markets, were static in one, and dropped in eight. The Anthem area saw significant growth, but this increase was offset by lower sales activity in the Spring Valley and Southeast Las Vegas markets.
❱ Listing activity was down 11.9% from the second quarter of the year and down 31.9% compared to a year ago. This is not encouraging. Listings will likely remain relatively muted until a vaccine is available, and the Las Vegas economy gets back to as close to normal as is achievable.
HOME PRICES
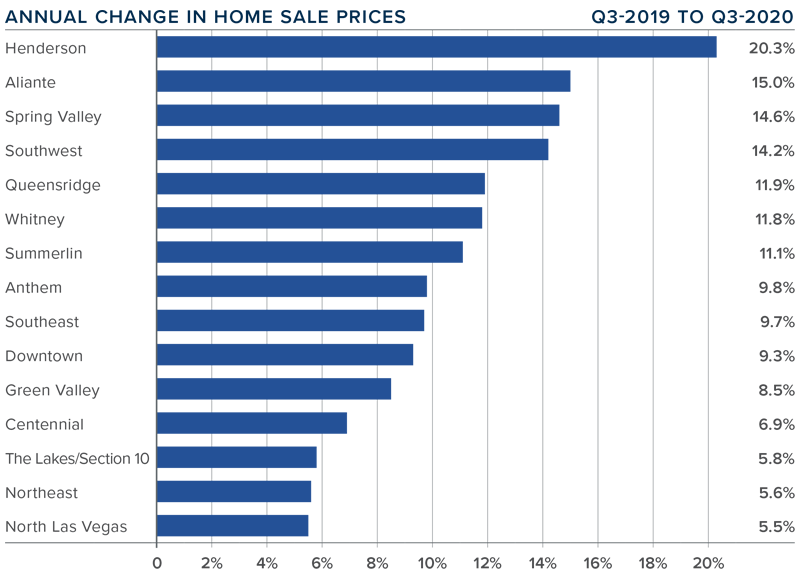
❱ As sales jumped and inventory remained tight, prices took off. The average sale price rose 13.1% year over year to $363,793. Prices were up 7.7% compared to the second quarter this year.
❱ Annual home price growth is still solid. It is clear that buyers are competing for homes, and favorable interest rates are allowing prices to rise at well-above-average rates.
❱ Prices rose in every sub-market compared to the same quarter last year, with significant gains in Henderson. Also of note is that prices rose by double-digits in seven areas.
❱ Buyers are out there, irrespective of an economy that is still on the mend. Belief in the benefits of homeownership is apparent, and this is certainly benefiting home sellers.
DAYS ON MARKET
❱ The average time it took to sell a home in the region dropped one day compared to the third quarter of 2019.
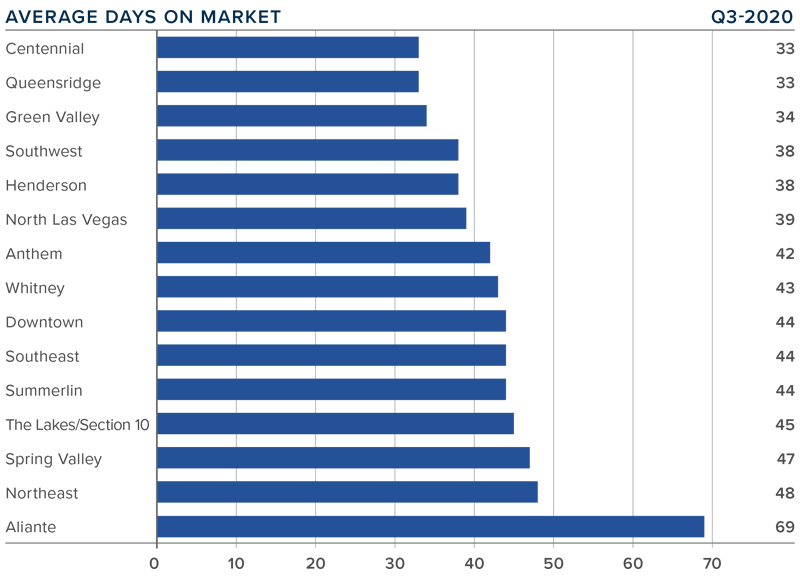
❱ Regionally, it took an average of 43 days to sell a home in the third quarter of 2020. It took 5 more days to sell a home than during the second quarter of this year.
❱ Days on market dropped in nine sub-markets, remained static in two, and rose in four compared to a year ago.
❱ The greatest decline in market time was in the Queens Ridge neighborhood. The greatest increase in market time was in Aliante, where homes took an average of 17 more days to sell than they did a year ago.
CONCLUSIONS
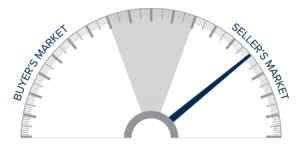 This speedometer reflects the state of the region’s real estate market using housing inventory, price gains, home sales, interest rates, and larger economic factors.
The market continues to recover from the impact of COVID-19. Demand has improved, as suggested by the number of pending sales in this quarter, and buyers have become more active. If new infection rates start dropping and the economy continues to improve, the market will recover. Buyers are out there, and supply remains tight. As such, I am moving the needle a little more in favor of home sellers.
ABOUT MATTHEW GARDNER
 As Chief Economist for Windermere Real Estate, Matthew Gardner is responsible for analyzing and interpreting economic data and its impact on the real estate market on both a local and national level. Matthew has over 30 years of professional experience both in the U.S. and U.K.
In addition to his day-to-day responsibilities, Matthew sits on the Washington State Governors Council of Economic Advisors; chairs the Board of Trustees at the Washington Center for Real Estate Research at the University of Washington; and is an Advisory Board Member at the Runstad Center for Real Estate Studies at the University of Washington where he also lectures in real estate economics.
 Facebook
 Twitter
 Pinterest
 Copy Link


