
 Facebook
 Twitter
 Pinterest
 Copy Link
U.S. Housing Market 2023: Updated Analysis

Windermere Chief Economist Matthew Gardner gives an updated analysis of the U.S. housing market in 2023, using data released by The National Association of REALTORS® on listing activity, home sales, price growth, and more.
This video is the latest in our Monday with Matthew series with Windermere Chief Economist Matthew Gardner. Each month, he analyzes the most up-to-date U.S. housing data to keep you well-informed about what’s going on in the real estate market.
U.S. Housing Market 2023
Hello there, I’m Windermere Real Estate’s Chief Economist Matthew Gardner and welcome to this month’s episode of Monday with Matthew. The National Association of REALTORS® released their data on the U.S. housing market in August, and it contained a few things which I found interesting and wanted to share with you.
Listing Activity
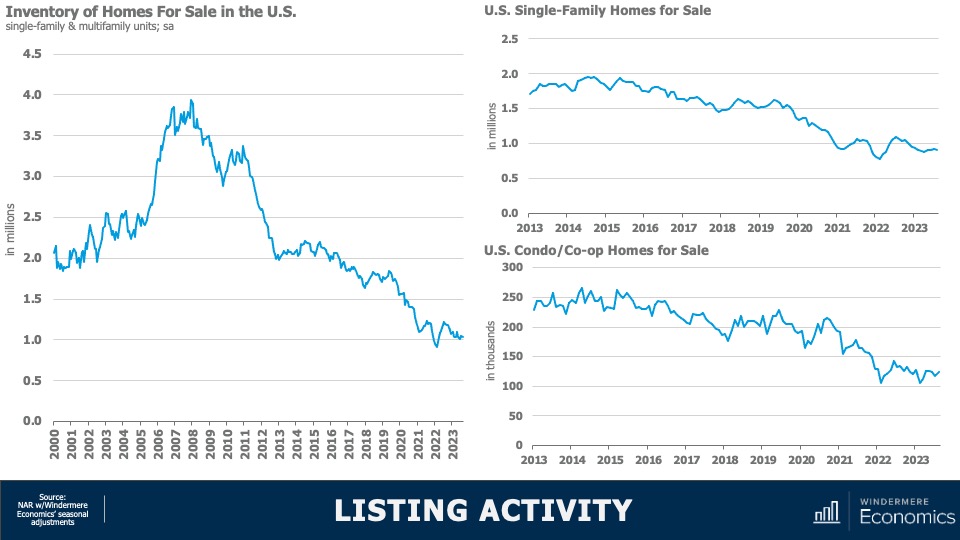
As you can clearly see here, the number of homes for sale remains at close to historic lows. When adjusted for seasonality, there were just 1.03 million single-family and condominium homes for sale in the month of August, and that’s down 8.3% from a year ago and the second lowest level in 2023. When adjusted for seasonal variations, there were just over 911,000 single-family homes for sale in the month, that’s 15% lower than a year ago and 36% below August of 2019. And the condominium market is not faring any better with just over 123,000 units available for purchase, listing activity was down year-over-year by just over 9%.
Homes for Sale August 2023
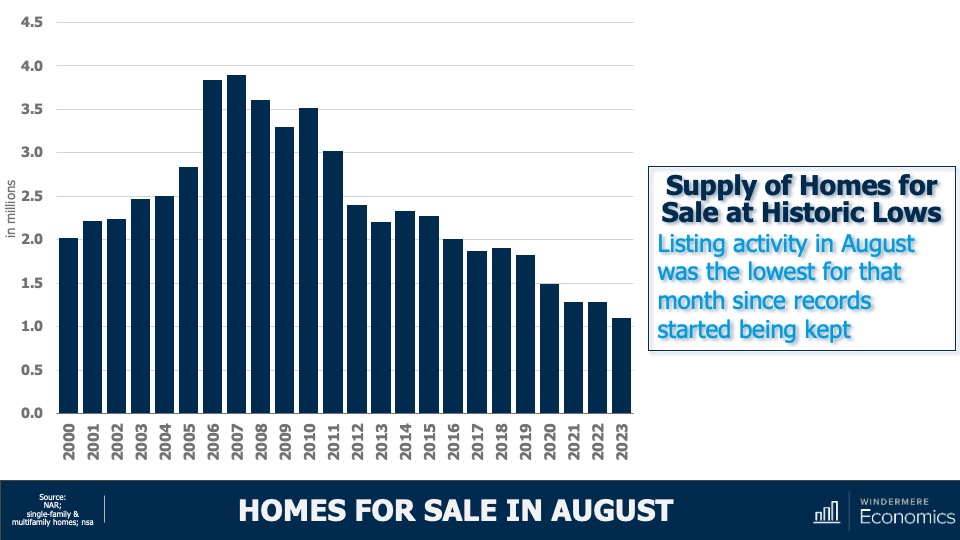
And to give you a little different perspective, this chart shows you the total number of units for sale in the month of August going back more than 20 years and I think it gives a pretty good indication as to how tight the U.S. housing market really is.
Now, we’ve talked before about the reasons why supply is so limited, and the blame is almost totally attributable to mortgage rates with sellers remarkably reluctant to move because that would mean losing the historically low mortgage rate that they currently benefit from. And as the old saying goes, “you can’t buy what’s not for sale,” and this is certainly true in the housing market today.
U.S. Housing Market 2023: Sales Activity
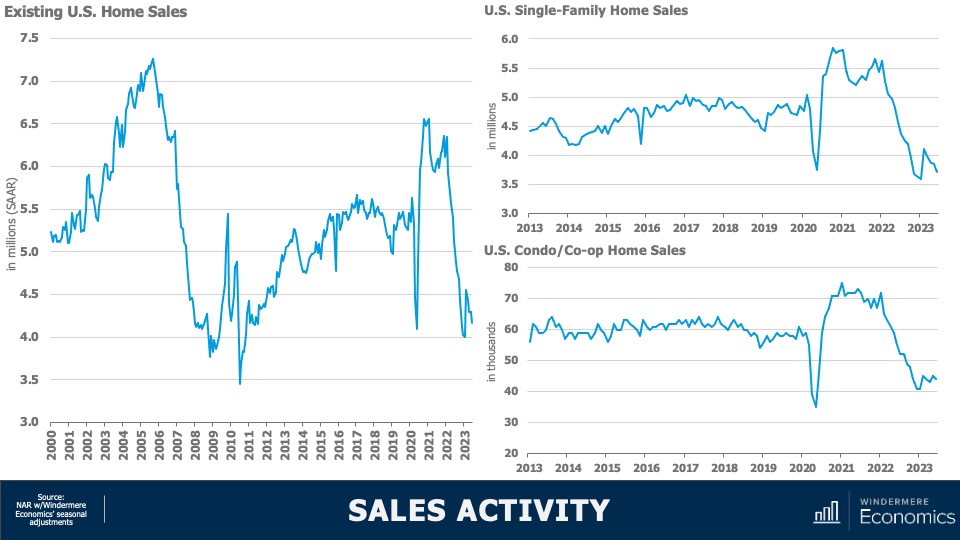
With such limited choice in the marketplace, it’s unsurprising to see home sales having plummeted following the pandemic induced surge we saw in 2021. At an annual sales rate of 4.04 million units, that is only 40,000 more than the low seen this January and we are now holding at levels we haven’t seen since 2010. Interestingly, single-family sales did see a little jump at the start of this year, but they have since pulled back—likely a function of rising financing costs, which were getting close to 7% in June.
But the condominium market, while certainly down significantly, appears to be somewhat more resilient. I find this interesting as we have not seen any palpable increase in listing activity for multifamily units.
Home Sale Prices Off All-Time High
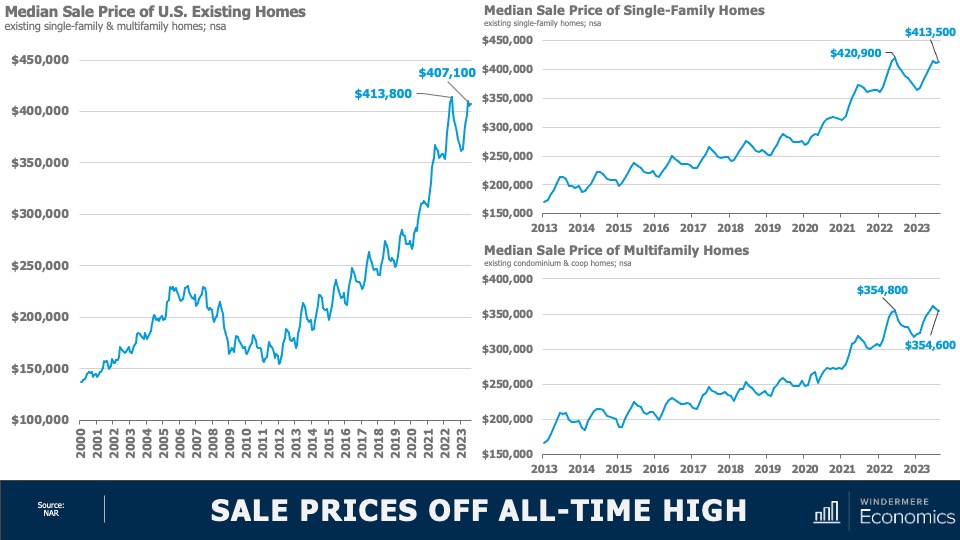
When prices started to fall in the summer of 2022, many expected to see them continue to plunge in a manner similar to that seen following 2007 collapse, but that has certainly not been the case. Sale prices have rebounded and remain remarkably resilient—especially given significantly higher financing costs.
- Although we did see a small drop in home prices between June and July of this year, U.S. home prices are only 1.6% below their 2022 peak; they’re up 3.9% year over year; and up by 11.1% from the start of 2023.
Single-family home prices paint a similar picture with prices down by 1.8% from peak; but up 3.7% year over year, and up 11.2% from the start of the year. Interestingly, sale prices in the Northeast were actually 3.5% higher in August than their 2022 peak. And condominium prices are just 0.1% below the high seen in June of last year. Prices are now up 6.2% year over year and are 11.6% higher than we saw at the end of 2022.
Now, of course the data shown here is unlikely to reflect the recent surge in mortgage rates so it will be interesting to see what impact that has not just on sales but sale prices when the September and October data is published.
My intuition suggests that—even with mortgage rates where they are today—as long as they don’t move significantly higher, prices at the national level are unlikely to collapse. But I do see sales volumes pulling back further as listing activity remains very constrained.
Price Growth vs Payment Growth
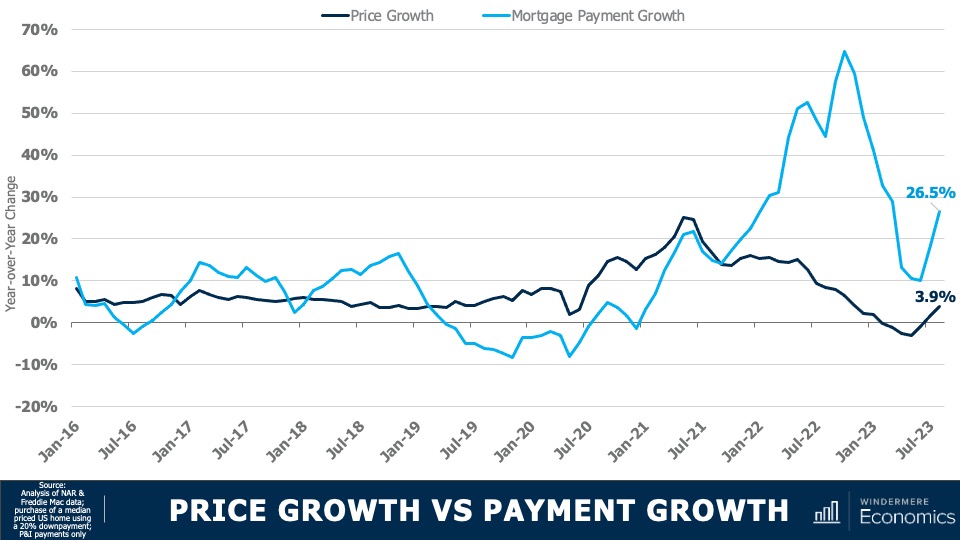
This chart shows a different way to look at the impact that mortgage rates are having on the market. The dark blue line shows year-over-year home price growth, and the light blue line shows the 12-month change in average mortgage payments.
Although we did see that annual growth in mortgage payments fall to just 10% in June of this year—the first time we have seen that since 2021—it has subsequently jumped back up. This means that a buyer of a median priced house in the U.S. is faced with payments that are 26 and a half percent higher than they were 12 months ago. At the same time, home price growth has stalled.
As I’ve mentioned in several past videos, I find it unlikely that inventory levels will increase significantly in 2023, and I also believe that supply will be constrained next year as well as rates remain at elevated levels.
As we know, it is this lack of inventory that has helped to support home prices; however, there is a breaking point. 10-year bond yields are holding at multi-year highs and do not appear to be thinking of pulling back at any time soon—especially given new bond issuances that the country is going bring to market in order to address our burgeoning debt levels.
And it’s because of this that I now expect to see rates remaining higher for longer, and the question then becomes how much tolerance will buyers have if mortgage rates hold where they are today or if they head closer to 8%.
Although I am not expecting this to happen, it is possible. And if it does, then sales will fall further and the underpinning of price stability will certainly be eroded. And there you have it. As always, I’d love to hear your thoughts on this subject so feel free to leave your comments below. Until next month, stay safe out there and I’ll see you soon. Bye now.
To see the latest housing data for your area, visit our quarterly Market Updates page.
About Matthew Gardner
As Chief Economist for Windermere Real Estate, Matthew Gardner is responsible for analyzing and interpreting economic data and its impact on the real estate market on both a local and national level. Matthew has over 30 years of professional experience both in the U.S. and U.K.
In addition to his day-to-day responsibilities, Matthew sits on the Washington State Governors Council of Economic Advisors; chairs the Board of Trustees at the Washington Center for Real Estate Research at the University of Washington; and is an Advisory Board Member at the Runstad Center for Real Estate Studies at the University of Washington where he also lectures in real estate economics.
How Low Inventory Is Affecting the Housing Market
Windermere Chief Economist Matthew Gardner demonstrates how the U.S. housing market is adapting to low inventory levels. He touches on the new construction industry, supply changes in large metro areas, median home sale prices, and more.
This video is the latest in our Monday with Matthew series with Windermere Chief Economist Matthew Gardner. Each month, he analyzes the most up-to-date U.S. housing data to keep you well-informed about what’s going on in the real estate market.
Low Inventory Housing Market
Hello there, I’m Windermere Real Estate’s Chief Economist Matthew Gardner and welcome to this month’s episode of Monday with Matthew. As we are all aware, the housing market has softened considerably with the number of existing homes available to buy close to record lows. Today we are going to talk about supply, and how the market is starting to adapt to low inventory levels.
Housing Market Inventory
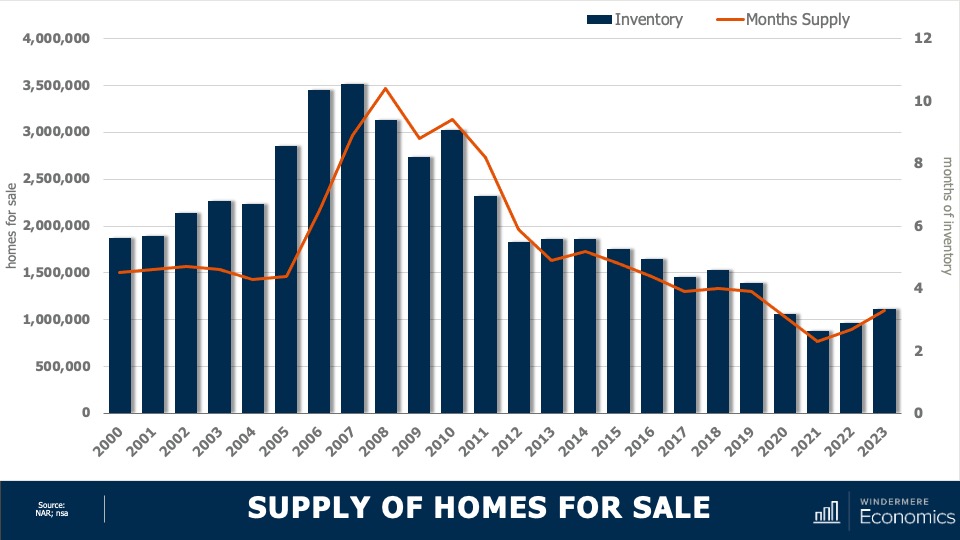
This chart shows the average number of homes on the market by year. Although year to date we have seen a little bit of an uptick, it’s clear the country remains supply-starved. And with just over three months of inventory—as opposed to the normal four to six—the market is clearly out of balance. But even though inventory levels have risen nationally, as I’ve said many times before, not all markets are equal.
Housing Inventory Changes in Metro Areas
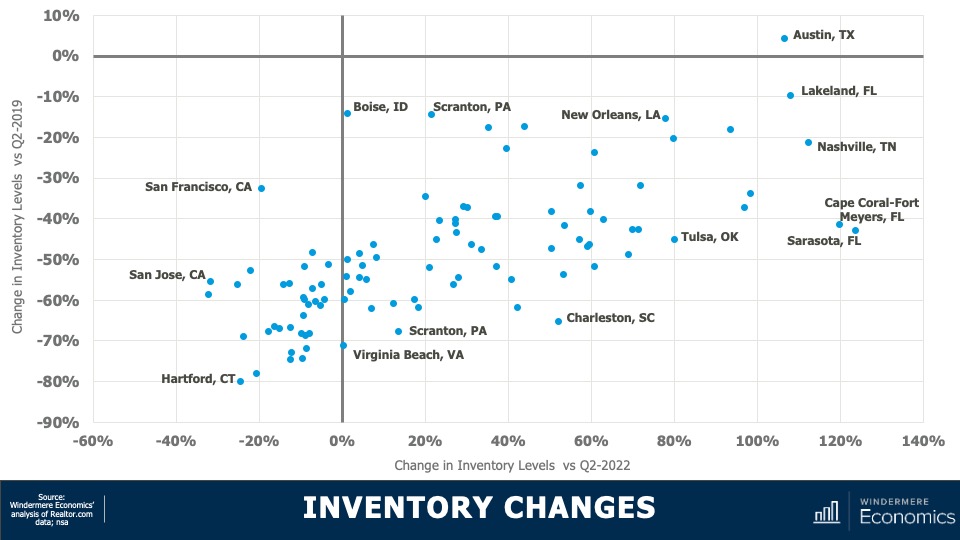
This chart shows how supply levels have changed. The data here is representative of the 100 largest metropolitan areas in the country. The horizontal axis shows the change in inventory versus the second quarter of 2022, while the vertical axis shows the difference and the number of homes for sale versus the second quarter of 2019. I think you’ll agree that the difference is stark. Although two-thirds of the metropolitan areas have seen the number of homes for sale improved versus the same period a year ago, just one (Austin, TX) had more homes for sale higher in the second quarter of this year than it had in the second quarter of 2019.
- And even more stark was the fact that inventory levels in 53 of the 100 largest metropolitan areas were down by more than 50% compared to the same period three years ago.
Interestingly, on a percentage basis, smaller metro areas saw the greatest decline compared to three years ago. For example, in Hartford, CT, the average number of homes on the market in the second quarter was just over 900, down by 80% from the second quarter of 2019 where there was an average of over 4,400 units for sale. Supply levels were down by 78% in Stamford, CT; 75% in New Haven, CT; and 74% in Allentown, PA.
It is true that supply levels are generally higher when compared to a year ago, with the greatest increase being seen in select markets in Florida, Tennessee, Texas, and Oklahoma; however, other than in Austin, supply levels remain well below their long-term averages. So, how is the market adapting? The answer is rather interesting. Even with all the talk of escalating material, land, and labor costs, it’s the new home industry that has been taking advantage of the lack of housing supply.
New Construction Market Trends
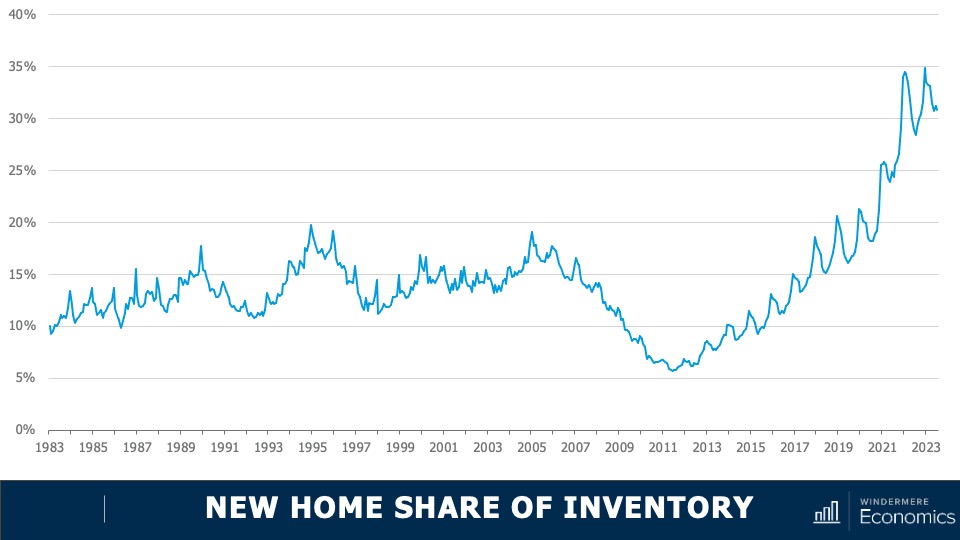
This chart shows the share of new homes on the market compared to their resale counterparts—here we are just looking at single-family homes. Historically, new construction makes up roughly 10% of active listings at any one time, but as you can see here, that share has been rising not just since the end of the pandemic but for the past several years. Although off the high seen a few months ago, 30% of the single-family homes for sale this July were brand new. I find this particularly interesting because, historically speaking, a premium was paid in order to buy a new home rather than an existing one.
Median Sale Prices: New and Existing Homes
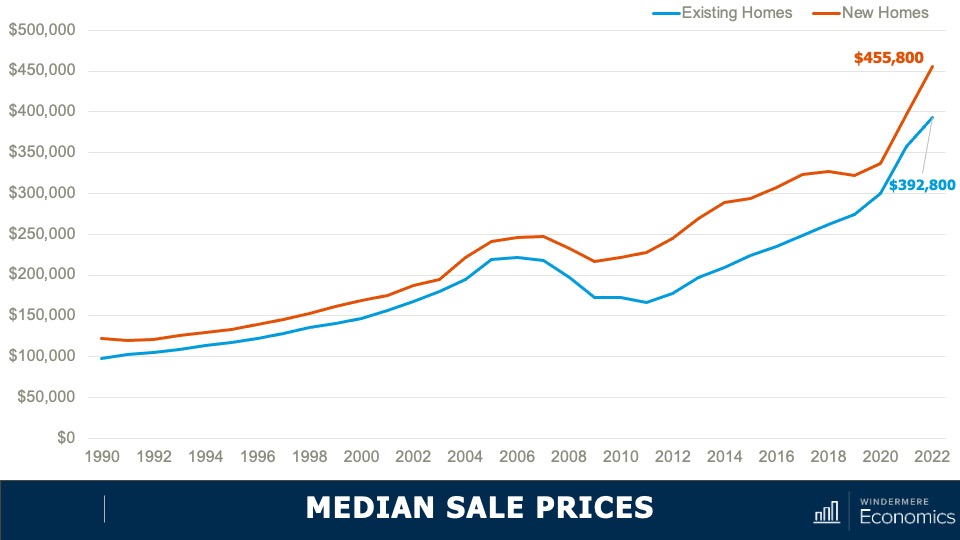
- As you can see here, the spread in median sale prices, which was pretty stable from 1990 until the bursting of the housing bubble, grew significantly starting in 2011 and in 2022. The premium averaged 16%. But when we look a bit closer at the numbers, they gives us a somewhat different picture.
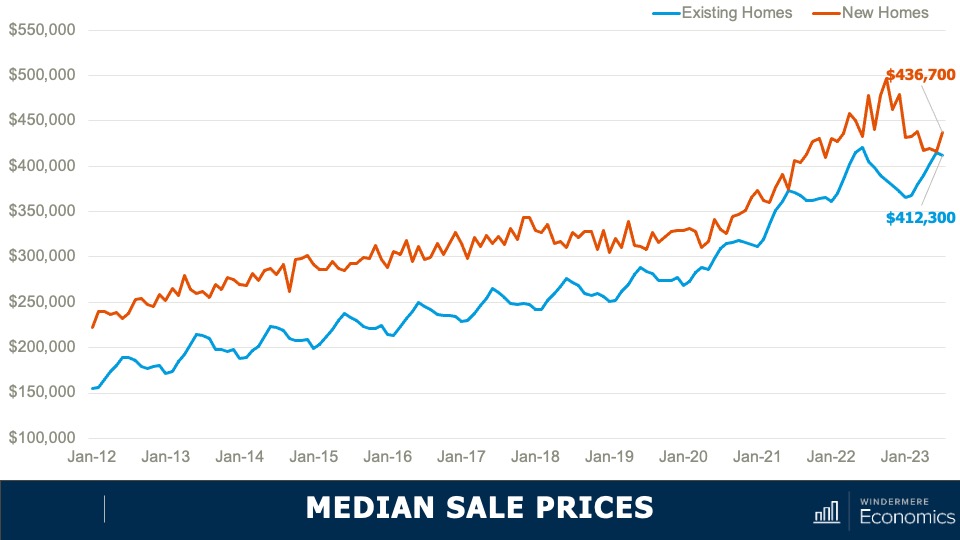
- You can see here the spread has dropped to just 6%. And in June of this year, the difference was a mere $1,000.
With the share of new homes for sale holding at a four-decade high, the share of sales themselves is at a level we haven’t seen since 2005. But even though we know that there is demand for housing, shouldn’t sales be constrained by mortgage rates? Well, what is happening is that builders are attracting buyers through incentives, and here we’re talking about mortgage rate buydowns which are becoming increasingly prevalent across the country.
In fact, a recent survey from John Burns Consulting suggested that 30% of home builders reported using interest buydowns more in the second quarter of this year than they had previously. And this is attracting buyers to visit new development communities.
An example of these buydowns is the 2/1 program that DR Horton—the largest home builder in the country—is offering at some communities. This program gives buyers a mortgage rate that starts at 3% for the first year, rises to 4% in year two, and then goes to 5% for the balance of the 30-year term. That’s pretty compelling, given where mortgage rates are today.
The bottom line is that as far as I can see, the new home industry will continue to take an outsized share of the market for the balance of 2023 and likely through most of 2024. That said, once the market starts to normalize, I expect them to pull back from these incentive programs, making them more likely to start raising asking prices, and we will return to the traditional spread between the prices of new and resale homes.
Although it’s pleasing to see more homes being built, I still believe that the country will still be running a housing deficit when it comes to meeting demographic demand and this will continue to hurt first-time buyers who continue to be priced out of the market.
As always, I’d love to hear your thoughts on this subject so feel free to leave your comments below. Until next month, stay safe out there and I’ll see you soon. Bye now.
To see the latest real estate market data for your area, visit our Market Update page.
About Matthew Gardner
As Chief Economist for Windermere Real Estate, Matthew Gardner is responsible for analyzing and interpreting economic data and its impact on the real estate market on both a local and national level. Matthew has over 30 years of professional experience both in the U.S. and U.K.
In addition to his day-to-day responsibilities, Matthew sits on the Washington State Governors Council of Economic Advisors; chairs the Board of Trustees at the Washington Center for Real Estate Research at the University of Washington; and is an Advisory Board Member at the Runstad Center for Real Estate Studies at the University of Washington where he also lectures in real estate economics.
U.S. Home Prices and Housing Affordability in 2023
Windermere Chief Economist Matthew Gardner gives an updated look at U.S. home prices and housing affordability in 2023 by examining two key second-quarter reports from ATTOM Data Solutions and the National Association of Home Builders (NAHB).
This video is the latest in our Monday with Matthew series with Windermere Chief Economist Matthew Gardner. Each month, he analyzes the most up-to-date U.S. housing data to keep you well-informed about what’s going on in the real estate market.
U.S. Home Prices 2023
Hello there, I’m Windermere Real Estate’s Chief Economist Matthew Gardner and welcome to this month’s episode of Monday with Matthew. Today we are going to look at home prices and housing affordability. To do this I will be looking at the second quarter sales price data from ATTOM Data Solutions and we will also look at the just released National Association of Home Builders Housing Opportunity Index for the second quarter.
Are home prices dropping?
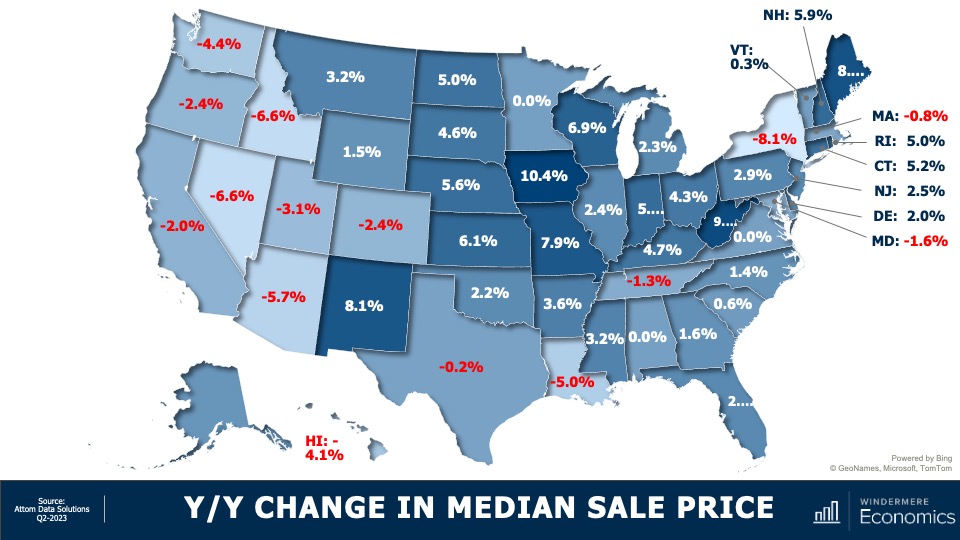
Starting with the year-over-year change in sale prices at the state level, there aren’t any great surprises. For the past several months I’ve been saying that as the Western U.S. saw the greatest price growth during the pandemic, so it’s not surprising to see most states sale prices in the quarter below the level seen a year ago. But it was pleasing to see that sale prices in 36 states either matched the level seen a year ago or were higher, and in some instances quite significantly so.
U.S. Home Sale Prices 2023 By State
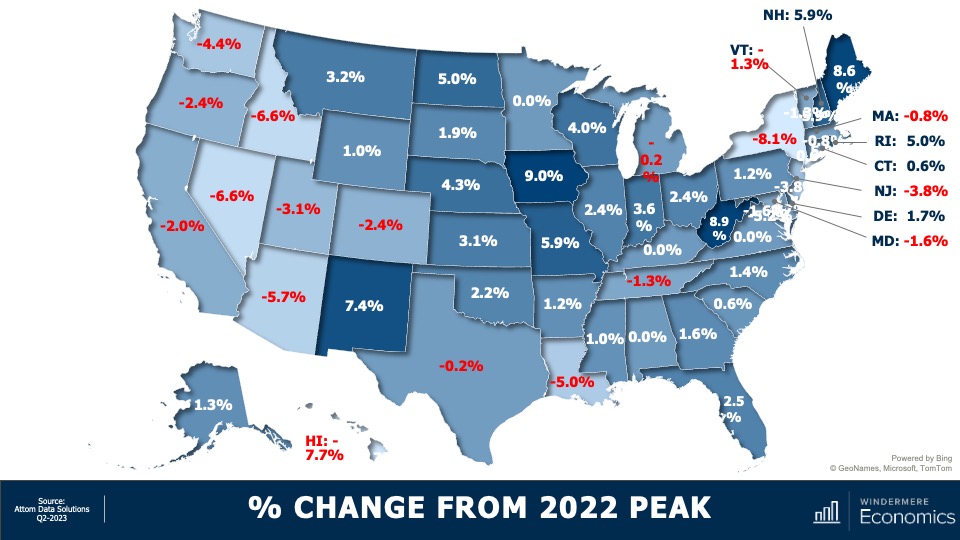
And when we compare second quarter sale prices to their 2022 peaks, 33 states are at or above the highs seen last year, but most of the Western States have yet to fully recover. In the South, Louisiana is still lagging by a good amount, as is New York State on the East Coast.
But as you are all very aware, all markets are different. I thought it would be interesting to dig a little deeper into the data to see which metro markets have seen significant gains over the past 12 months. It’s going to be interesting specifically because of the fact that mortgage rates have risen so much.
Metro Areas: Home Sale Prices 2023
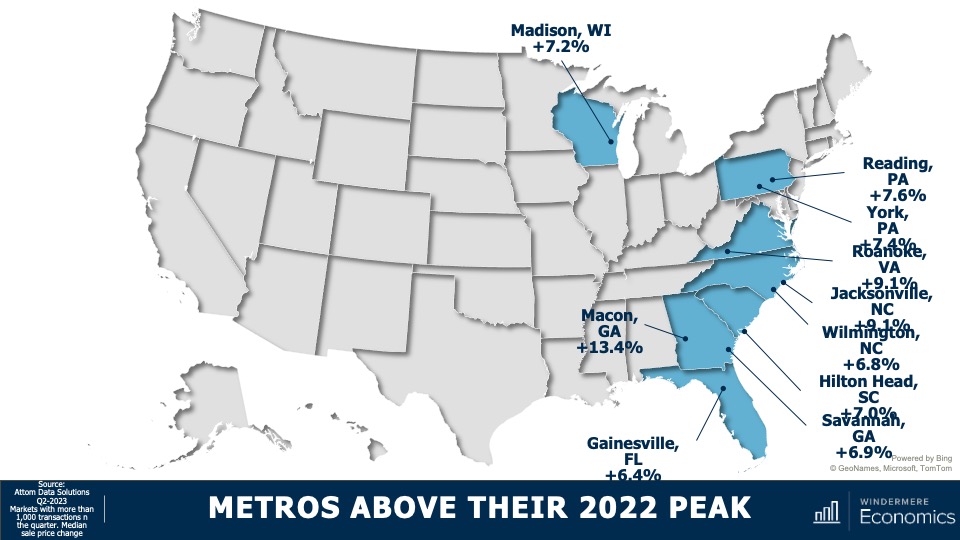
These are markets where sale prices are far above their 2022 peak sale prices. Now I must add that I only looked at markets where more than 1,000 transactions occurred in the last quarter, which takes out some of the volatility. Notably, even though the state of Virginia’s home prices in the quarter were flat when compared to their 2022 peak, the Roanoke market was up by over 9%. And in Pennsylvania, where state prices were only 1.2% above their 2022 peak, Reading is up by 7.6% and York by 7.4%. And in Georgia, where state sale prices were up a modest 1.6%, homes in Macon have leapt by over 13% and prices are up by 6.9% in Savannah.
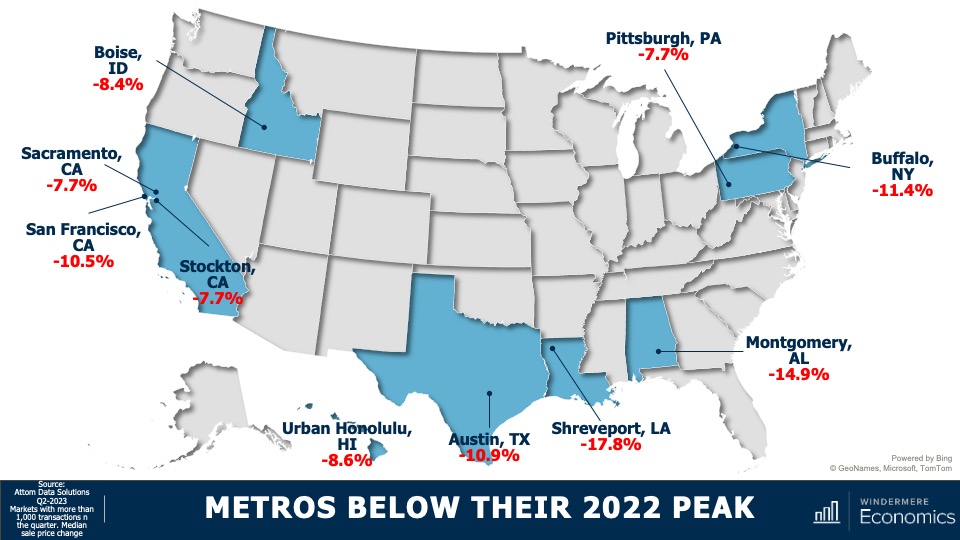
But, on the other end of the spectrum, there are markets which are underperforming their respective states and, unsurprisingly, California tops the list with three of their metros seeing prices significantly below that of the state as a whole. In other parts of the country, several metro areas which were relatively affordable before the pandemic saw an influx of remote workers and this led prices to skyrocket, and these will take some time to recover. This is particularly true in the Austin and Boise market areas.
I would add that, of the counties across the country where there were more than 1,000 transactions in the second quarter, half have met or exceeded their prior peak and—of the half where sale prices were still lower—the average shortfall is only around 4% and there are just seven counties in the country where sale prices are down by more than 10% from their 2022 peaks.
Now, what I see in the data is that the U.S. housing market, although certainly not fully healed, is headed in the right direction even when faced with mortgage rates that remain remarkably high. So, with sale prices recovering and still faced with stubbornly high financing costs, what does affordability look like?
U.S. Housing Affordability 2023
Well, according to the National Association of Homebuilders (NAHB), of the 241 metros that they track, just 40.5% of sales in the second quarter were affordable to households making the area’s median income—that’s the second lowest share of sales seen since they started generating this dataset a decade ago. Now, their data does go back to 2004, but the interest rate series that they used to use was discontinued, so it’s not accurate to compare their data today with anything before 2012.
Most Affordable U.S. Housing Markets
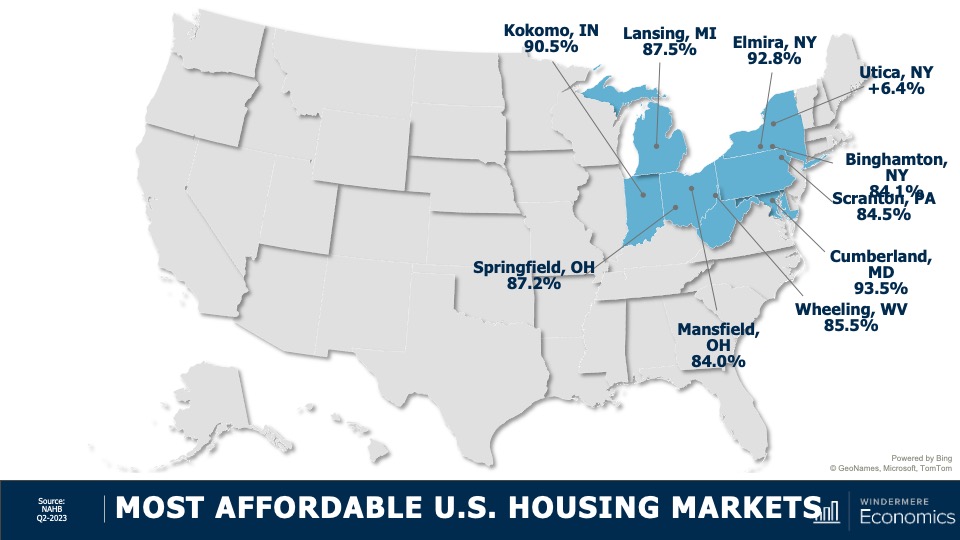
These were the most affordable markets in the second quarter and their locations should not be of any great surprise. Average sale prices in these markets were measured around $203,000—that’s just marginally above 50% of the national sale price in the quarter, which was $402,600.
Least Affordable U.S. Housing Markets
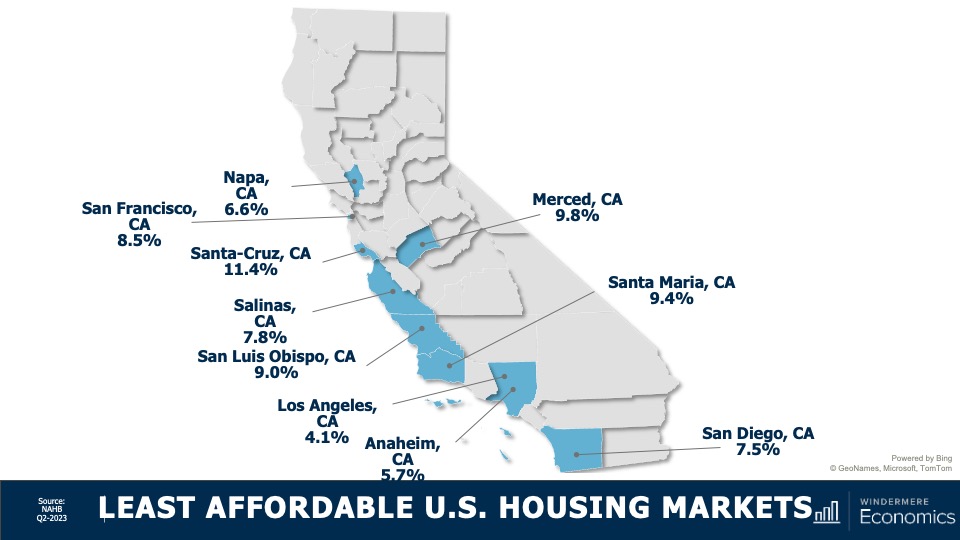
And unfortunately this should not surprise you either. On the other end of the spectrum, the top-10 least affordable housing markets were all in California, but it gets worse than that. The top 15 least affordable markets again, all in California, and 19 out of the top 25 were in the Golden State!
As far as I can see, the ownership housing market is still showing remarkable resiliency, especially given that mortgage rates have more than doubled from their lows and they’ve risen from 4.8% at the start of the second quarter of last year to 7% at the end of the second quarter of 2023.
Now, I still expect to see rates starting to slowly move lower as we go through the second half of the year. This will help with prices and, to a degree, affordability, but until we see a significant increase in the number of homes listed for sale, the market is going to remain unbalanced.
As always, I’d love to hear your thoughts on this subject so feel free to leave your comments below. Until next month, stay safe out there and I’ll see you soon. Bye now.
To see the latest real estate market data for your area, visit our quarterly Market Updates page.
About Matthew Gardner
As Chief Economist for Windermere Real Estate, Matthew Gardner is responsible for analyzing and interpreting economic data and its impact on the real estate market on both a local and national level. Matthew has over 30 years of professional experience both in the U.S. and U.K.
In addition to his day-to-day responsibilities, Matthew sits on the Washington State Governors Council of Economic Advisors; chairs the Board of Trustees at the Washington Center for Real Estate Research at the University of Washington; and is an Advisory Board Member at the Runstad Center for Real Estate Studies at the University of Washington where he also lectures in real estate economics.
Q2 2023 Arizona Real Estate Market Update

The following analysis of select counties of the Arizona real estate market is provided by Windermere Real Estate Chief Economist Matthew Gardner. We hope that this information may assist you with making better-informed real estate decisions. For further information about the housing market in your area, please don’t hesitate to contact your Windermere Real Estate agent.
Regional Economic Overview
Job growth in Arizona continues to slow. Though the state added 56,800 new jobs over the past 12 months, the annual growth rate of 1.8% is the lowest pace of growth since the pandemic ended. That said, the state’s unemployment rate in May was 3.4%, which was lower than the 3.7% rate we saw at the same time in 2022. Comparing the markets contained in this report to the second quarter of 2022, the Phoenix metro area saw its job base rise 1.9%, or 43,800 positions. The Prescott metro area saw employment rise 1.5%, with the addition of 1,000 new jobs. Unemployment rates suggested that both markets were at full employment. The jobless rate was 3.1% in the Phoenix area and 3.3% in the Prescott area. Both markets saw unemployment fall relative to the same period in 2022.
Arizona Home Sales
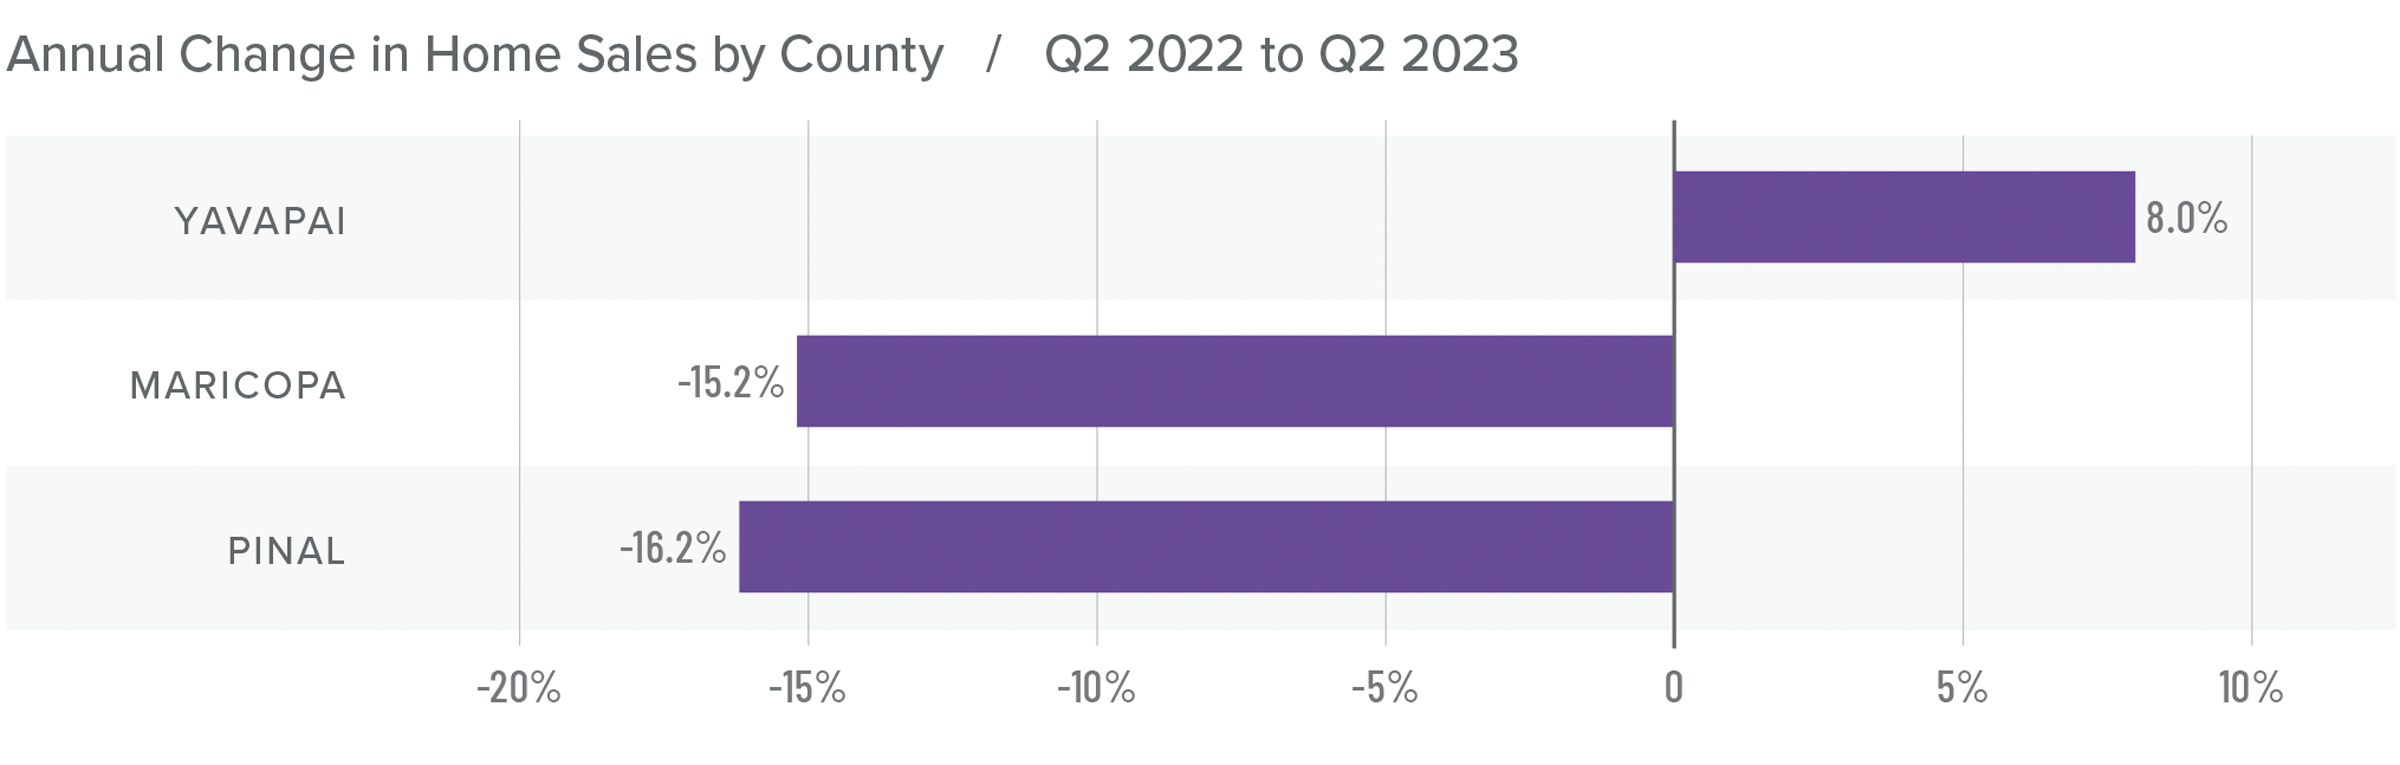
❱ In the second quarter of 2023, 18,658 homes sold. This was down 15.1% from the second quarter of 2022, but up a very impressive 24.6% compared to the first quarter of this year.
❱ The growth in quarter-over-quarter sales was more impressive given that average inventory levels in the quarter fell 23.4%.
❱ Sales fell in Maricopa and Pinal counties year over year. However, sales managed to rise 8% in the Prescott market. Compared to the first quarter of this year, sales rose substantially in all three counties. Pinal County led the charge as sales rose 37.1%.
❱ Pending sales rose in Pinal and Yavapai counties but fell in the larger Maricopa County market. This suggests that it might be a challenge to maintain this level of growth into the third quarter of the year.
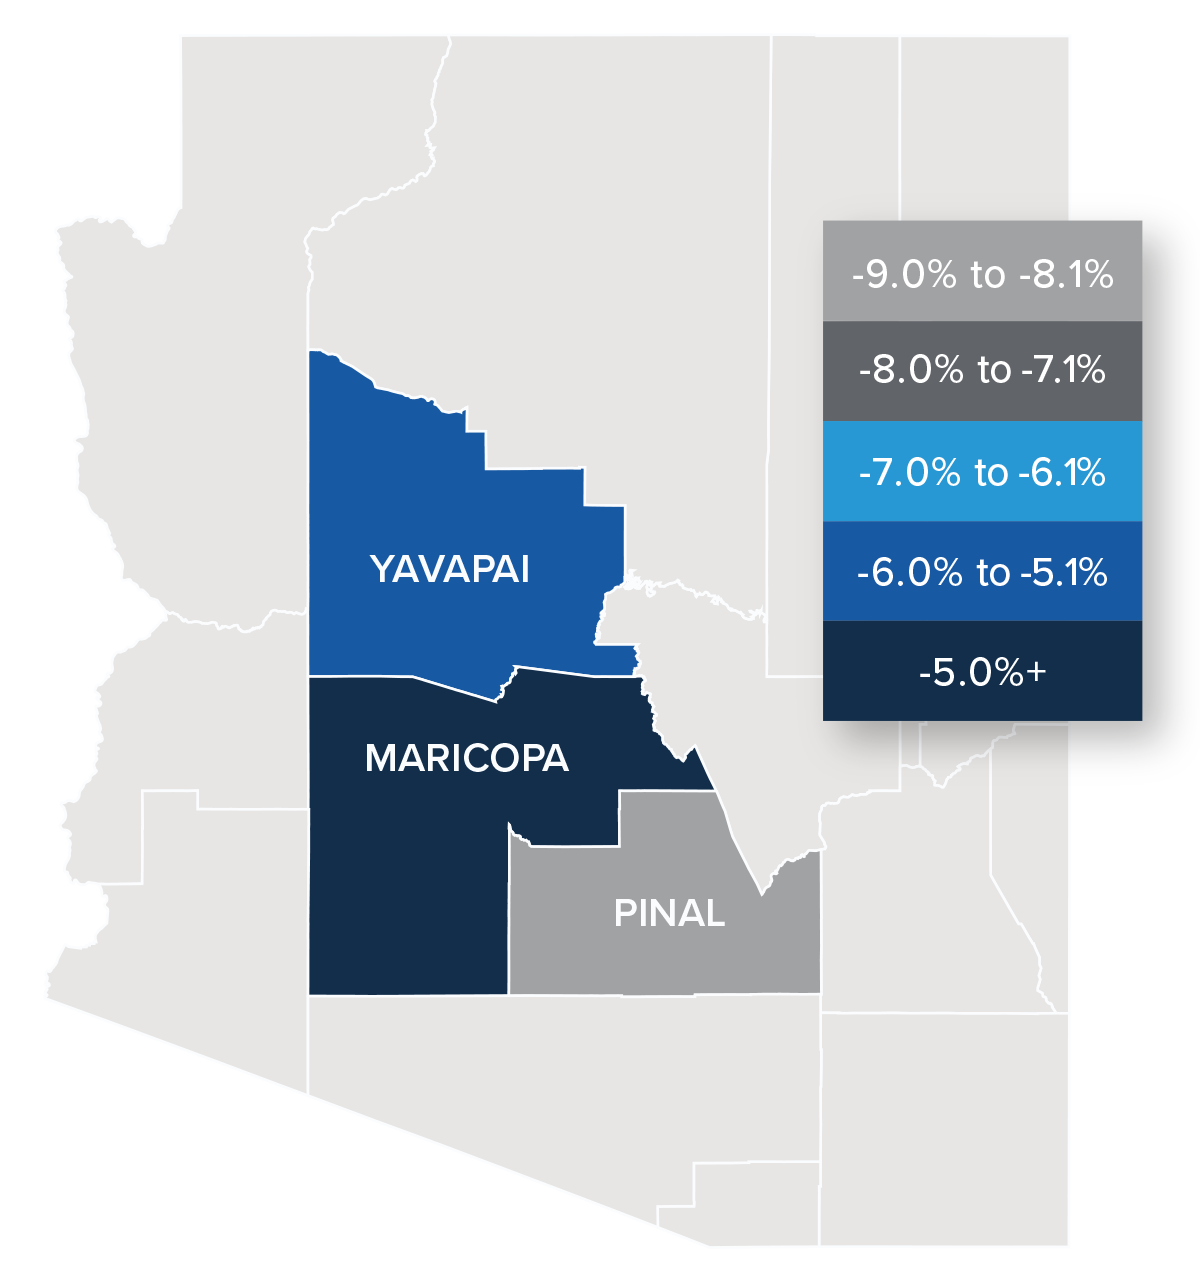
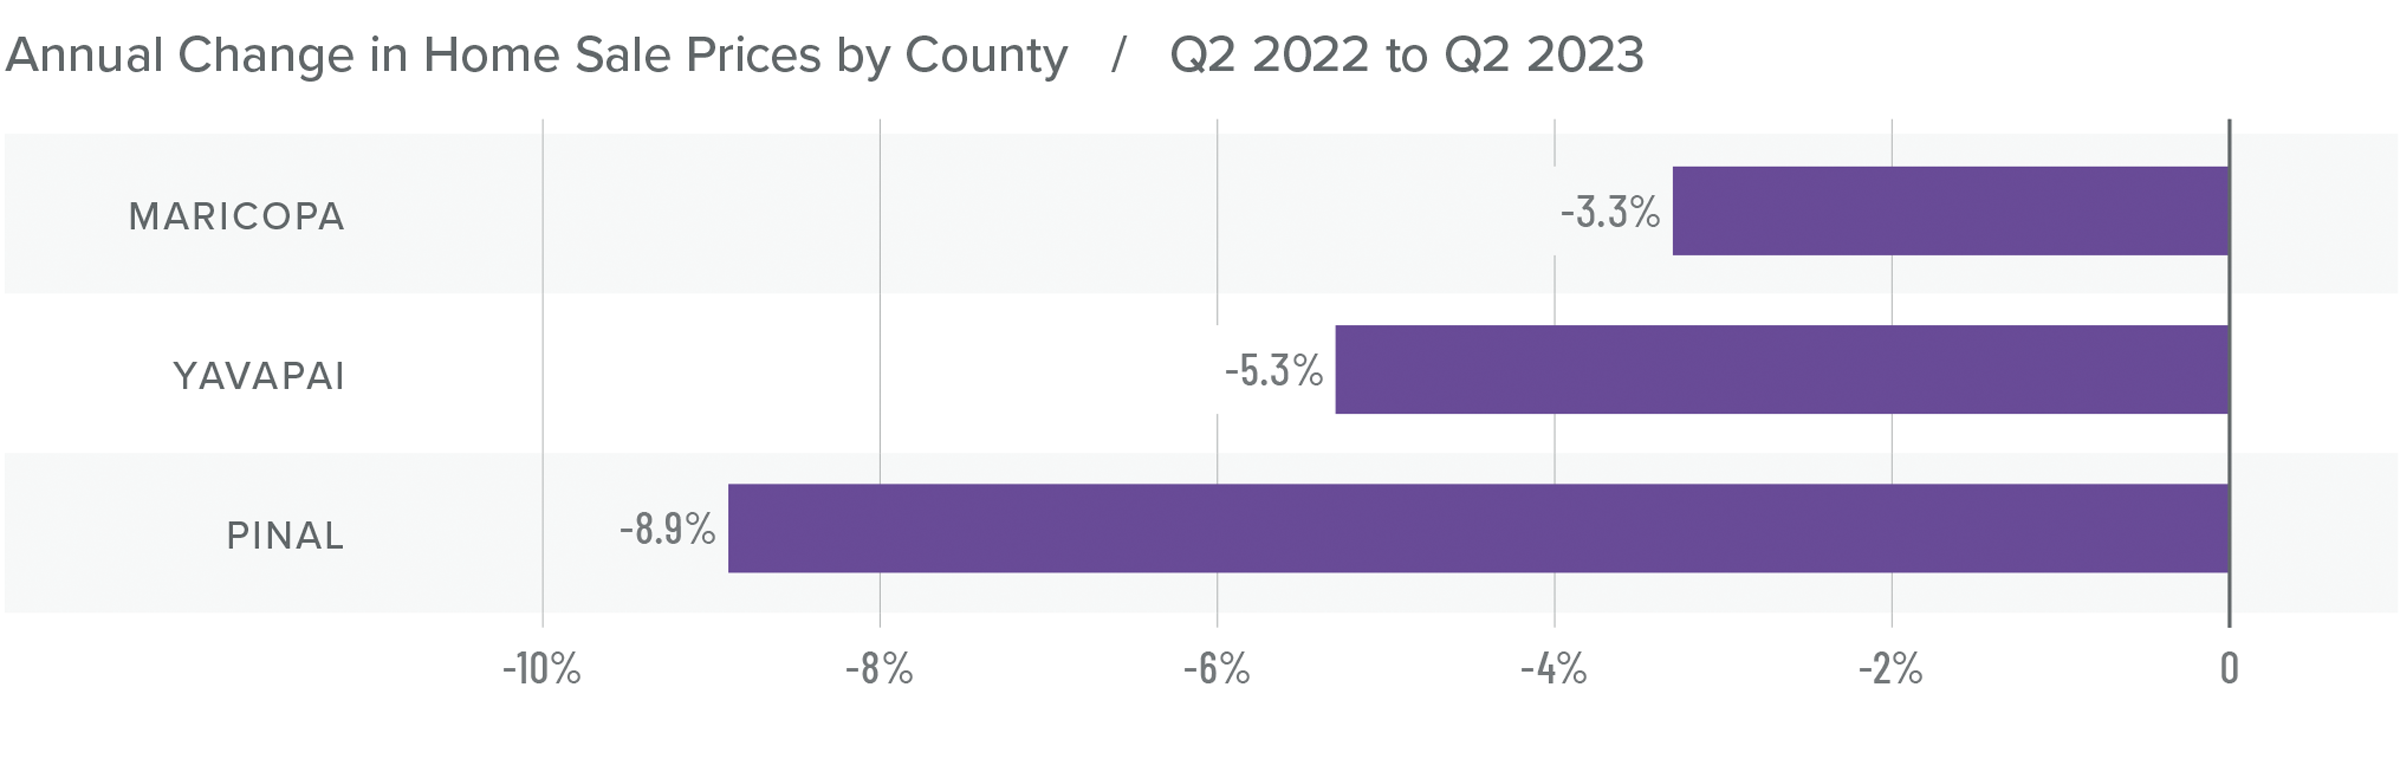
Arizona Home Prices
❱ Sale prices fell an average of 3.8% compared to the second quarter of 2022 but were 7.8% higher than in the first quarter of 2023. The average home sale price was $609,602.
❱ Compared to the first quarter of this year, prices were higher in all counties. Maricopa County saw particularly strong gains, with prices rising an average of 8.6%.
❱ The year-over-year drop in prices was not surprising given that the market was peaking in the second quarter of 2022 due to rapidly rising mortgage rates.
❱ It was interesting to see list prices rise in all markets compared to the first quarter of the year. Tight inventory levels have sellers feeling confident even in the face of significantly higher mortgage rates.
Mortgage Rates
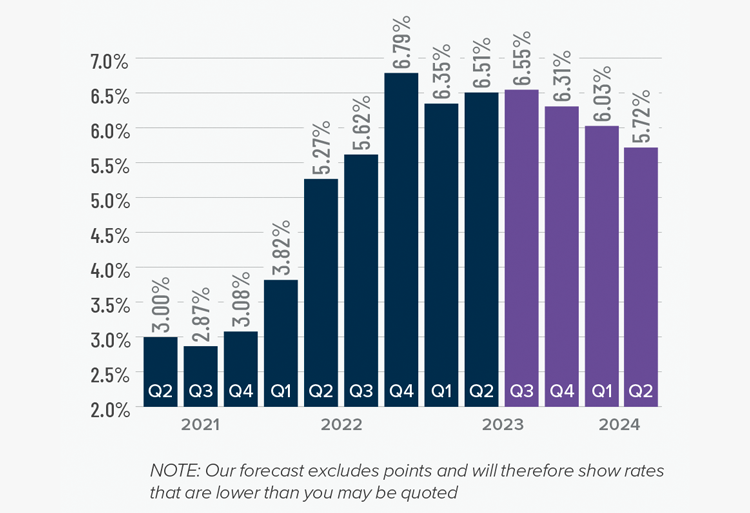
Although they were less erratic than the first quarter, mortgage rates unfortunately trended higher and ended the quarter above 7%. This was due to the short debt ceiling impasse, as well as several economic datasets that suggested the U.S. economy was not slowing at the speed required by the Federal Reserve.
While the June employment report showed fewer jobs created than earlier in the year, as well as downward revisions to prior gains, inflation has not sufficiently slowed. Until it does, rates cannot start to trend consistently lower. With the economy not slowing as fast as expected, I have adjusted my forecast: Rates will hold at current levels in third quarter and then start to trend lower through the fall. Although there are sure to be occasional spikes, my model now shows the 30-year fixed rate breaking below 6% next spring.
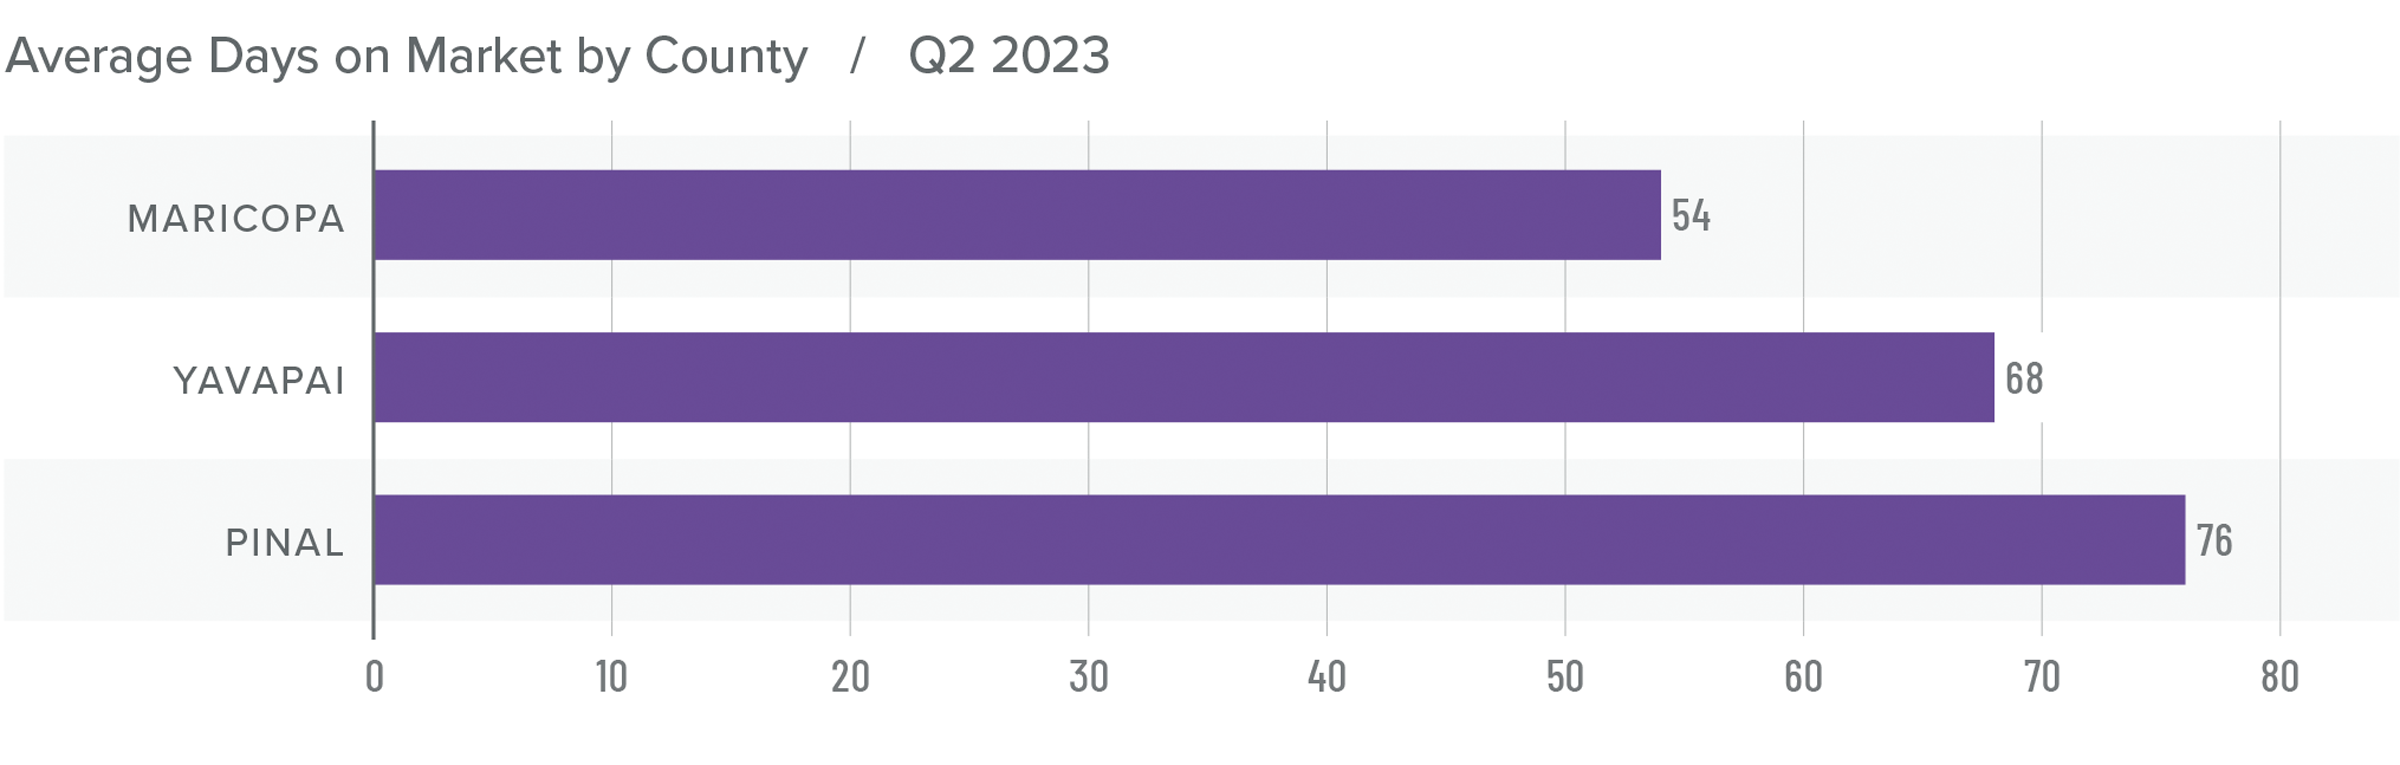
Arizona Days on Market
❱ It took an average of 66 days for a home to sell in the second quarter. This was 40 more days than in the same quarter of 2022, but 5 fewer days than in the first quarter of this year.
❱ Maricopa County was the tightest market in the region, with homes taking an average of 54 days to sell. Homes in Pinal County took the longest time to sell, at 76 days.
❱ All counties contained in this report saw average days on market rise from the same period in 2022. Compared to the first quarter of 2023, market time fell in Maricopa and Pinal counties and rose by two days in Yavapai County.
❱ The greatest fall in market time compared to the first quarter was in Maricopa County, where days on market fell 13 days.
Conclusions
This speedometer reflects the state of the region’s real estate market using housing inventory, price gains, home sales, interest rates, and larger economic factors.
Even with mortgage rates well above levels we’ve seen over the past few years, demand for homes still exceeds supply. Given that almost 84% of homeowners with mortgages have an interest rate below 5% and almost a quarter have rates at or below 3%, there is little incentive for them to sell if they don’t have to. This suggests that supply levels are unlikely to improve to a level that meets demand until rates drop significantly. With this supply-demand imbalance, it’s not surprising that home prices are rising again following the decline in the second half of 2022. I expect this trend to continue through the second half of the year.
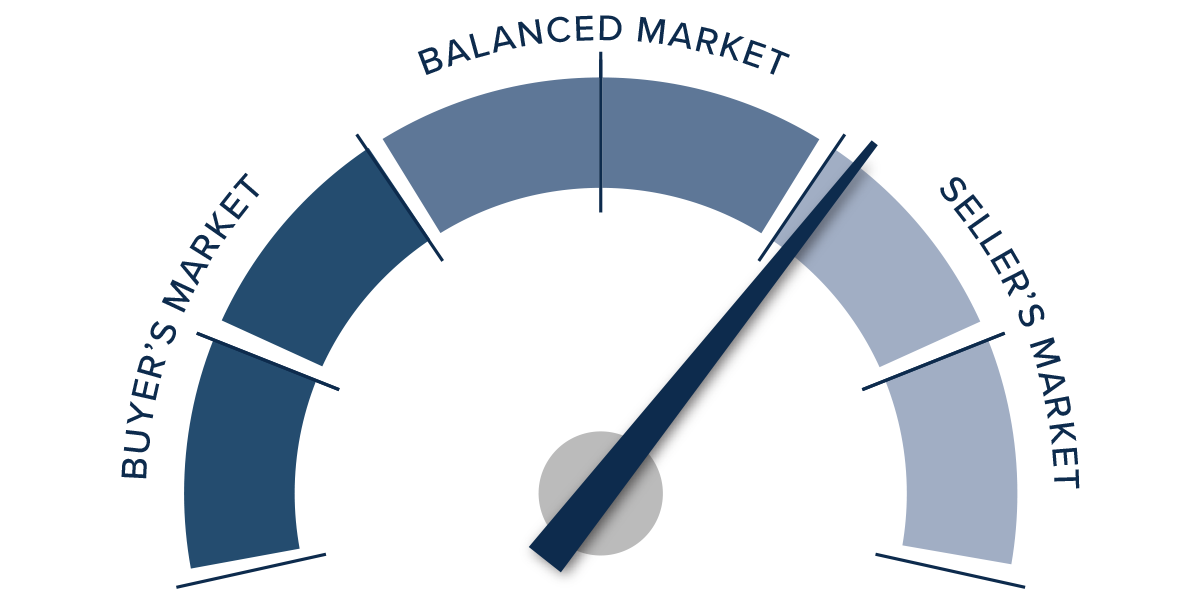
For the time being, rising list and sale prices, shorter time-on-market, and higher pending and closed sales appear to be offsetting higher mortgage rates. Given these factors, I have moved the needle in favor of sellers. However, it will be interesting to see what the market looks like after the summer lull.
About Matthew Gardner

As Chief Economist for Windermere Real Estate, Matthew Gardner is responsible for analyzing and interpreting economic data and its impact on the real estate market on both a local and national level. Matthew has over 30 years of professional experience both in the U.S. and U.K.
In addition to his day-to-day responsibilities, Matthew sits on the Washington State Governors Council of Economic Advisors; chairs the Board of Trustees at the Washington Center for Real Estate Research at the University of Washington; and is an Advisory Board Member at the Runstad Center for Real Estate Studies at the University of Washington where he also lectures in real estate economics.
Q2 2023 Northern California Real Estate Market Update

The following analysis of select counties of the Northern California real estate market is provided by Windermere Real Estate Chief Economist Matthew Gardner. We hope that this information may assist you with making better-informed real estate decisions. For further information about the housing market in your area, please don’t hesitate to contact your Windermere Real Estate agent.
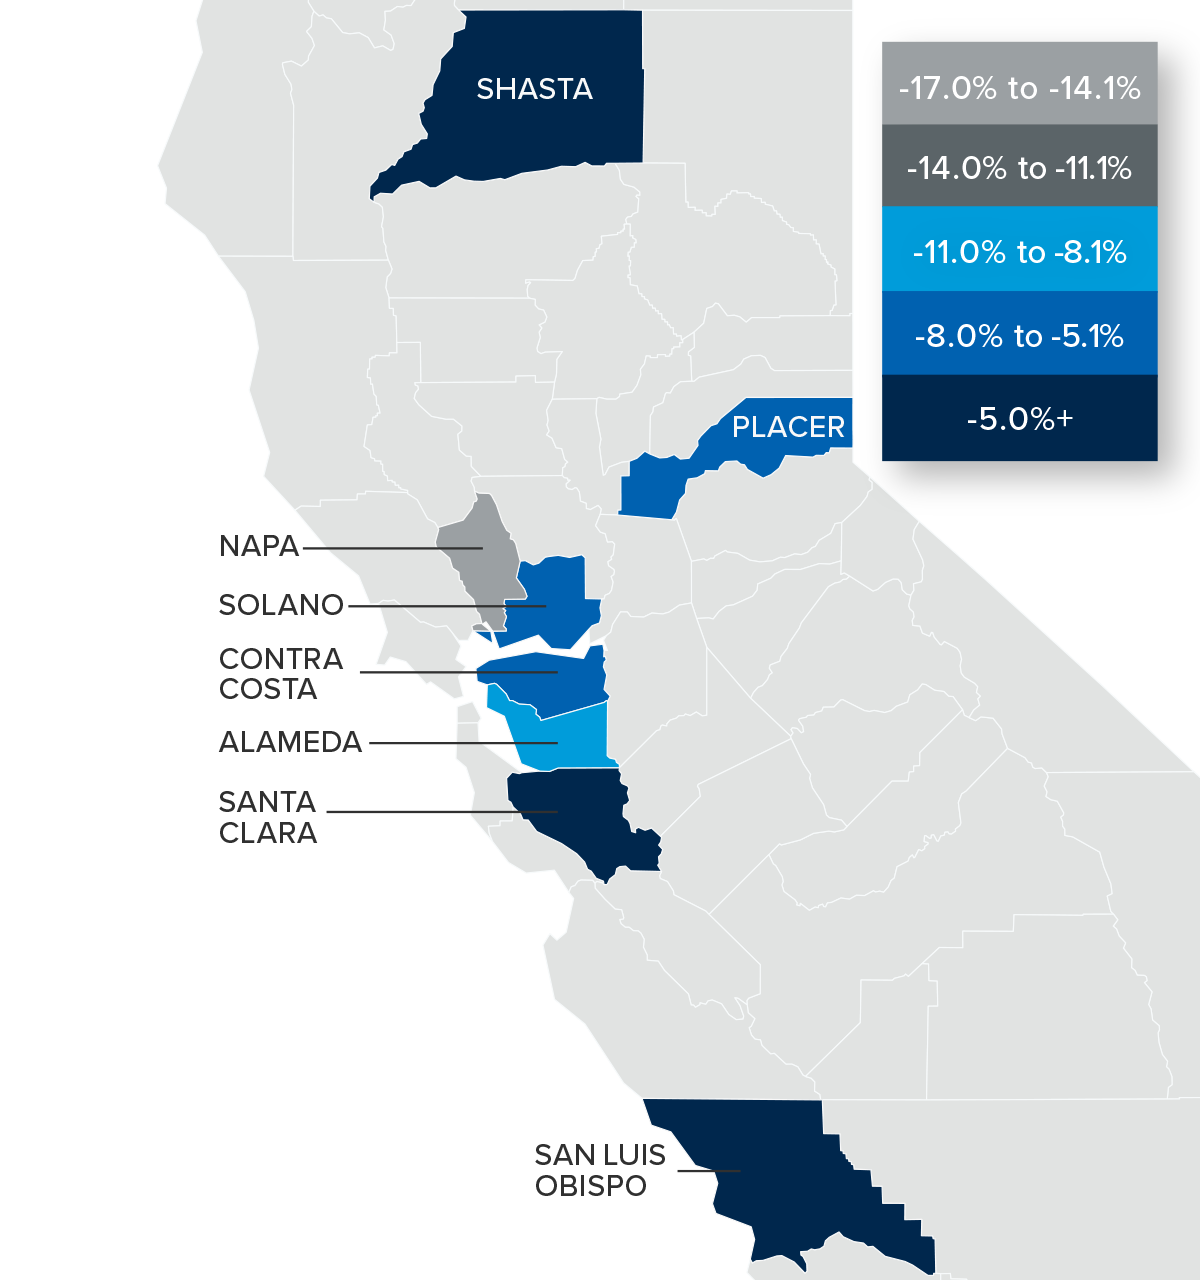
Regional Economic Overview
Total employment in the counties covered by this report was flat year over year. Job gains in Placer, San Luis Obispo, and Santa Clara counties were offset by job losses in the rest of the region. That said, the regional unemployment rate was a reasonable 3.5%. The lowest jobless rate was in San Luis Obispo County (3%), and the highest rate was in Shasta County (4.9%).
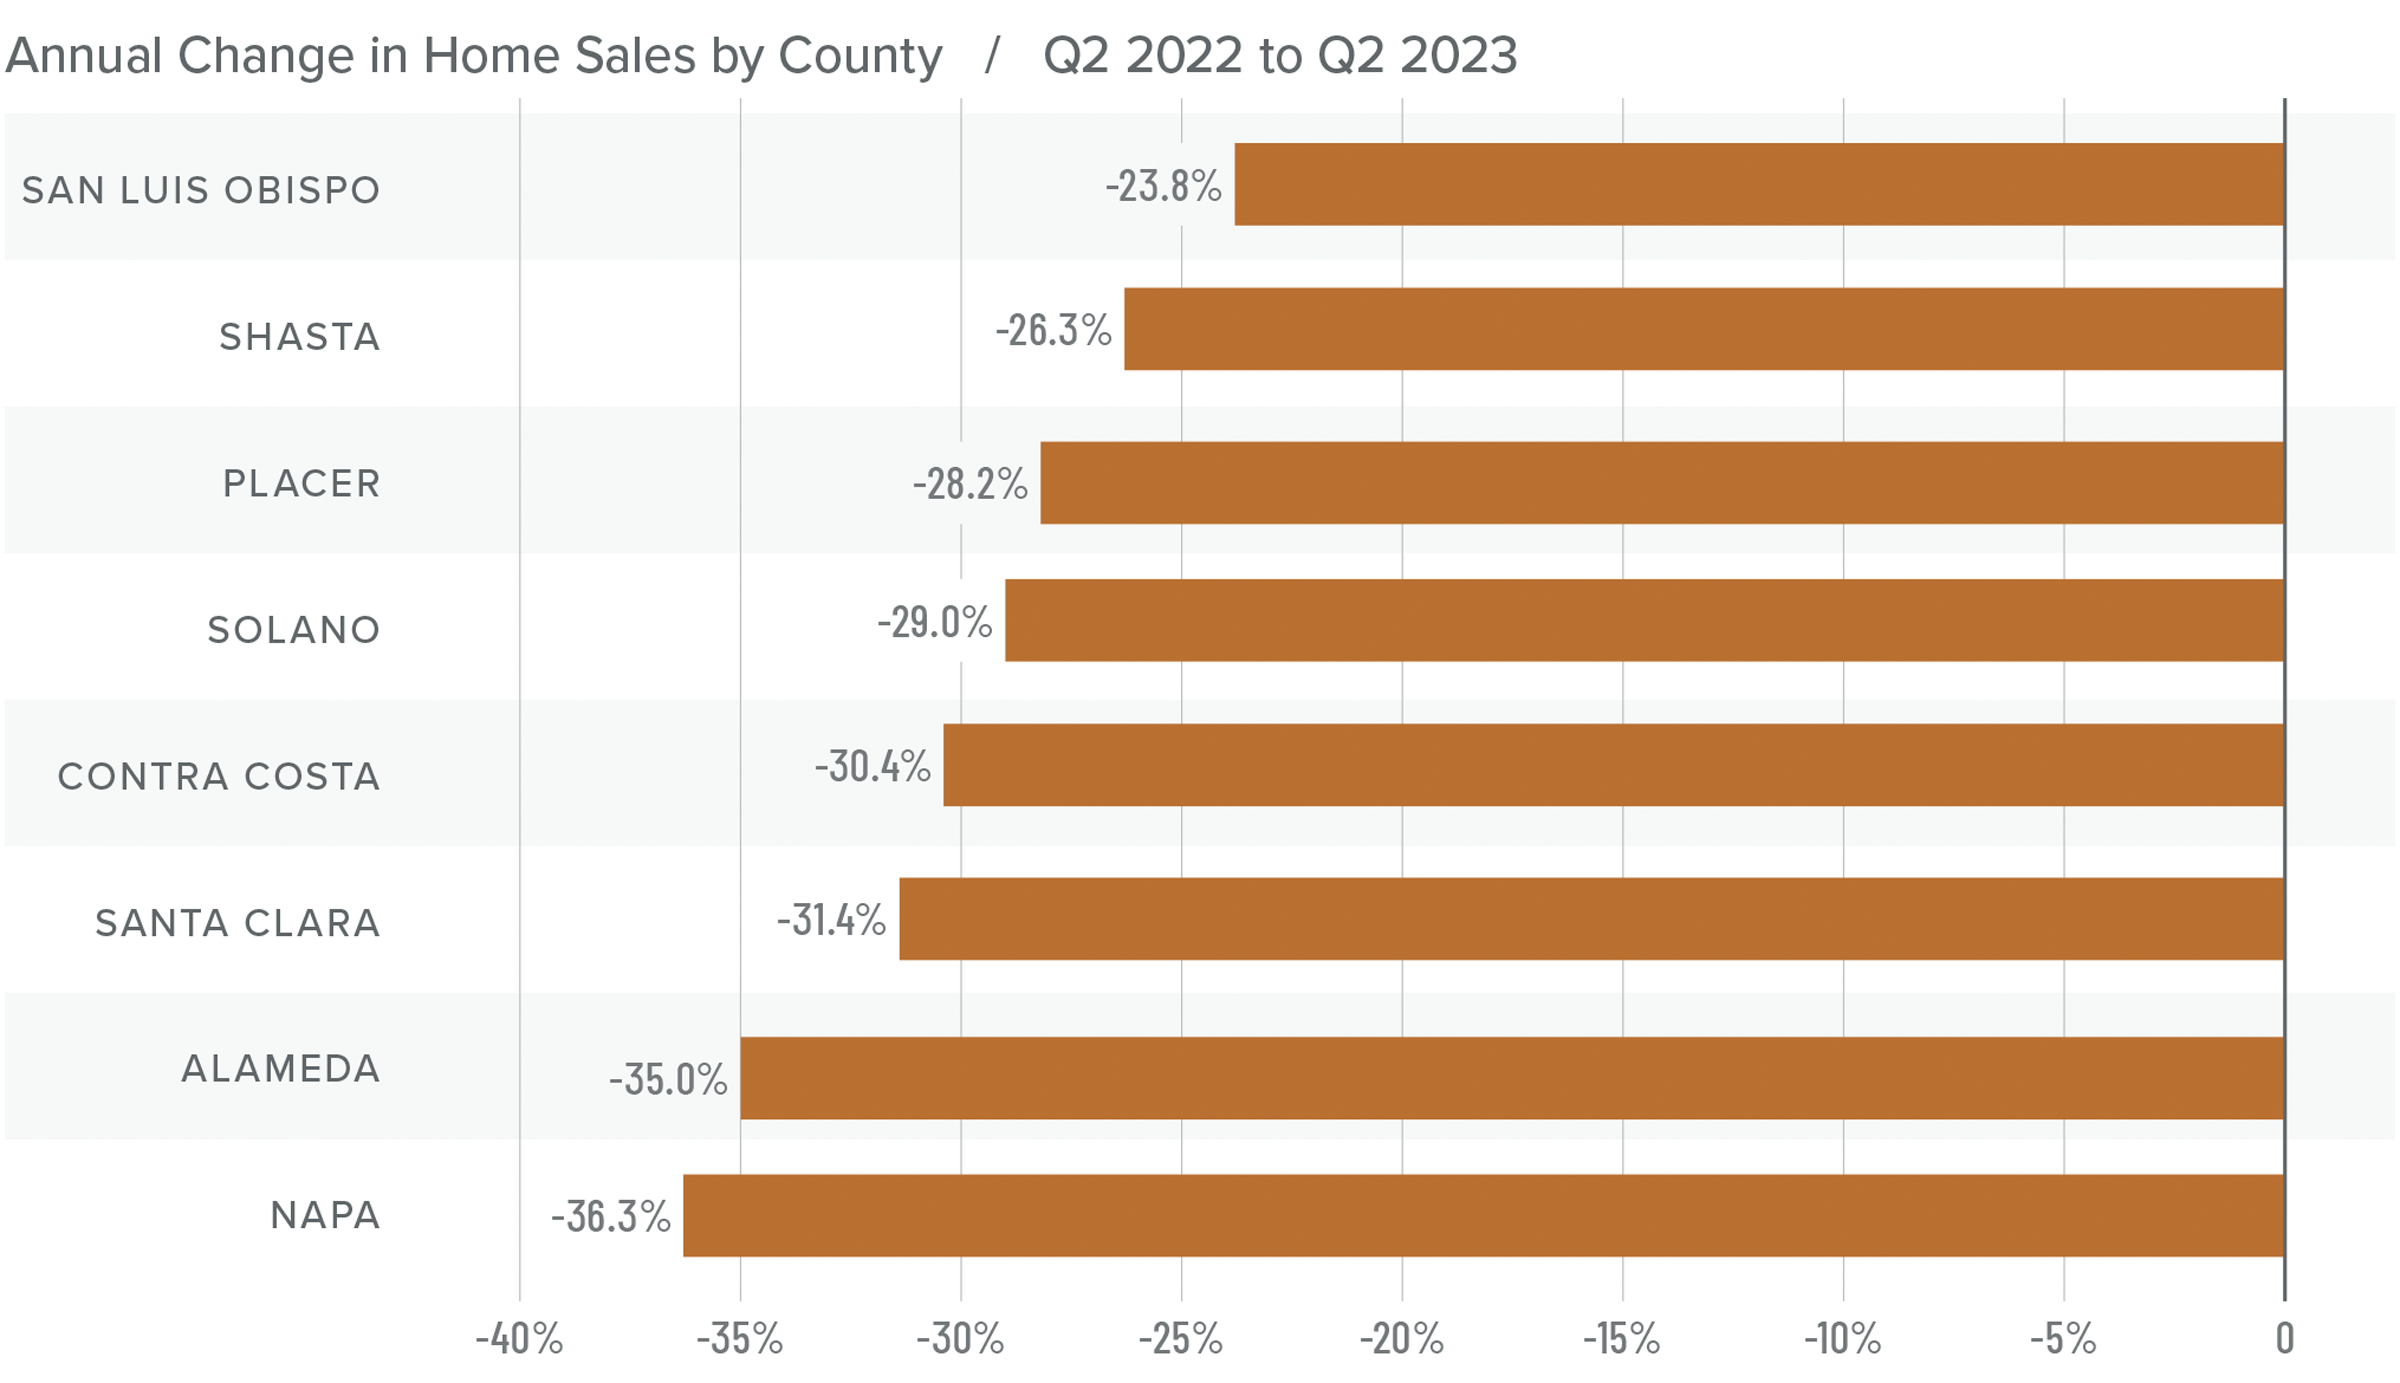
Northern California Home Sales
❱ In the second quarter of 2023, 9,999 homes sold, which was a significant decrease from the more than 14,500 homes that sold in the second quarter of 2022. However, sales were up almost 50% compared to the first quarter of this year.
❱ Year over year, sales fell across the board, but there was significant growth in all market areas compared to the first quarter of 2023.
❱ Listing inventory was up 15.2% from the first quarter, which likely contributed to better sales volume despite higher mortgage rates.
❱ Pending home sales were up 33.1% from the first quarter of 2023, which suggests that the growth in sales may continue into the summer.
Northern California Home Prices
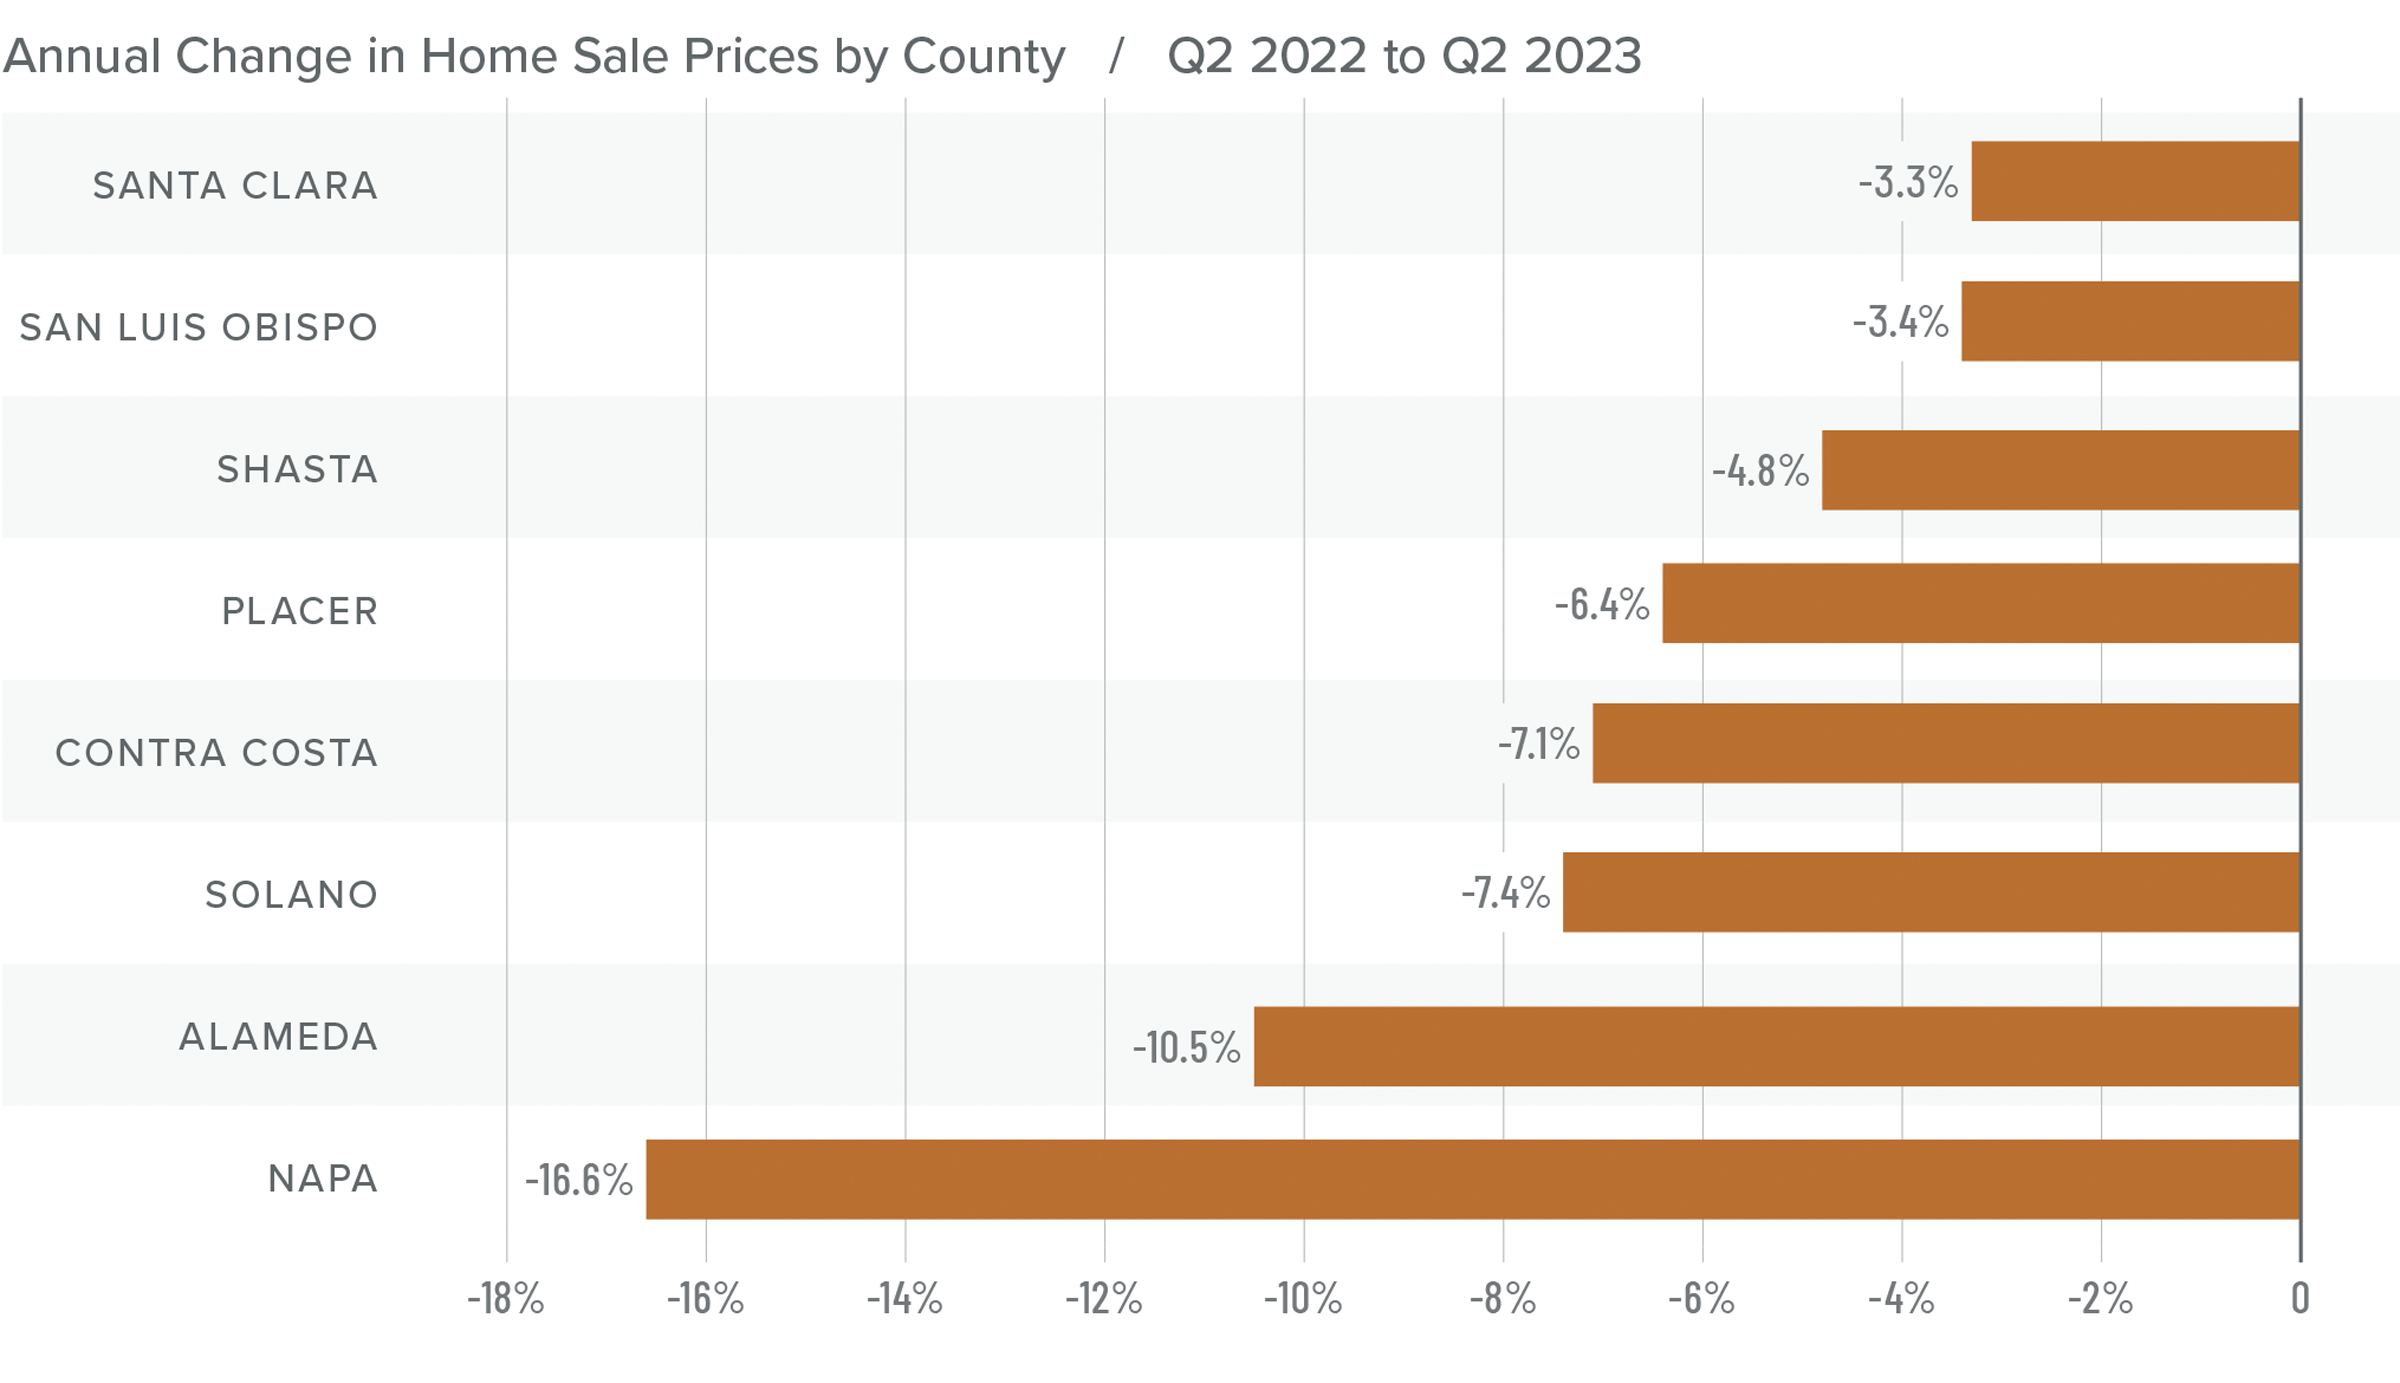
❱ Higher mortgage rates continue to impact home prices. The average price of a home sold in the region dropped 7.1% from the second quarter of 2022, but sale prices were up 16.1% compared to the first quarter of this year.
❱ Median list prices in the region rose 5.6% compared to the previous quarter. However, all markets were not equal: median asking prices dropped in Santa Clara, Placer, Shasta, and San Luis Obispo counties.
❱ Prices fell across the board from the second quarter of 2022, with double-digit drops in Napa and Alameda counties. Compared to the first quarter of 2023, sale prices were higher in all market areas, with double-digit growth in Alameda, Contra Costa, Napa, and Santa Clara counties.
❱ I predicted in the first quarter Gardner Report that the worst of the price drops were behind us, and the data suggests that this is true. Stability is returning, even in the face of higher mortgage rates.
Mortgage Rates
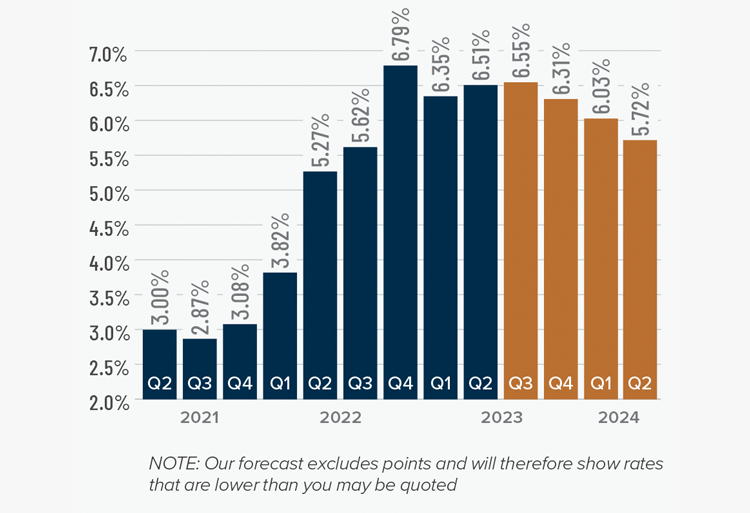
Although they were less erratic than the first quarter, mortgage rates unfortunately trended higher and ended the quarter above 7%. This was due to the short debt ceiling impasse, as well as several economic datasets that suggested the U.S. economy was not slowing at the speed required by the Federal Reserve.
While the June employment report showed fewer jobs created than earlier in the year, as well as downward revisions to prior gains, inflation has not sufficiently slowed. Until it does, rates cannot start to trend consistently lower. With the economy not slowing as fast as expected, I have adjusted my forecast: Rates will hold at current levels in third quarter and then start to trend lower through the fall. Although there are sure to be occasional spikes, my model now shows the 30-year fixed rate breaking below 6% next spring.
Northern California Days on Market
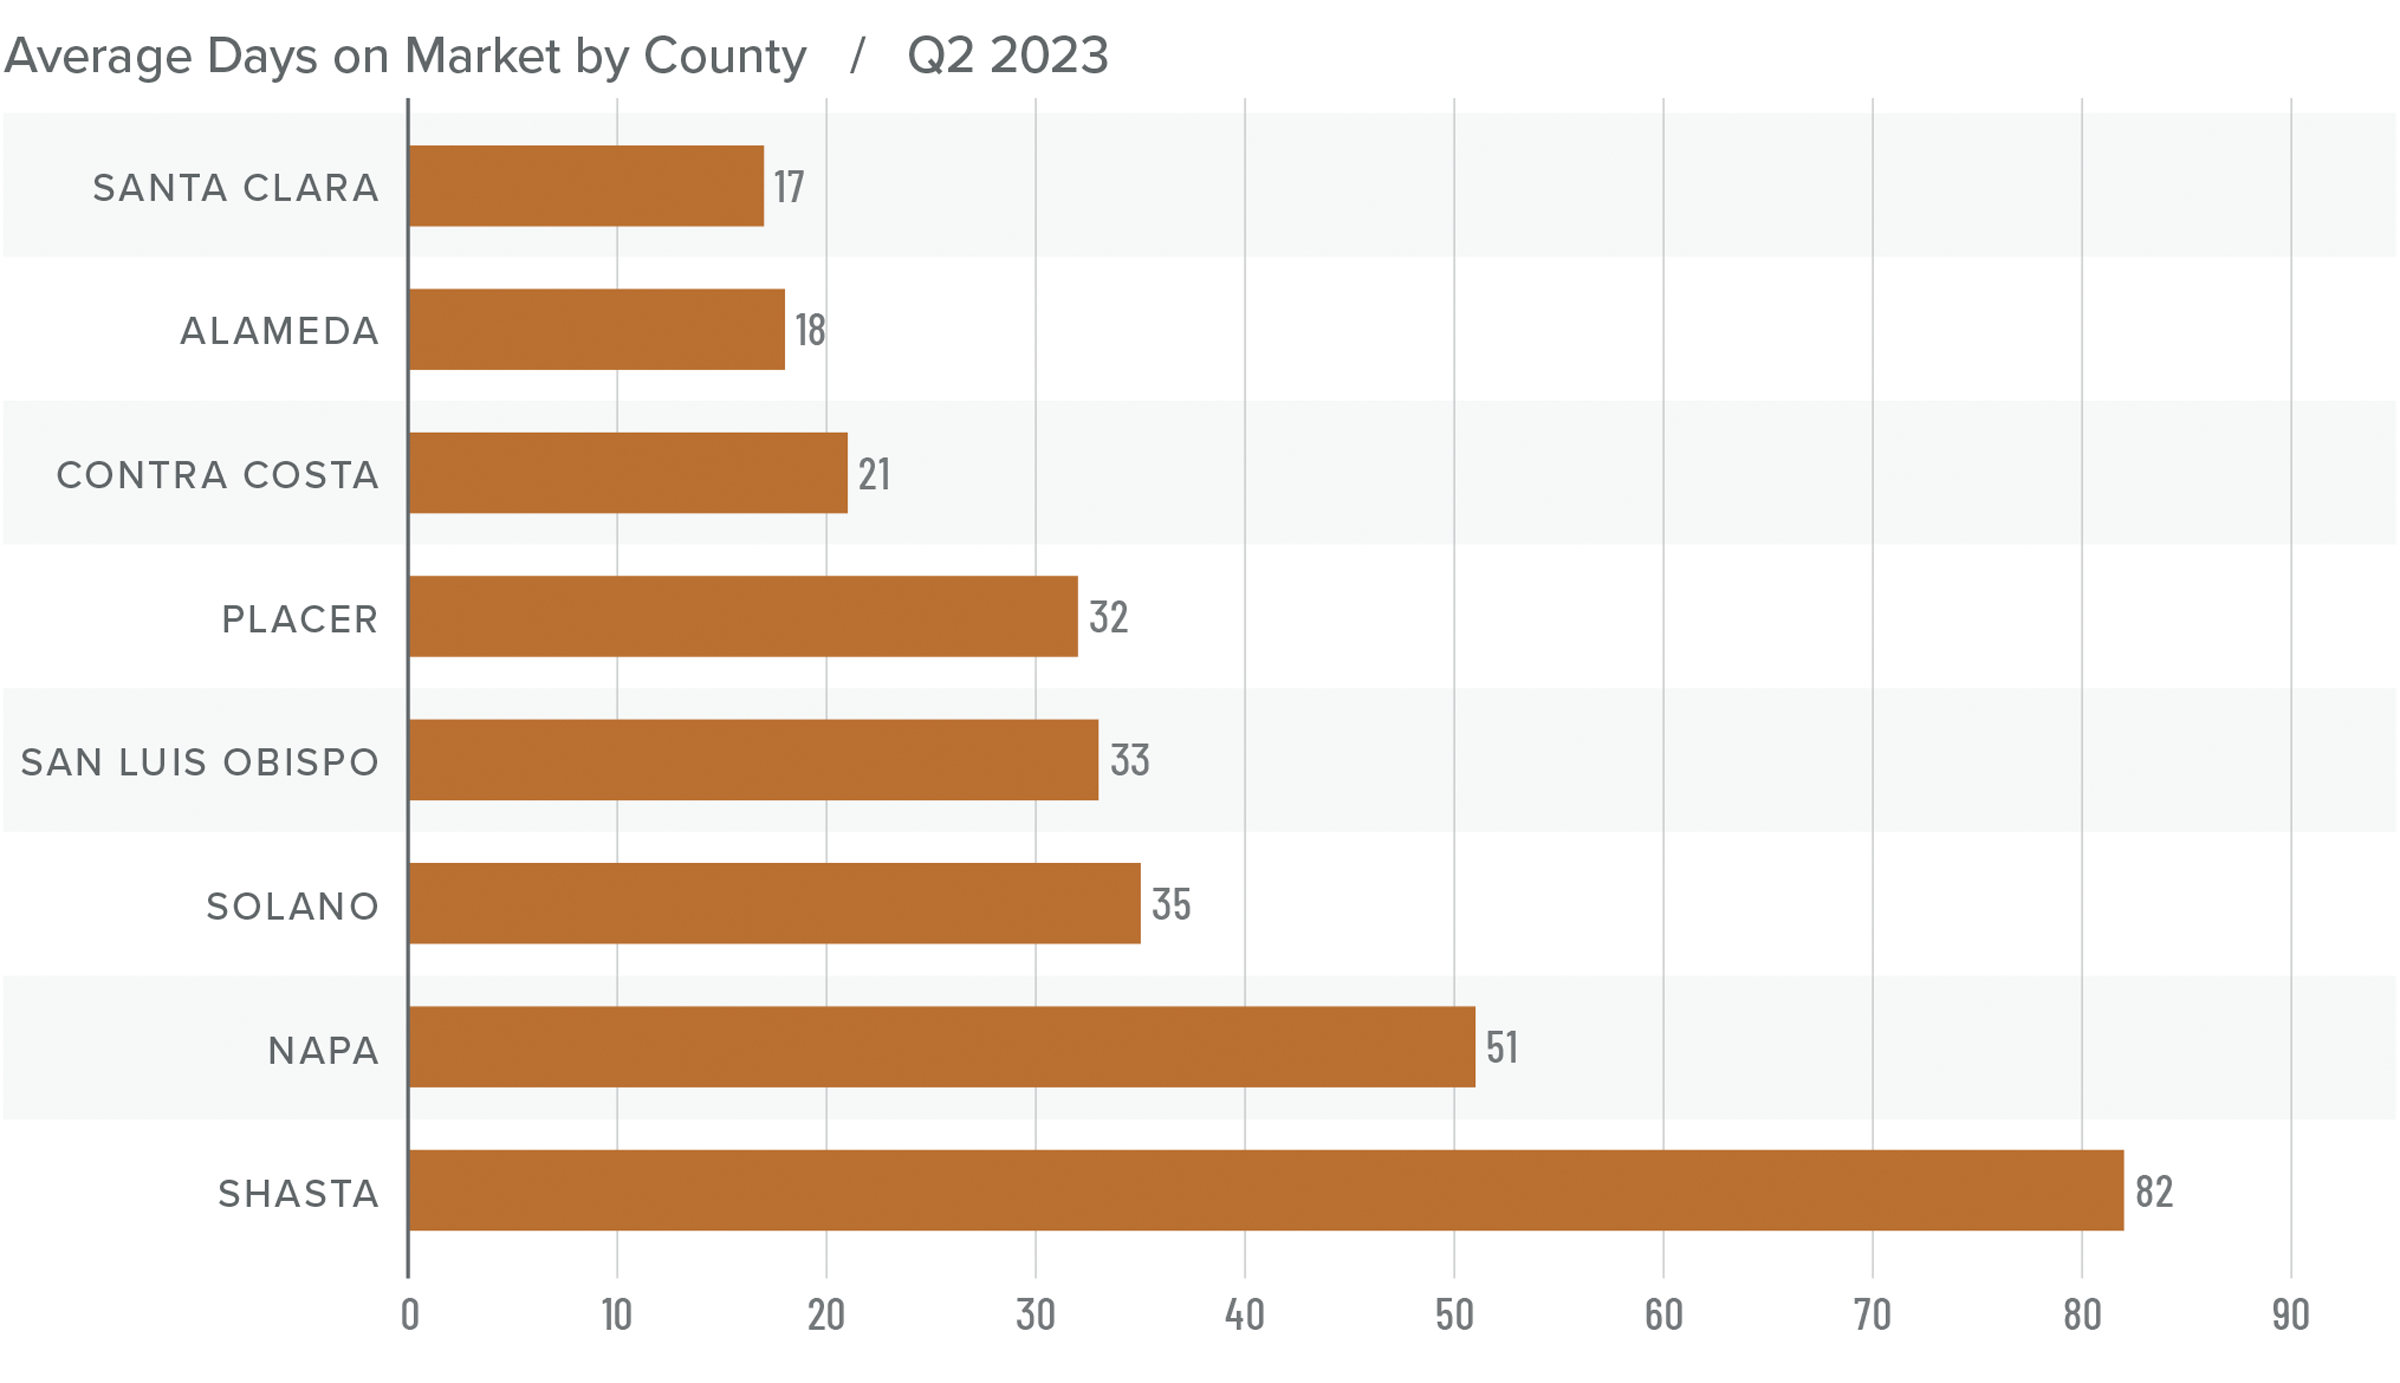
❱ The average time it took to sell a home in the Northern California counties in this report rose ten days compared to the second quarter of 2022.
❱ The length of time it took to sell a home rose across the region compared to the second quarter of 2022. However, market time fell across the board compared to the first quarter of this year.
❱ In the second quarter, it took an average of 36 days to sell a home, which was 15 fewer days than in the first quarter of the year.
❱ Homes sold the fastest in Santa Clara County and slowest in Shasta County. Compared to the first quarter of 2023, the greatest drop in market time was in Solano County (-27 days) and Placer County (-17 days).
Conclusions
This speedometer reflects the state of the region’s real estate market using housing inventory, price gains, home sales, interest rates, and larger economic factors.
It was interesting to see the housing market pick back up even though the economy appears to be on pause and mortgage rates are high. The question is whether this can continue. Despite higher supply levels, they remain well below historic averages, which is causing prices to rise. The reason for this is that 30% of homeowners in California have a mortgage rate at or below 3%, so there is no incentive to sell if they don’t have to.

Assuming that supply will not increase significantly and that my forecast for mortgage rates to fall modestly through the rest of the year is accurate, I stand by my prediction that the worst of the price drops are over in the Northern California markets covered by this report. Given all the above, I am moving the needle more in favor of sellers, but still holding in the balanced quadrant of the speedometer.
About Matthew Gardner
As Chief Economist for Windermere Real Estate, Matthew Gardner is responsible for analyzing and interpreting economic data and its impact on the real estate market on both a local and national level. Matthew has over 30 years of professional experience both in the U.S. and U.K.
In addition to his day-to-day responsibilities, Matthew sits on the Washington State Governors Council of Economic Advisors; chairs the Board of Trustees at the Washington Center for Real Estate Research at the University of Washington; and is an Advisory Board Member at the Runstad Center for Real Estate Studies at the University of Washington where he also lectures in real estate economics.
Q2 2023 Nevada Real Estate Market Update

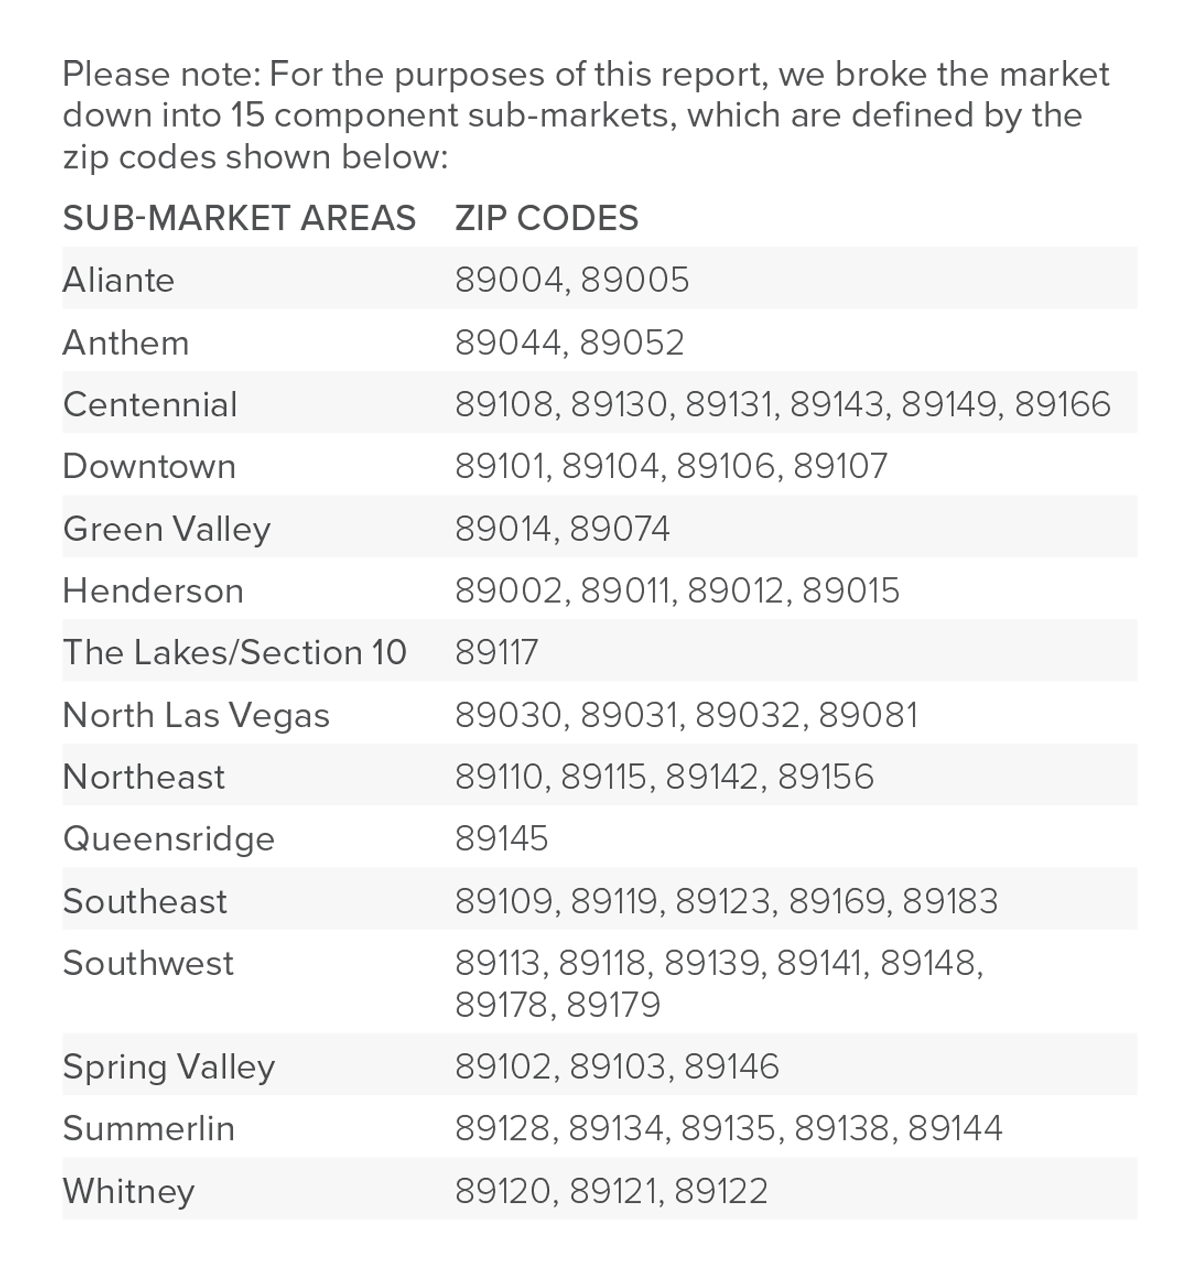
The following analysis of select counties of the greater Las Vegas real estate market is provided by Windermere Real Estate Chief Economist Matthew Gardner. We hope that this information may assist you with making better-informed real estate decisions. For further information about the housing market in your area, please don’t hesitate to contact your Windermere Real Estate agent.
Regional Economic Overview
Clark County continues to add jobs, but the pace of growth has started to taper. The market has added 49,200 new jobs over the past 12 months. Although that was the slowest annual growth rate since before the pandemic, it still represents an impressive increase of 4.6%. The non-seasonally adjusted jobless rate in May was a respectable 5.6%. This was up .01% over April, but down from 8.1% the second quarter of 2022. When adjusted for seasonality, the rate was also 5.6%, down from 5.9% in the second quarter of 2022. My latest employment forecast for the Las Vegas metro area suggests that employment growth will continue to taper, but that over 43,000 new jobs will have been created in 2023.
Nevada Home Sales
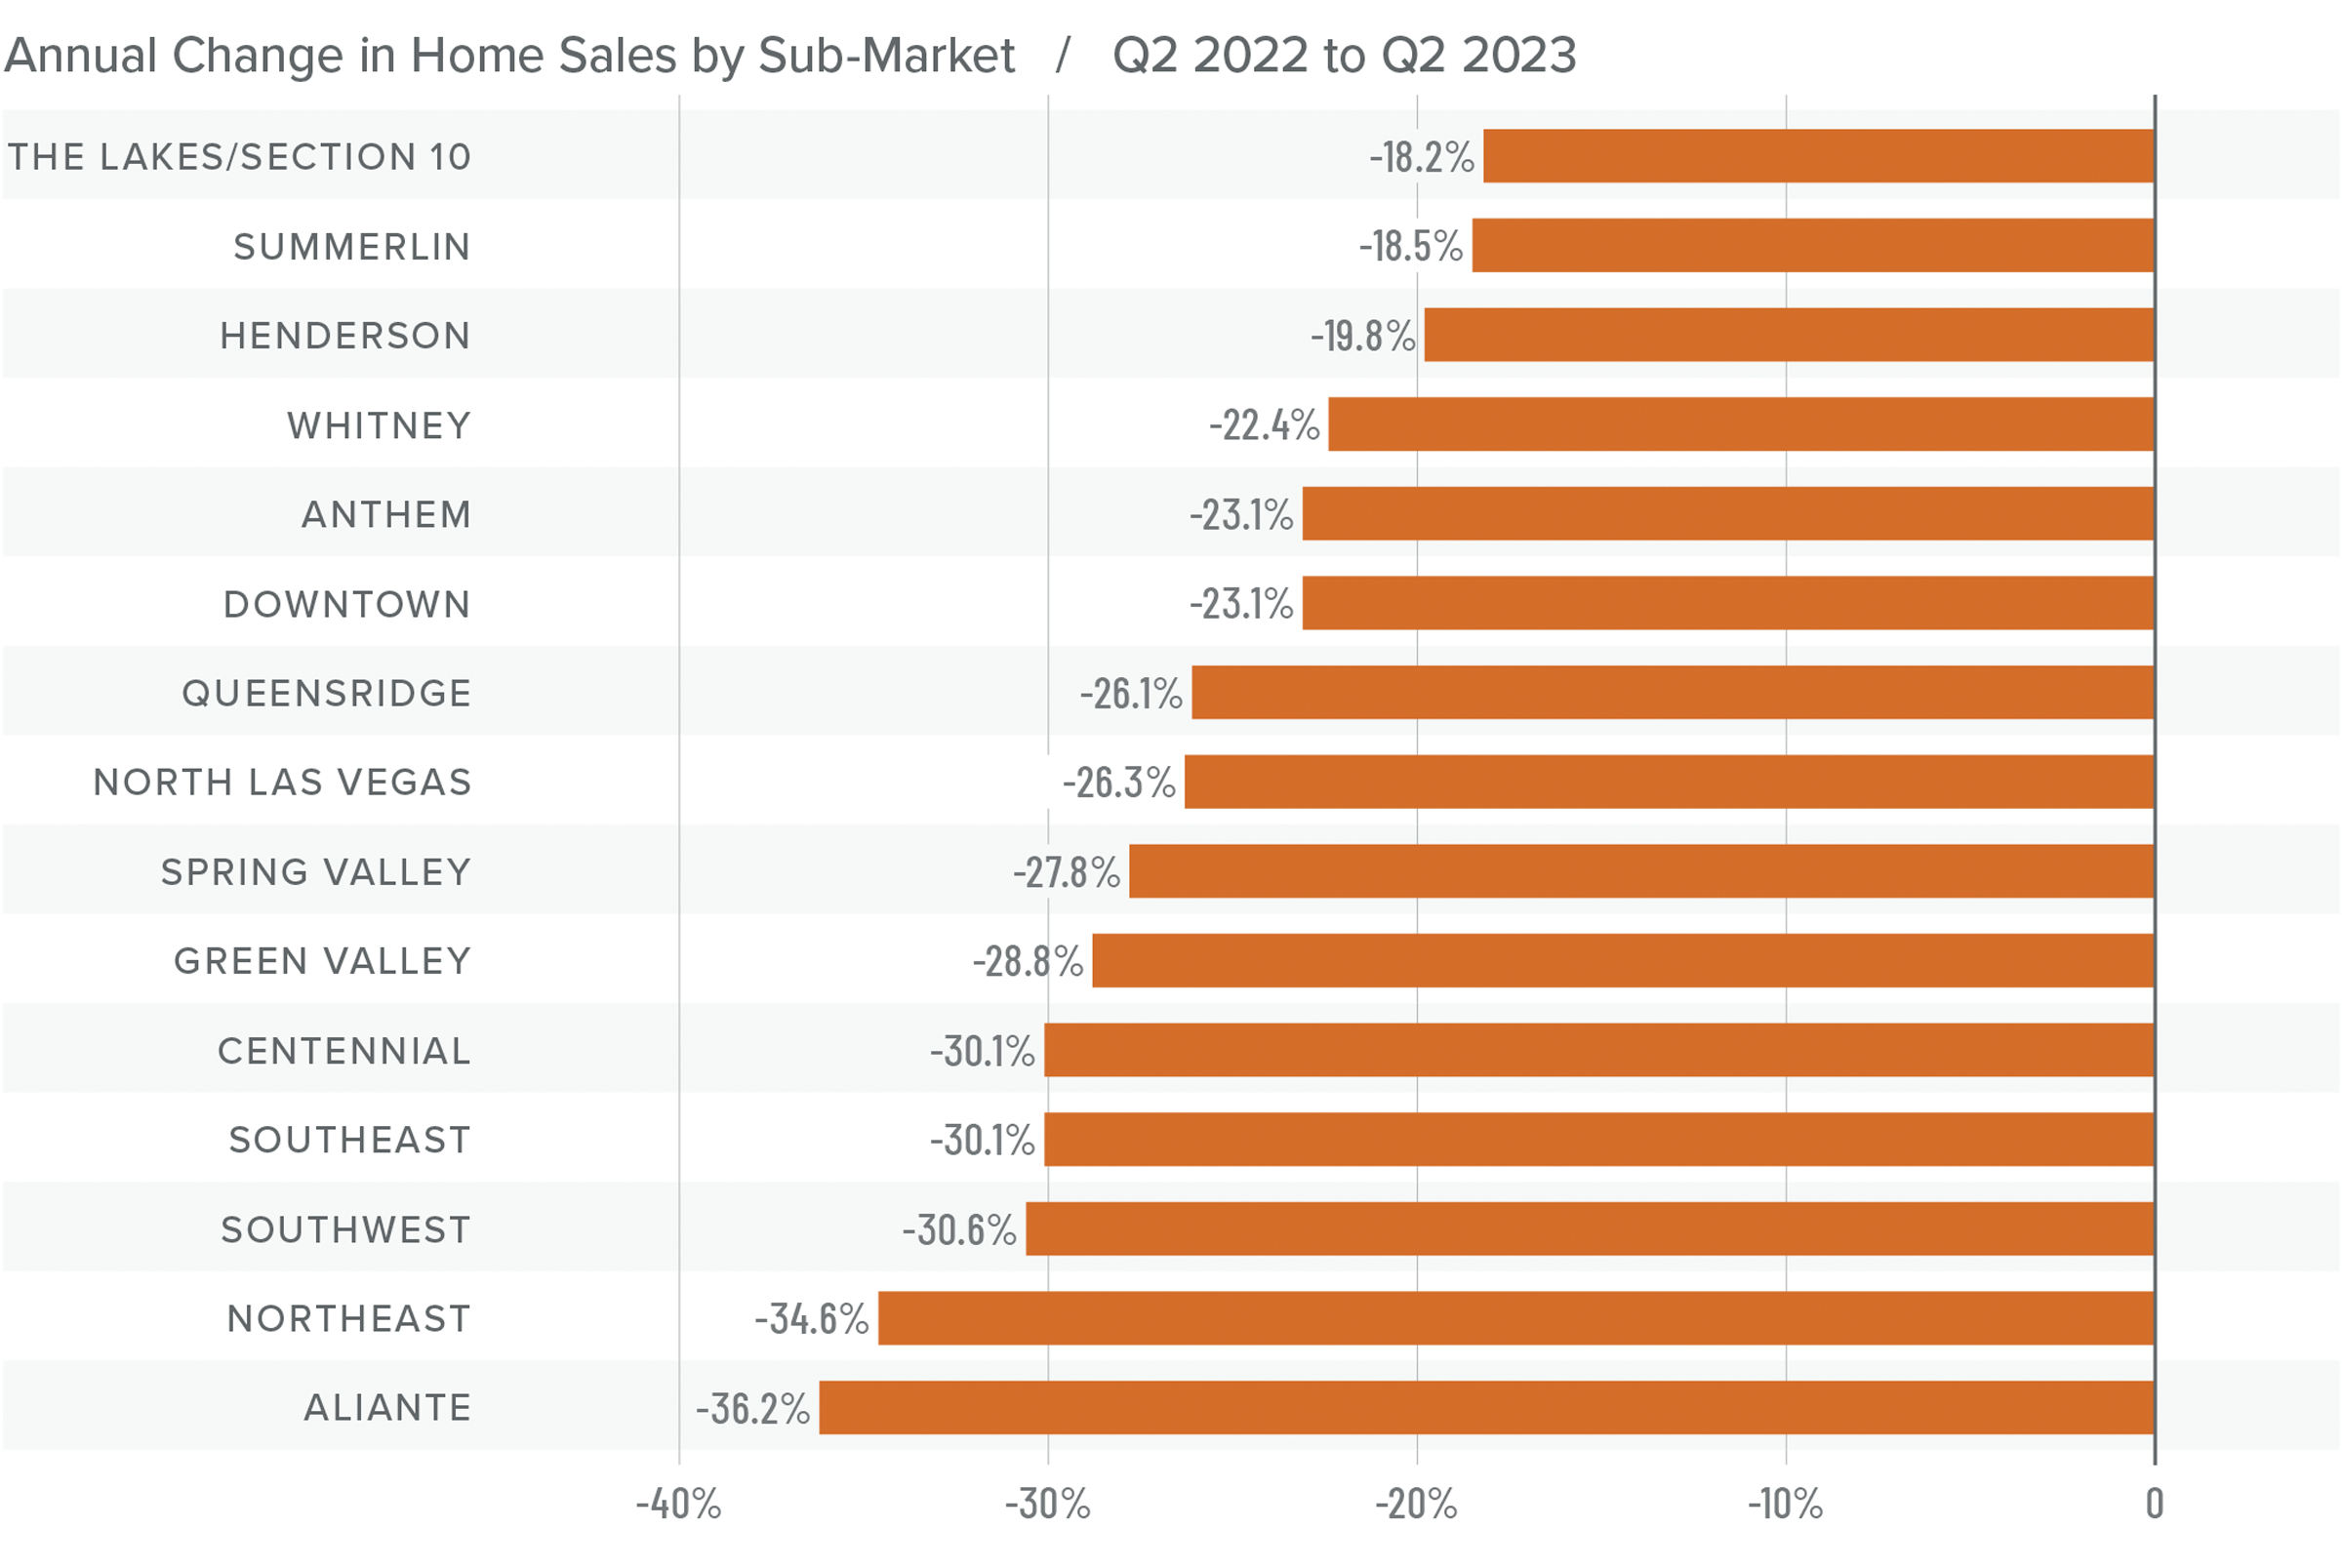
❱ A total of 6,908 homes sold in the second quarter of the year, which was a drop of 26.3% compared to the second quarter of 2022. However, sales continued the upward momentum we saw in the first quarter and were an impressive 23.7% higher than in the first quarter of the year.
❱ Year over year, sales fell significantly across the board. However, sales rose in every neighborhood compared to the first quarter of 2023. Every area except Aliante, The Lakes/Section 8, and Northeast Las Vegas saw double-digit gains.
❱ Even more impressive was the fact that sales rose from the first quarter despite the 2.5% drop in the average number of homes for sale.
❱ Pending sales, which are an indicator of future closings, rose 10.7% compared to the first quarter, suggesting that the market may see further growth in sales in the third quarter of 2023.
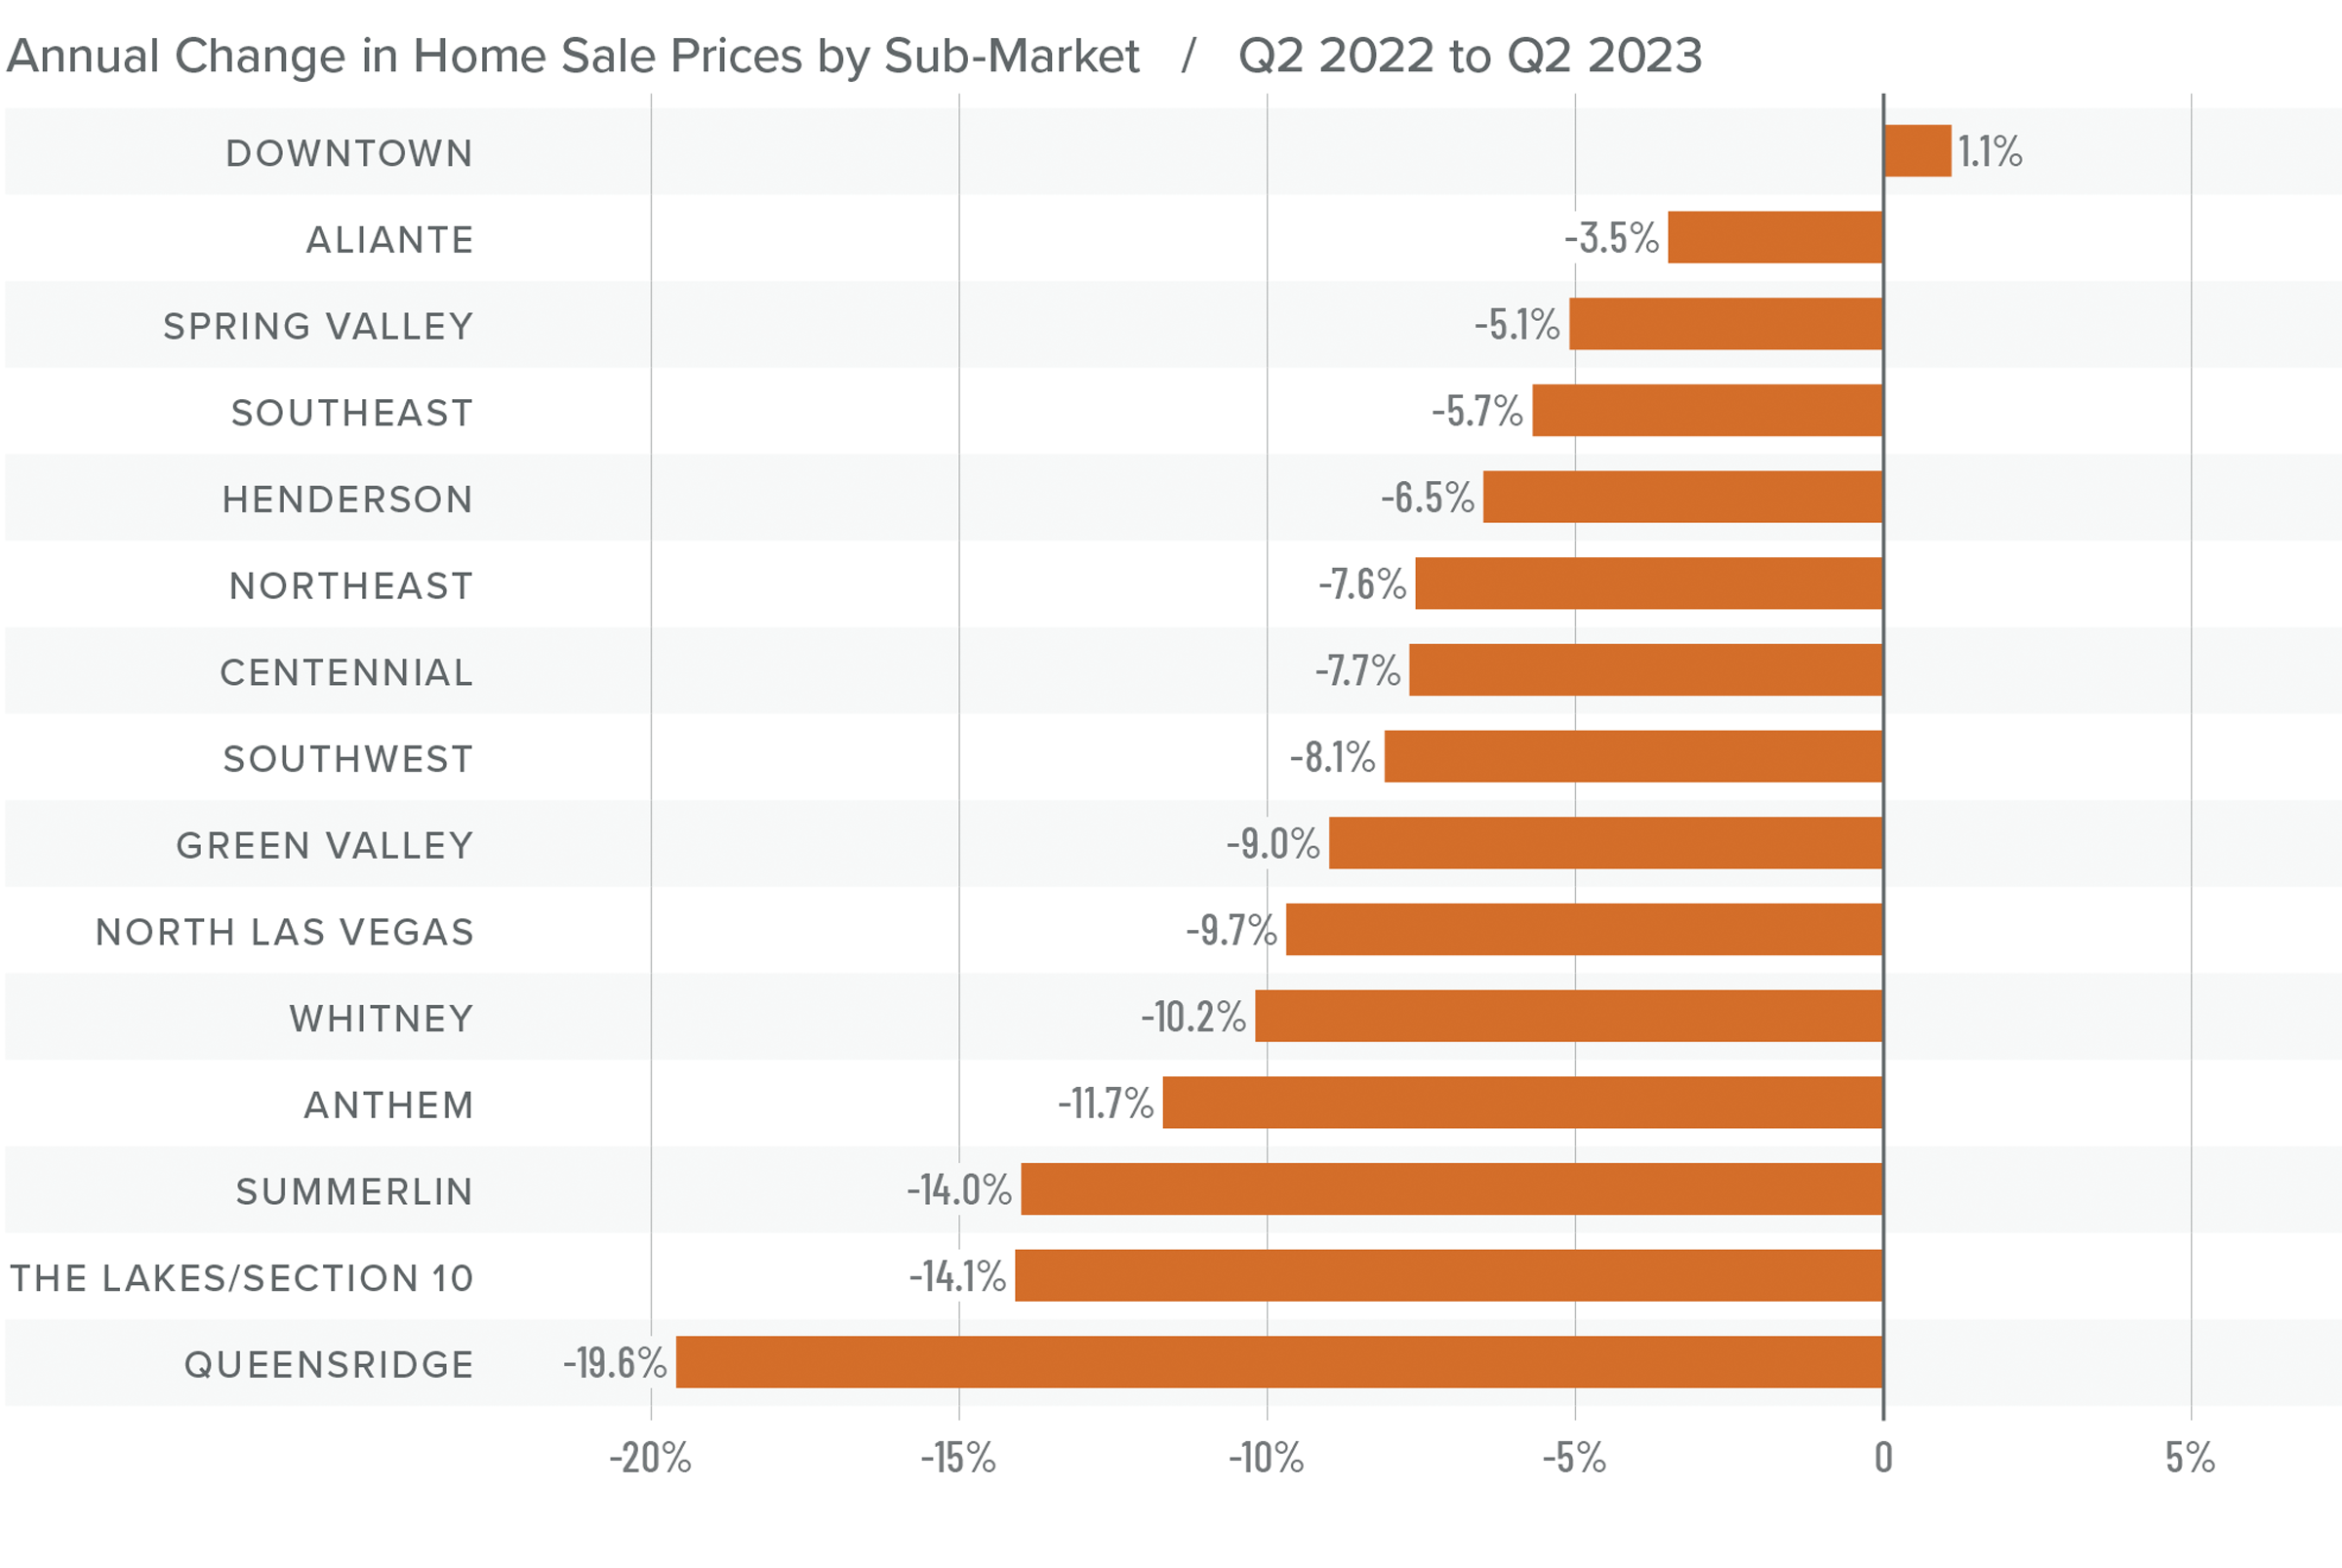
Nevada Home Prices
❱ Sale prices fell 10.5% year over year but rose 2.1% compared to the first quarter of 2023. The average home sale price in the area was $481,581.
❱ Median list prices rose 3.9% from the first quarter of the year. The only neighborhood where list prices fell was in Southeast Las Vegas. Even there, the decline was a very modest 1.3%.
❱ Year over year, prices fell in every market other than Downtown. However, compared to the first quarter of this year, prices rose across the board.
❱ It would be natural to think that prices should have fallen further given deteriorating affordability and far higher mortgage rates than we have seen in a number of years; however, that does not appear to be the case.
Mortgage Rates
Although they were less erratic than the first quarter, mortgage rates unfortunately trended higher and ended the quarter above 7%. This was due to the short debt ceiling impasse, as well as several economic datasets that suggested the U.S. economy was not slowing at the speed required by the Federal Reserve.
While the June employment report showed fewer jobs created than earlier in the year, as well as downward revisions to prior gains, inflation has not sufficiently slowed. Until it does, rates cannot start to trend consistently lower. With the economy not slowing as fast as expected, I have adjusted my forecast: Rates will hold at current levels in third quarter and then start to trend lower through the fall. Although there are sure to be occasional spikes, my model now shows the 30-year fixed rate breaking below 6% next spring.

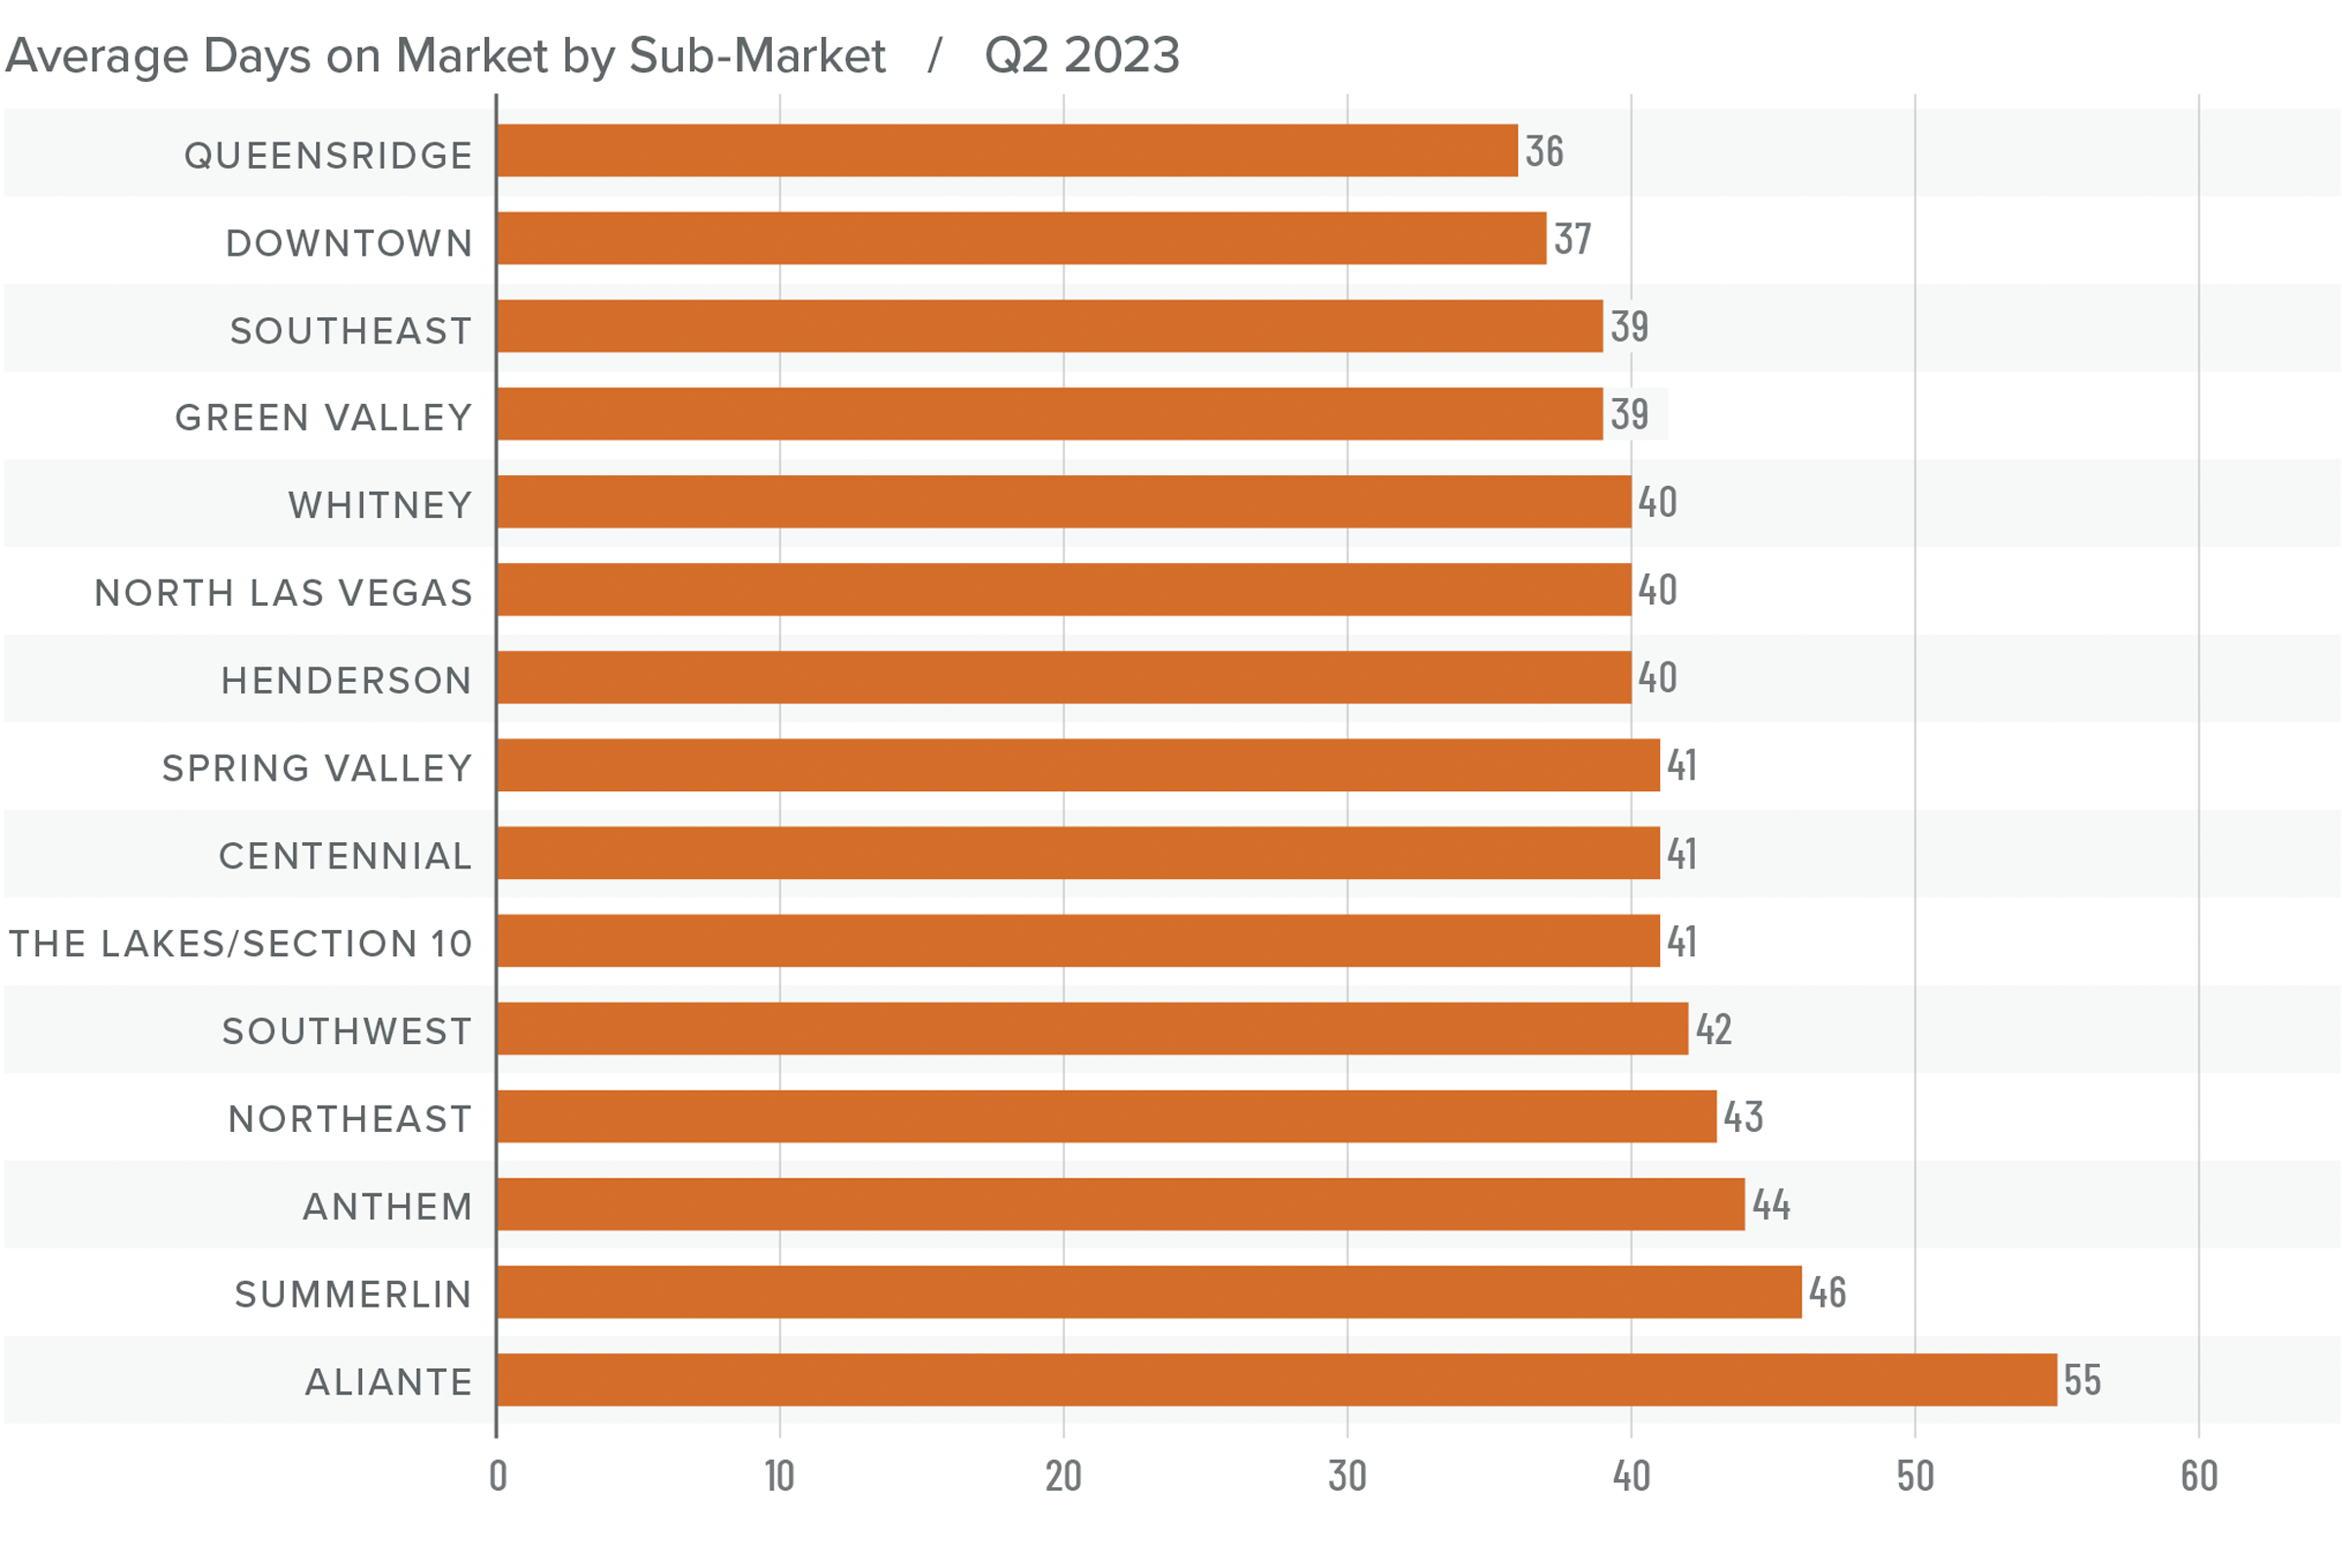
Nevada Days on Market
❱ The average time it took to sell a home in the region rose 26 days compared to the second quarter of 2022.
❱ It took an average of 42 days to sell a home in the second quarter, which was 13 fewer days than it took in the first quarter of 2023.
❱ Days on market rose in all neighborhoods compared to the same period in 2022. However, average market time fell in every neighborhood compared to the first quarter of this year.
❱ Tighter inventory levels are offsetting higher financing costs, which is lowering average market time.
Conclusions
This speedometer reflects the state of the region’s real estate market using housing inventory, price gains, home sales, interest rates, and larger economic factors.
Just when you think you can write off Las Vegas, it comes back to prove you wrong. The area’s housing market is resilient and is likely to continue being that way. Every index other than mortgage rates is favoring sellers right now. Inventory levels are down. Pending and closed sales are up, as are list and sale prices.

While the market currently favors home sellers, they are not in a completely dominant position. That said, given everything I’ve shared in this report, I have pushed the needle more in their favor.
About Matthew Gardner
As Chief Economist for Windermere Real Estate, Matthew Gardner is responsible for analyzing and interpreting economic data and its impact on the real estate market on both a local and national level. Matthew has over 30 years of professional experience both in the U.S. and U.K.
In addition to his day-to-day responsibilities, Matthew sits on the Washington State Governors Council of Economic Advisors; chairs the Board of Trustees at the Washington Center for Real Estate Research at the University of Washington; and is an Advisory Board Member at the Runstad Center for Real Estate Studies at the University of Washington where he also lectures in real estate economics.
Q2 2023 Utah Real Estate Market Update

The following analysis of select counties of the Utah real estate market is provided by Windermere Real Estate Chief Economist Matthew Gardner. We hope that this information may assist you with making better-informed real estate decisions. For further information about the housing market in your area, please don’t hesitate to contact your Windermere Real Estate agent.
Regional Economic Overview
Although it slowed in the first quarter of 2023, employment growth has stabilized in Utah. The state added 52,400 jobs over the past 12 months, which represents an annual growth rate of 3.1%. The counties covered by this report added almost 33,000 new jobs over the past year, representing a growth rate of 2.4%. As we saw in the first quarter of the year, the fastest growing county was Summit, which had a 5.8% annual growth rate. The slowest was again Morgan County, where the job level rose 1.6%. Utah’s unemployment rate in May was 2.5%, up .03% from the level in the second quarter of 2022. At the county level, the lowest jobless rate was in Morgan County (1.8%) and the highest was in Weber County, where 2.5% of the workforce was without a job. In aggregate, the unemployment rate within the counties contained in this report was only 2.3%.
Utah Home Sales
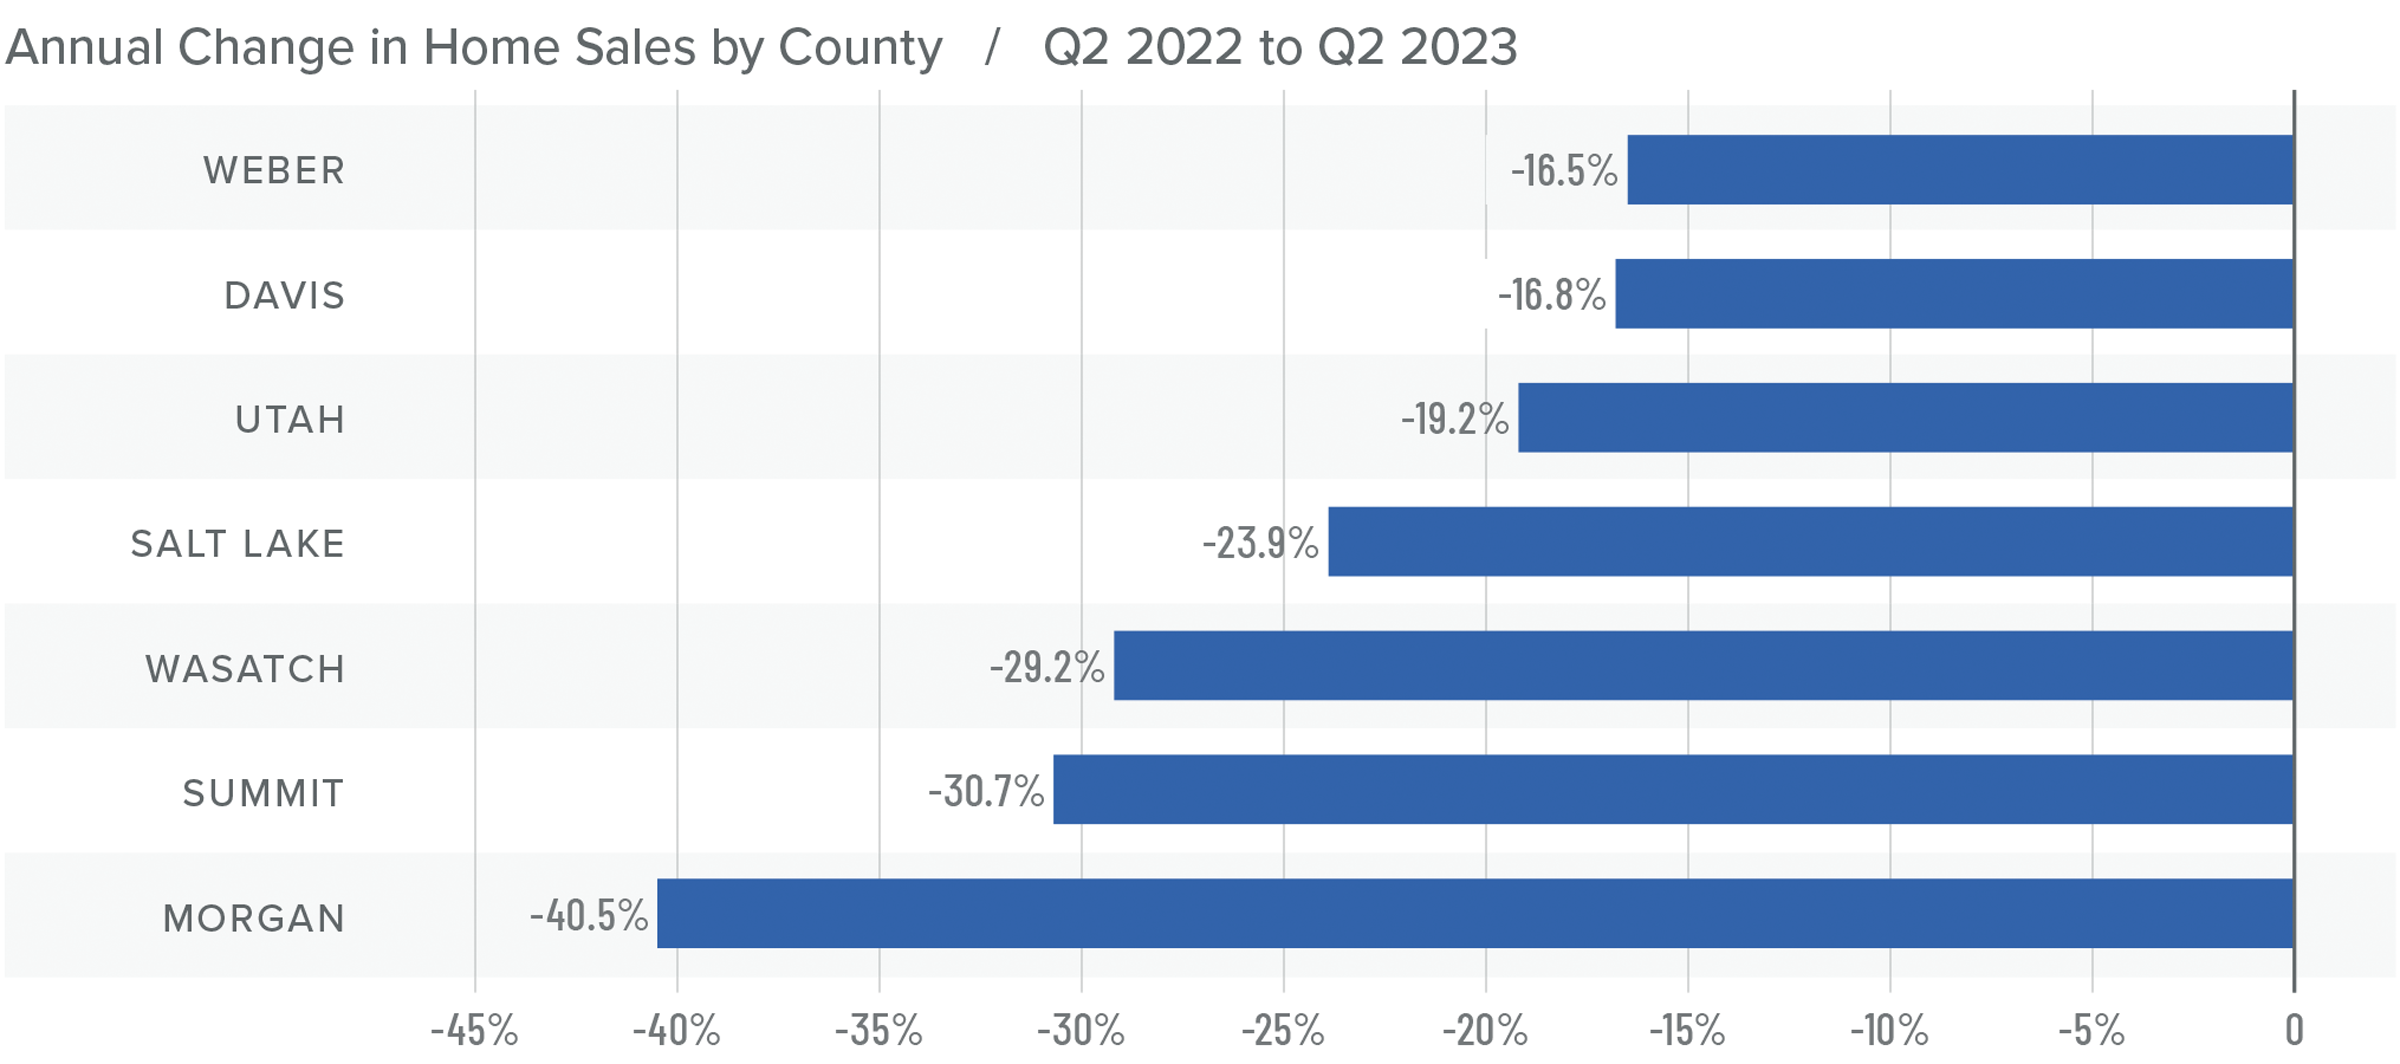
❱ In the second quarter, 6,939 homes were sold in the areas covered by this report. This was down 21% compared to the second quarter of 2022 but was 28.3% higher than in the first quarter of this year.
❱ Year over year, sales fell across the board. However, sales increased by double digits in every county covered by this report compared to the first quarter.
❱ It is quite likely that the higher number of homes sold compared to the previous quarter was a result of the impressive increase in the number of homes for sale. Inventory rose 12.6% over the first quarter.
❱ Pending sales rose 14.6% from the first quarter, suggesting that closings in the upcoming quarter will likely rise.
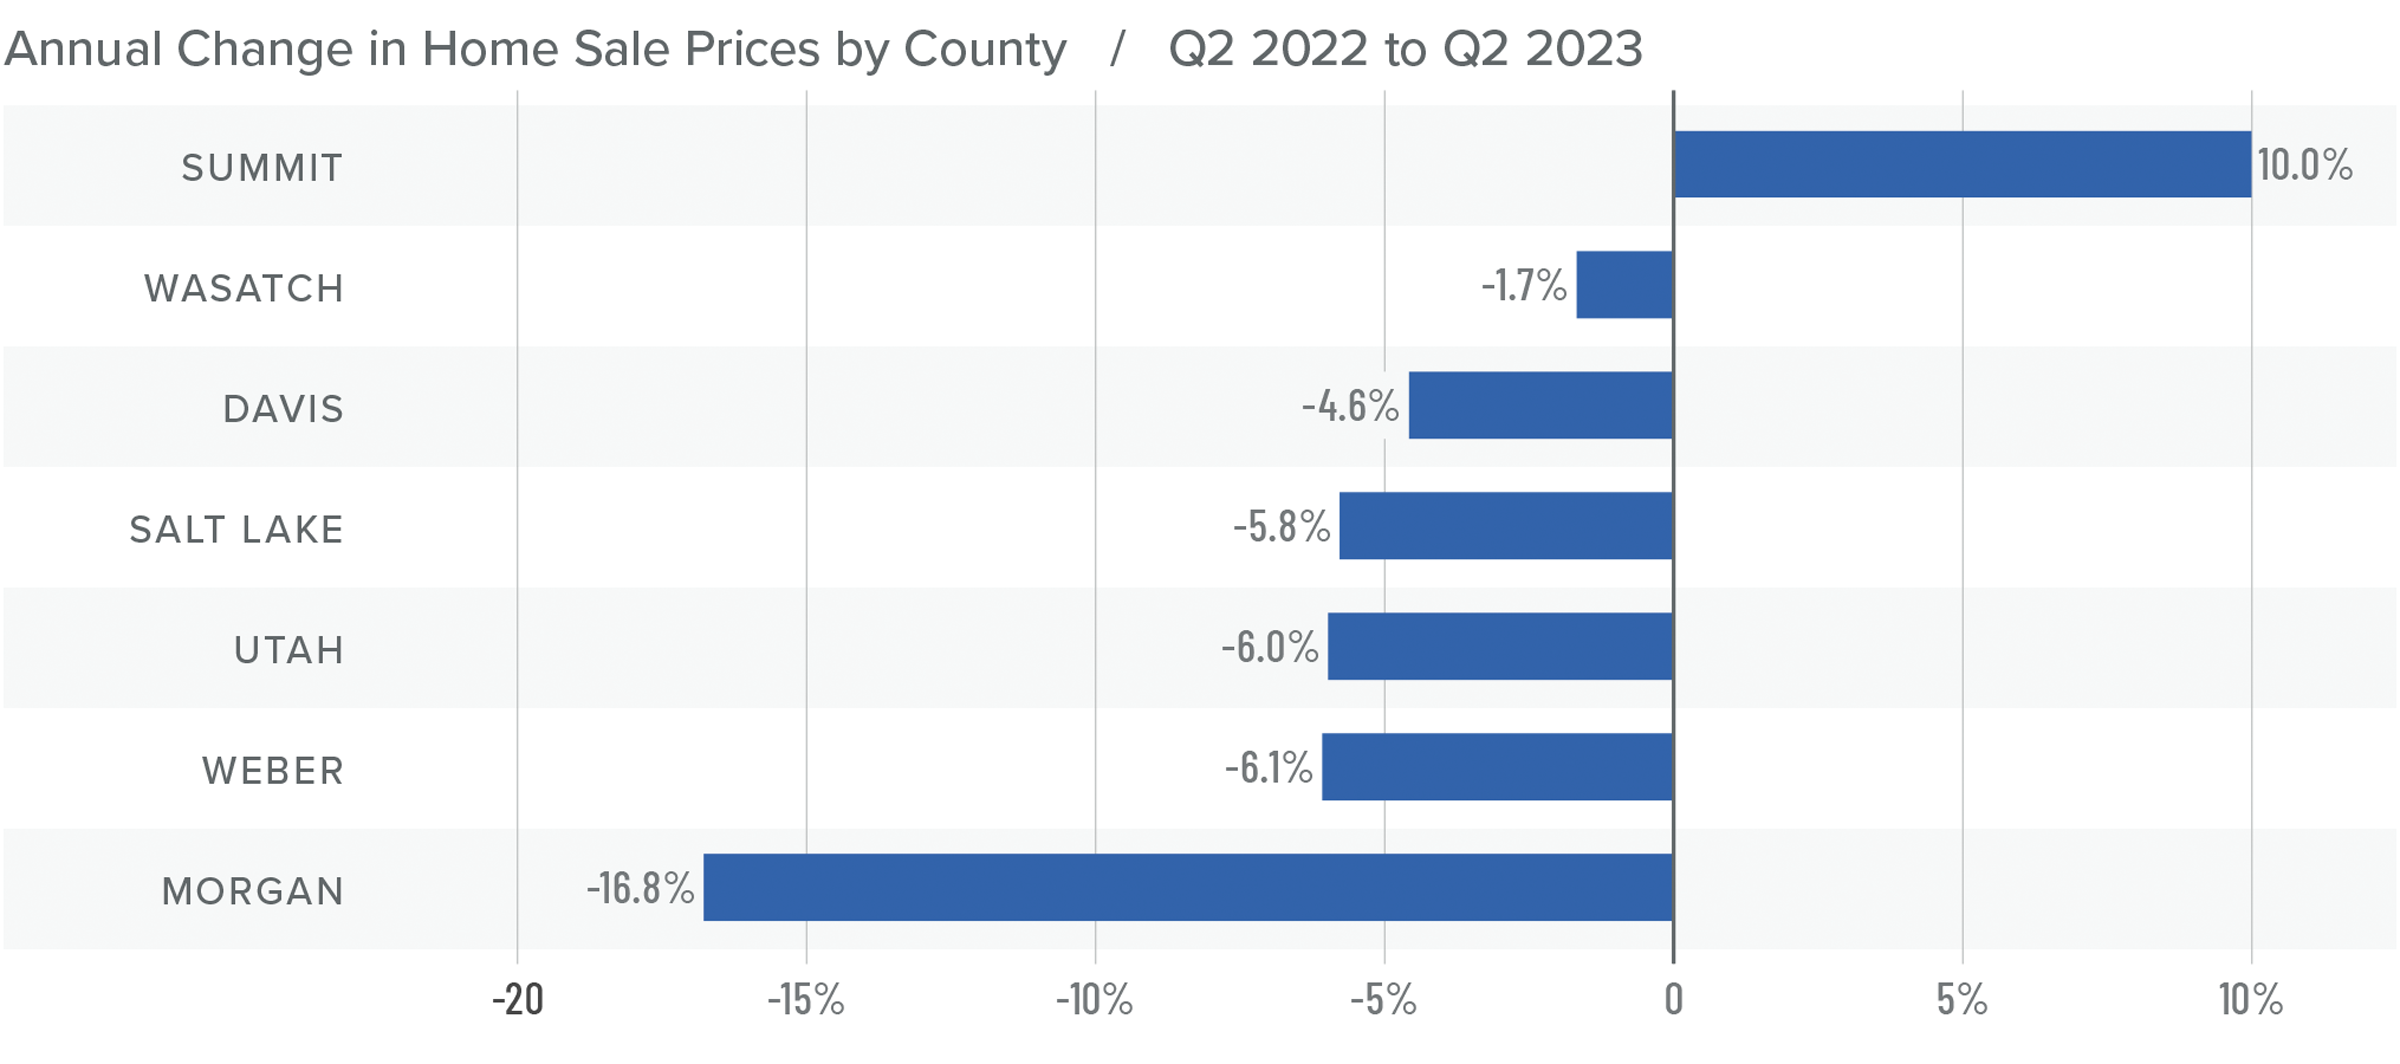
Utah Home Prices
❱ The average sale price in the quarter fell 5.4% from the second quarter of 2022 to $629,289. However, sale prices were 4.1% higher than in the first quarter of 2023.
❱ Median list prices in the second quarter were 8.5% higher than in the first quarter of the year. It’s interesting to see sellers’ continued confidence given the significant increase in mortgage rates the market has experienced.
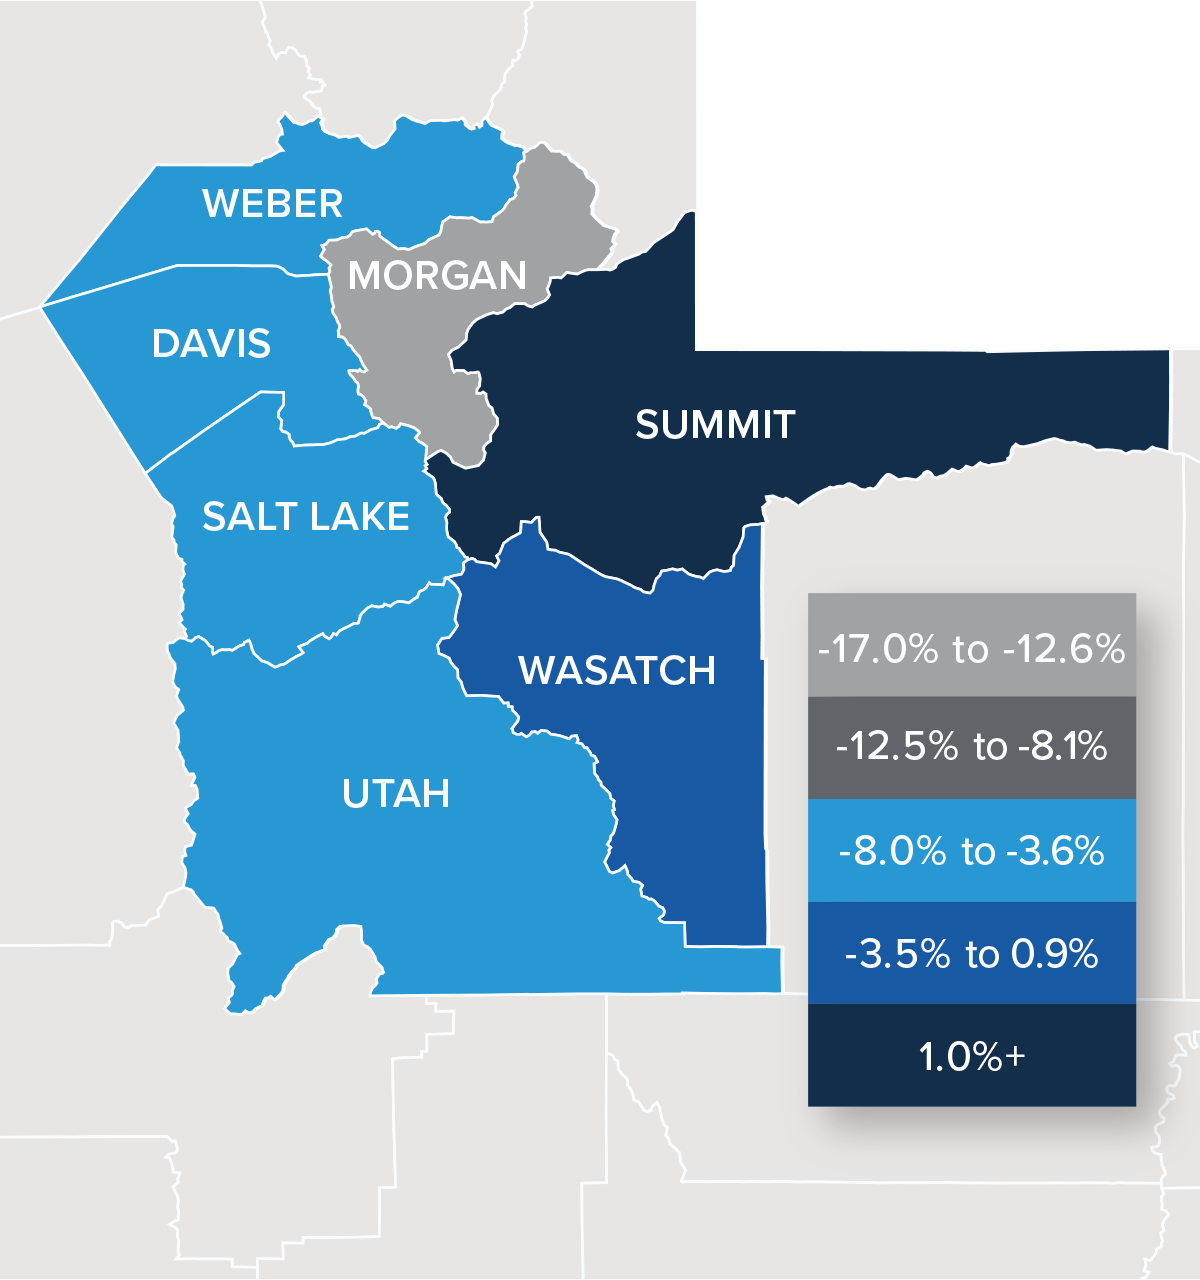
❱ Year over year, prices rose in Summit County but dropped in the other markets. Compared to the first quarter, prices rose in every county other than Wasatch, where they fell 12.7%.
❱ It was notable that the markets that saw list prices rising were in the more affordable areas. Expensive counties, such as Morgan, Summit, and Wasatch, all had lower median list prices than in the first quarter of this year.
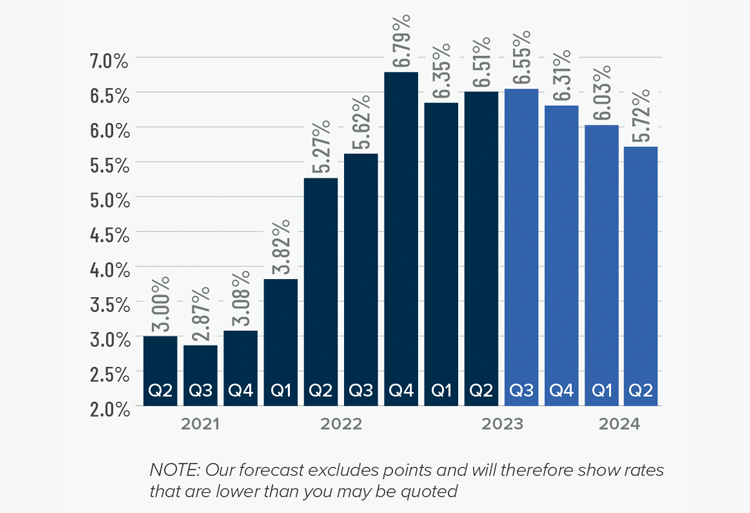
Mortgage Rates
Although they were less erratic than the first quarter, mortgage rates unfortunately trended higher and ended the quarter above 7%. This was due to the short debt ceiling impasse, as well as several economic datasets that suggested the U.S. economy was not slowing at the speed required by the Federal Reserve.
While the June employment report showed fewer jobs created than earlier in the year, as well as downward revisions to prior gains, inflation has not sufficiently slowed. Until it does, rates cannot start to trend consistently lower. With the economy not slowing as fast as expected, I have adjusted my forecast: Rates will hold at current levels in third quarter and then start to trend lower through the fall. Although there are sure to be occasional spikes, my model now shows the 30-year fixed rate breaking below 6% next spring.
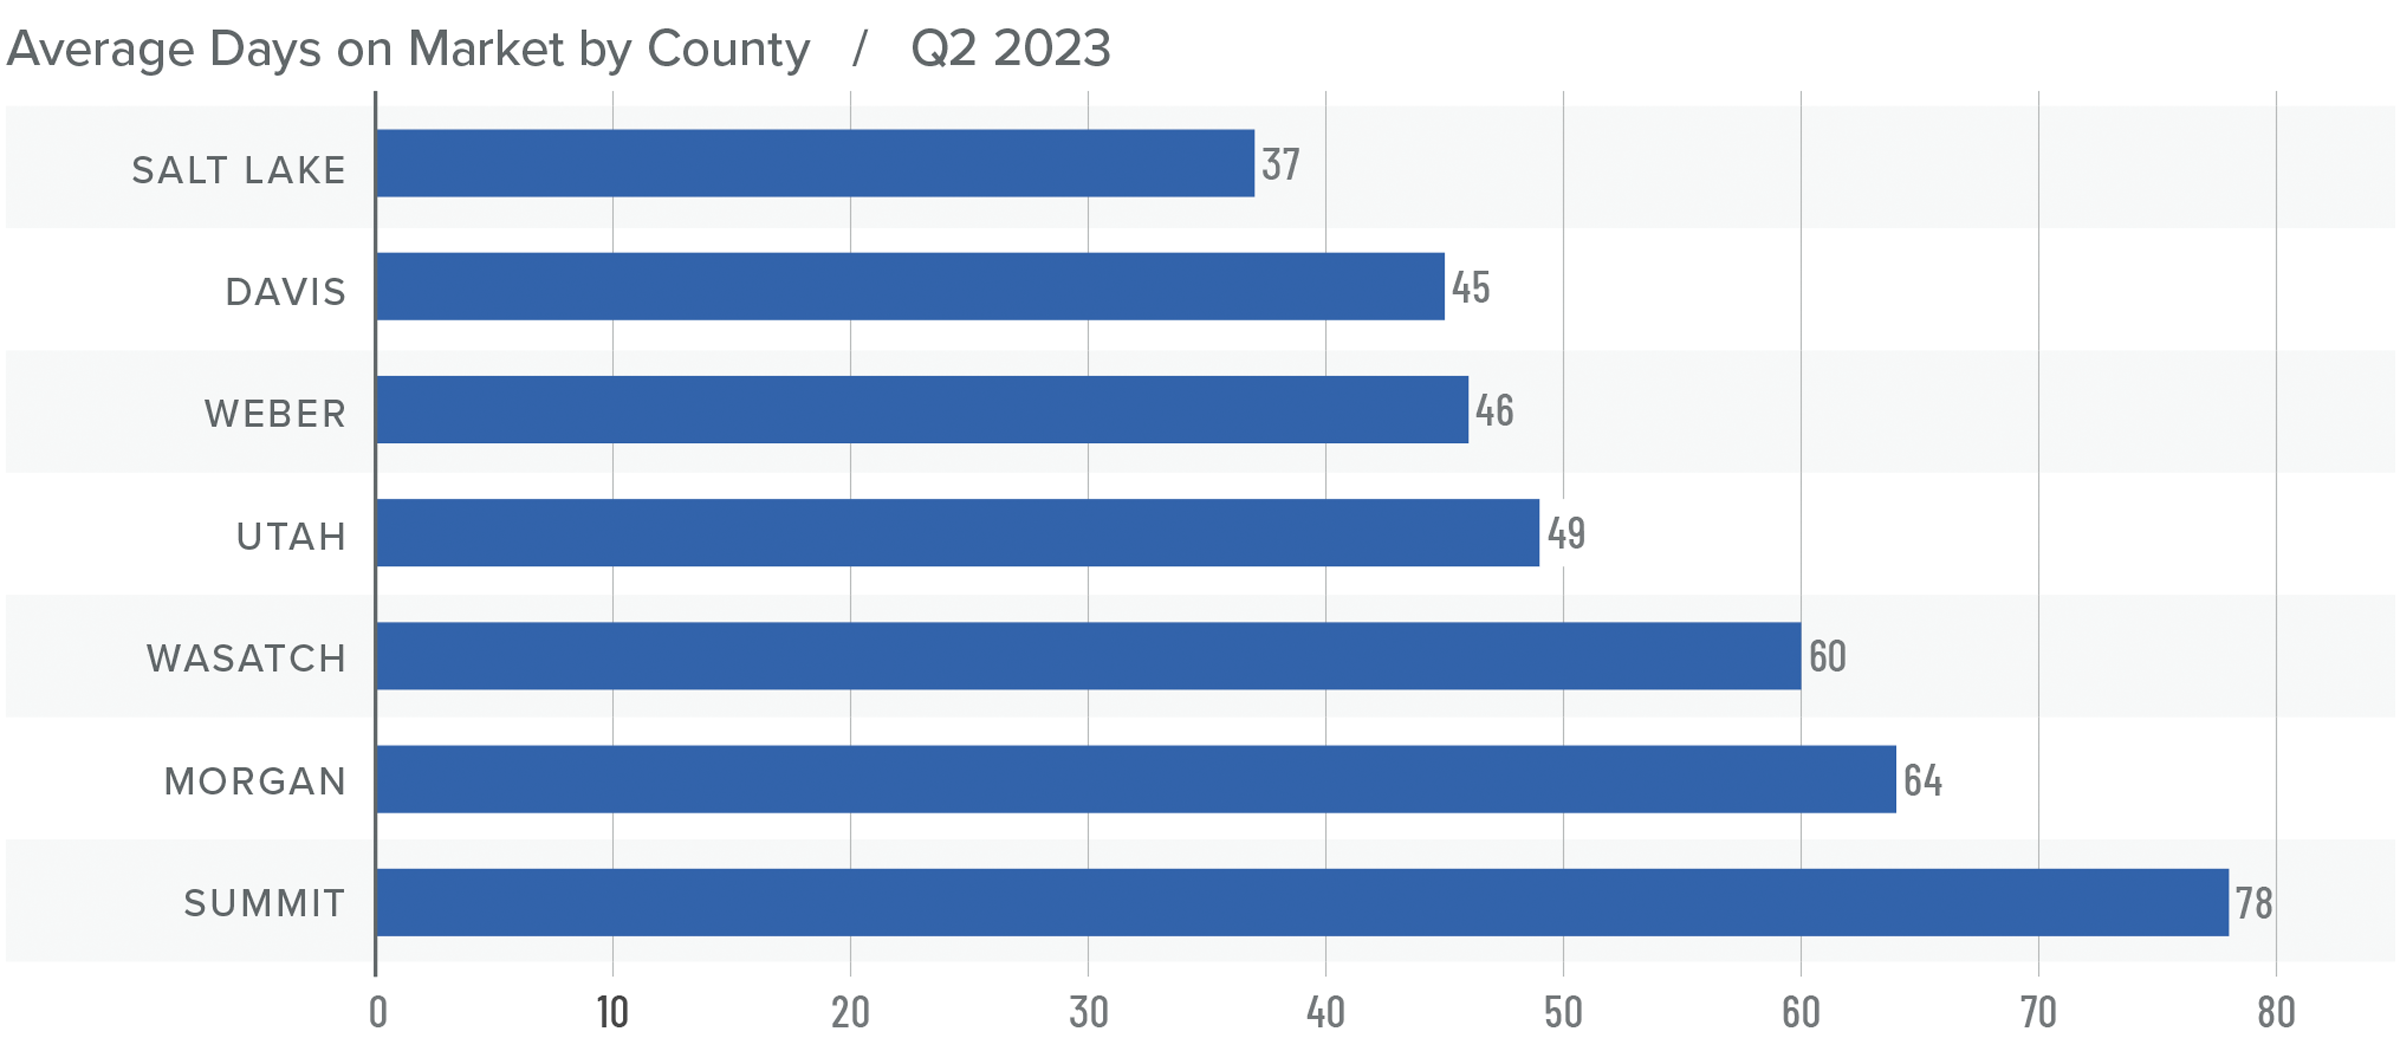
Utah Days on Market
❱ The average time it took to sell a home in the counties covered by this report rose 36 days compared to the same period a year ago.
❱ Homes sold fastest in Salt Lake County and slowest in Summit County. All areas saw average market time rise compared to the second quarter of 2022, but market time fell in all areas compared to the first quarter of this year.
❱ During the second quarter, it took an average of 54 days to sell a home. Market time fell 13 days compared to the first quarter of 2023.
❱ It was impressive to see the length of time it took to sell a home in the region fall significantly despite more inventory and higher financing costs.
Conclusions
This speedometer reflects the state of the region’s real estate market using housing inventory, price gains, home sales, interest rates, and larger economic factors.
In the first quarter Gardner Report, I suggested that the region was “very close to bottoming out” in respect to price. It appears I underestimated the resilience of Utah’s housing market. Given all the data presented here, the only thing that favors buyers is that there are more homes for sale. That said, while inventory levels have risen, they remain remarkably low by historic standards. This doesn’t come as a surprise given that 87.6% of all homeowners with a mortgage have rates below 5% and 31.6% have rates at or below 3%. If they don’t have to sell, why would they?
This will keep inventory tight. The only question that remains is how long the market can tolerate high mortgage rates and decreasing affordability. Given all the above factors, I have moved the needle a little more in favor of sellers. I can’t go so far as to suggest that sellers are in a totally dominant position, but they still have the upper hand.
About Matthew Gardner
As Chief Economist for Windermere Real Estate, Matthew Gardner is responsible for analyzing and interpreting economic data and its impact on the real estate market on both a local and national level. Matthew has over 30 years of professional experience both in the U.S. and U.K.
In addition to his day-to-day responsibilities, Matthew sits on the Washington State Governors Council of Economic Advisors; chairs the Board of Trustees at the Washington Center for Real Estate Research at the University of Washington; and is an Advisory Board Member at the Runstad Center for Real Estate Studies at the University of Washington where he also lectures in real estate economics.
Q2 2023 Montana Real Estate Market Update

The following analysis of select counties of the Montana real estate market is provided by Windermere Real Estate Chief Economist Matthew Gardner. We hope that this information may assist you with making better-informed real estate decisions. For further information about the housing market in your area, please don’t hesitate to contact your Windermere Real Estate agent.
Regional Economic Overview
Year over year, Montana added 7,100 jobs. This represents an annual growth rate of 1.4%, which is the slowest pace of growth the state has seen since pandemic influences started to come into play. Regionally, there were significant variations: Employment fell .7% in Billings while it rose 3.4% in Missoula. Montana’s unemployment rate in May was 2.3%, which was down from 2.6% during the same period in 2022 and may explain slowing job growth. The state has a significant labor shortage. In the metro areas covered in this report, the lowest jobless rate was in Billings at 2.2%, followed by Missoula at 2.3%, and Great Falls at 2.4%.
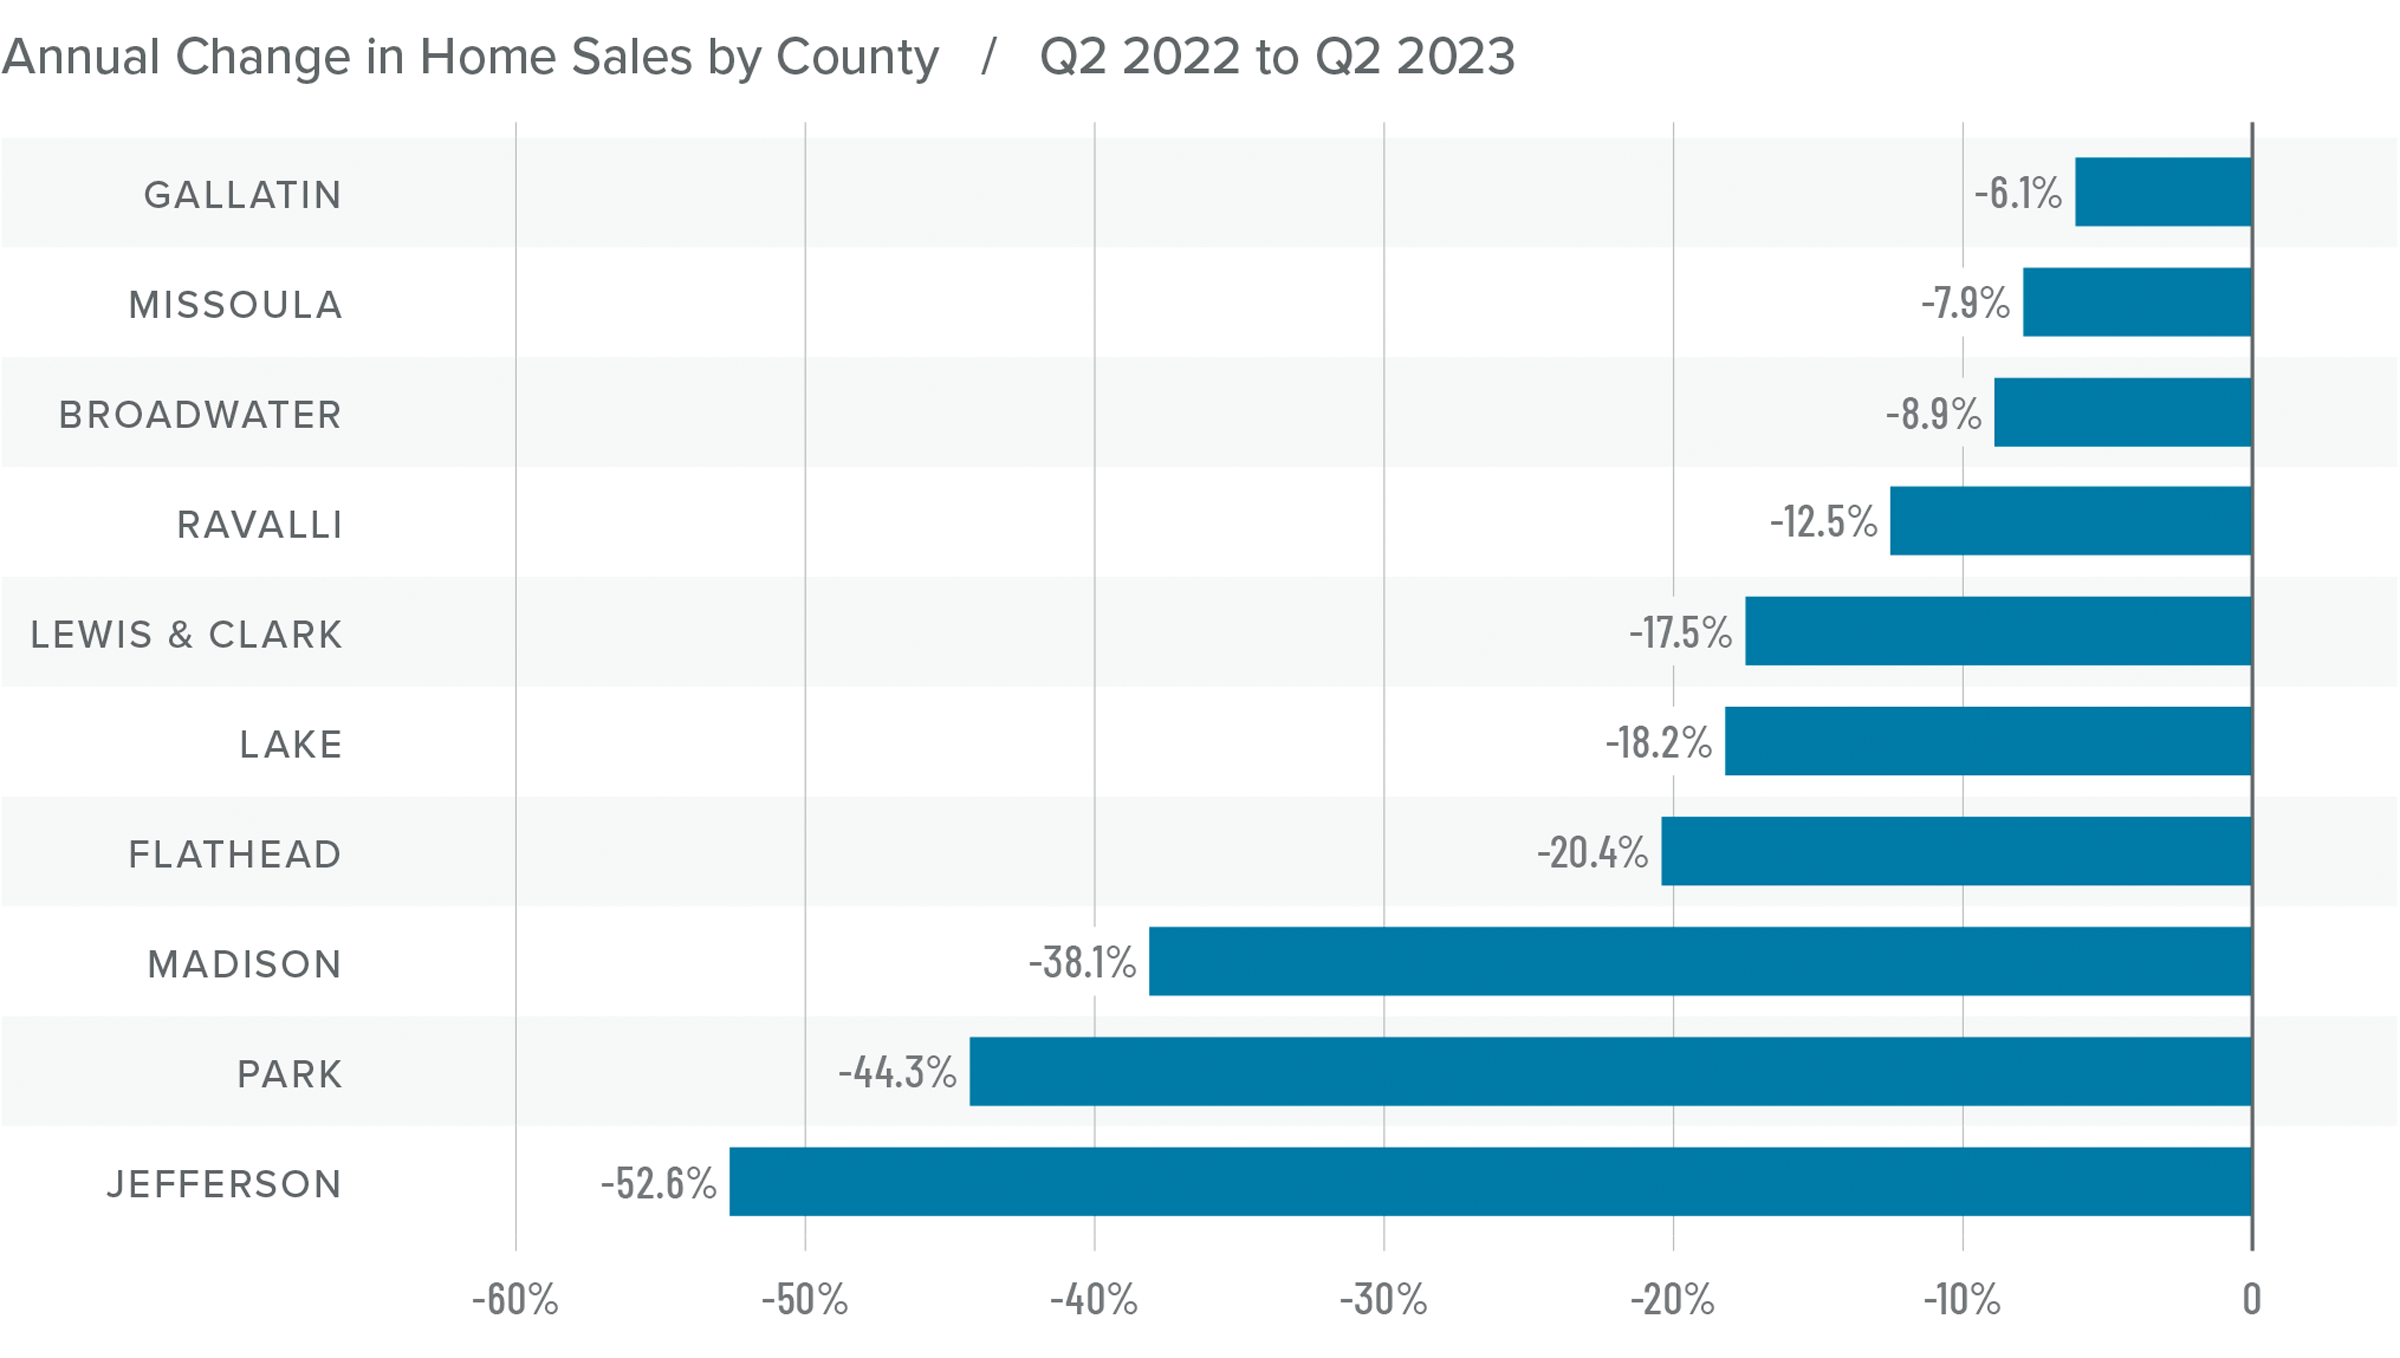
Montana Home Sales
❱ In the first quarter of 2023, 1,518 homes sold in the counties covered by this report. This represents a 16.1% decline from the second quarter of 2022 but an increase of 58.6% compared to the first quarter of 2023.
❱ Listing activity was 24.8% higher than in the second quarter of 2022 and 17.1% higher than in the first quarter of this year.
❱ Sales fell across the board from the second quarter of 2022. Compared to the first quarter of this year, sales were up in every county other than Jefferson, which is prone to significant swings given that very few homes sell there.
❱ Pending sales rose 15.4% quarter over quarter, suggesting that closings in the third quarter could show additional improvement.
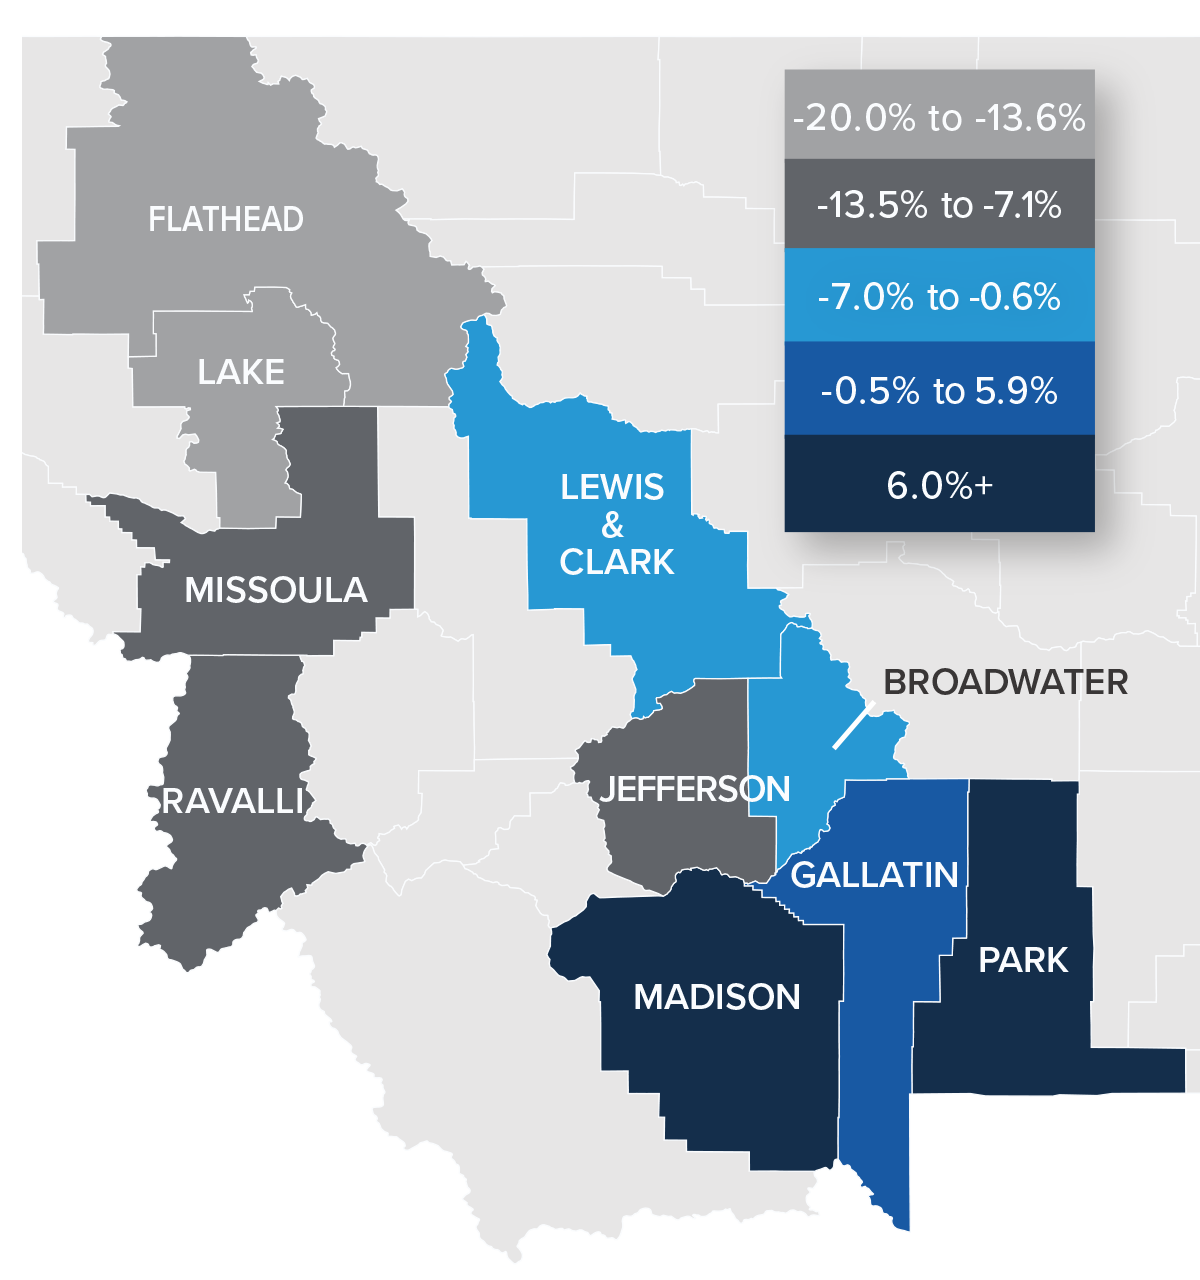
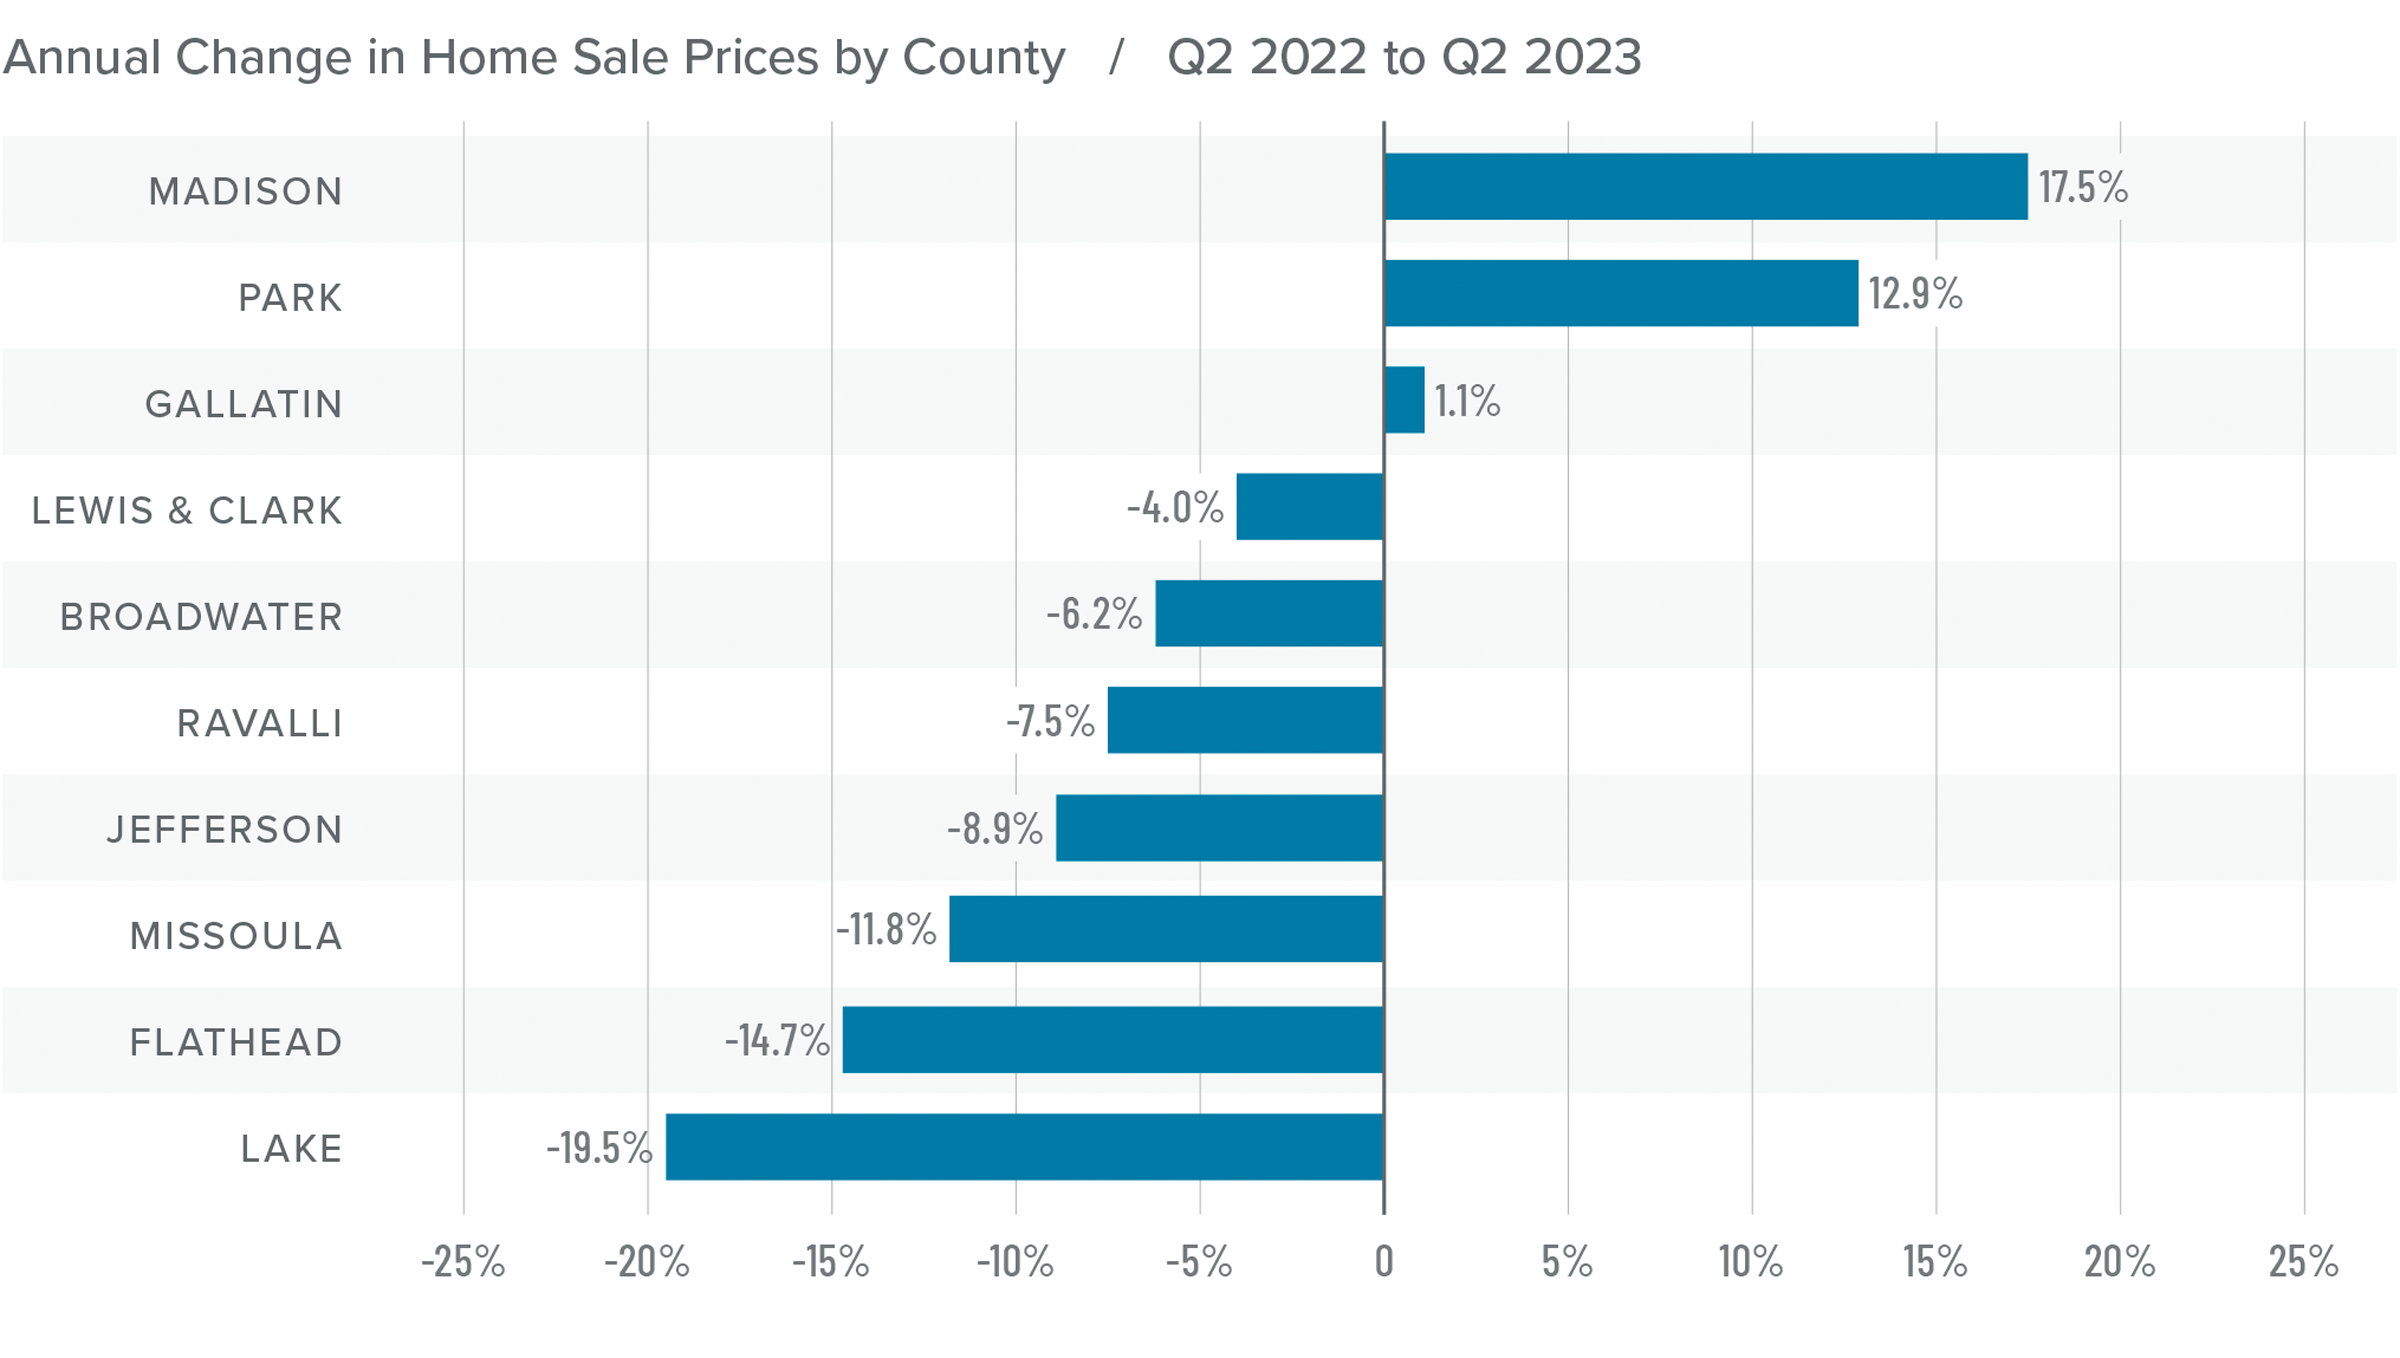
Montana Home Prices
❱ Home prices were down 5% year over year, with an average sale price of $760,428. The average home price rose .1% compared to the first quarter of 2022.
❱ I wasn’t surprised that home prices fell in most areas compared to the same period in 2022. A year ago home buyers were scrambling to buy before mortgage rates skyrocketed.
❱ Year over year, prices rose in three counties and fell in seven. Compared to the first quarter of this year, every county other than Lake, Lewis & Clark, and Flathead saw prices rise.
❱ Mortgage rates remain high, and it’s now likely they will remain higher for longer than anticipated. That will take some steam out of price growth in the second half of the year. This is also supported by lower median list prices than in the first quarter. Sellers seem to understand that higher borrowing costs are having an impact on buyers.
Mortgage Rates
Although they were less erratic than the first quarter, mortgage rates unfortunately trended higher and ended the quarter above 7%. This was due to the short debt ceiling impasse, as well as several economic datasets that suggested the U.S. economy was not slowing at the speed required by the Federal Reserve.
While the June employment report showed fewer jobs created than earlier in the year, as well as downward revisions to prior gains, inflation has not sufficiently slowed. Until it does, rates cannot start to trend consistently lower. With the economy not slowing as fast as expected, I have adjusted my forecast: Rates will hold at current levels in third quarter and then start to trend lower through the fall. Although there are sure to be occasional spikes, my model now shows the 30-year fixed rate breaking below 6% next spring.

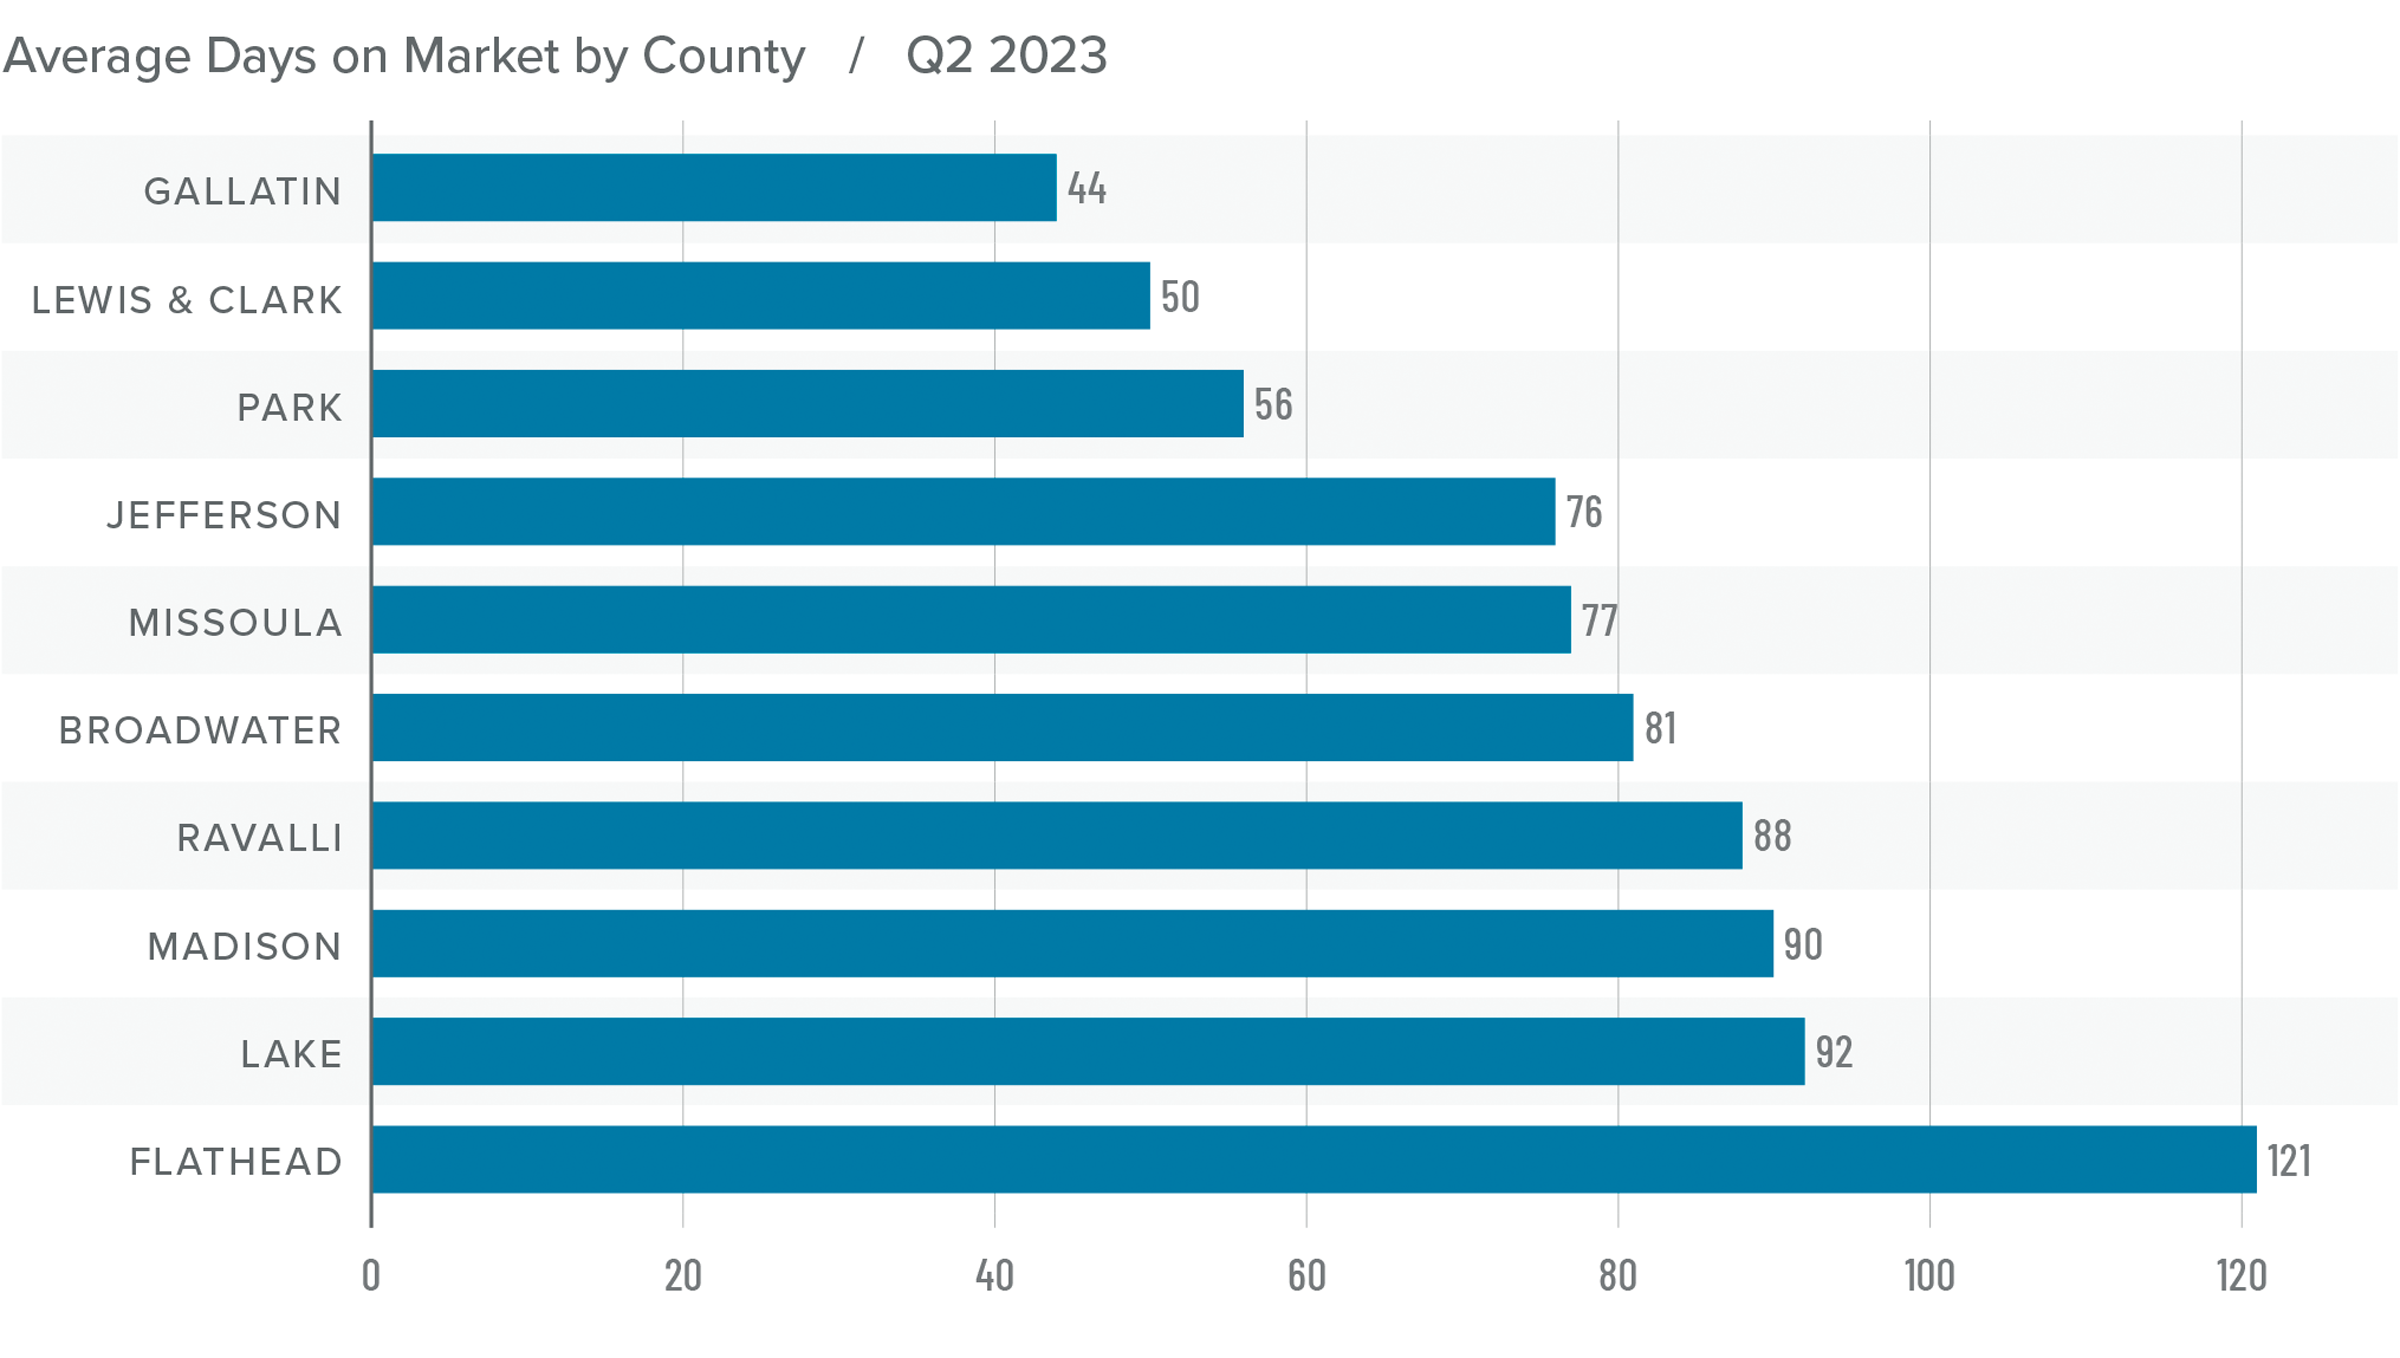
Montana Days on Market
❱ The average time it took to sell a home rose 26 days compared to the same period in 2022.
❱ Homes sold fastest in Gallatin County while homes in Flathead County took the longest time to sell. Only Lewis & Clark County saw market time fall compared to the second quarter of 2022. Average market time rose in the rest of the region.
❱ During the second quarter, it took an average of 77 days to sell a home in the markets covered by this report.
❱ Compared to the first quarter of 2023, days on market fell in all counties other than Jefferson, where it took 20 more days for homes to sell.
Conclusions
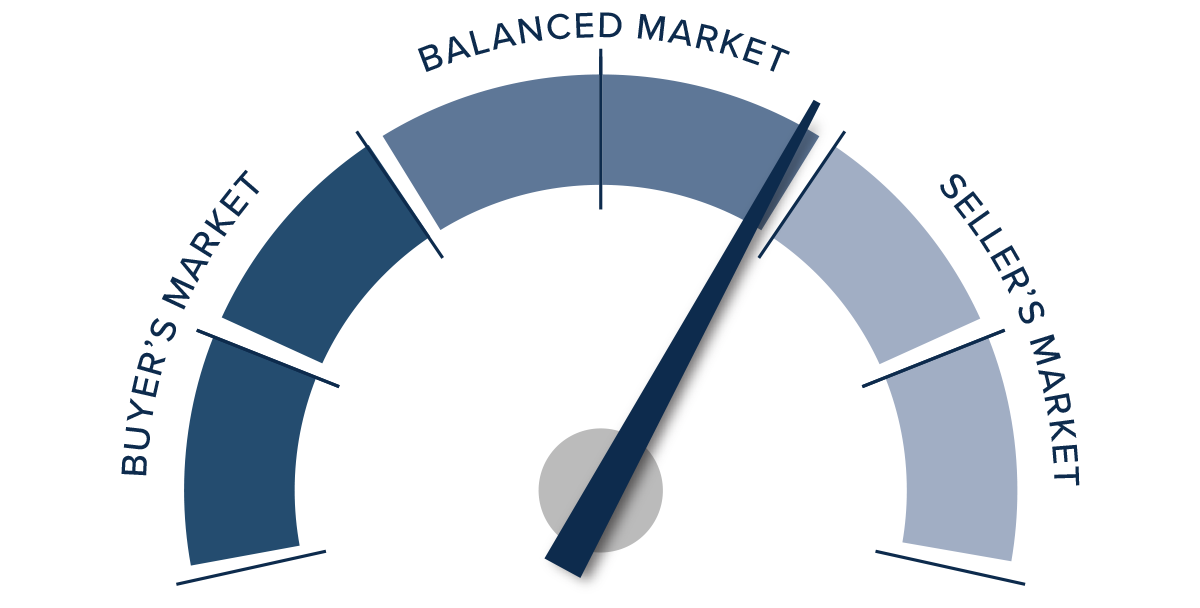
This speedometer reflects the state of the region’s real estate market using housing inventory, price gains, home sales, interest rates, and larger economic factors.
Market indicators are mixed right now. Sales activity increased and the length of time it took for homes to sell fell, which certainly should favor sellers. However, sales price growth was anemic, list prices are generally lower, and there is more inventory to choose from, which favors home buyers.
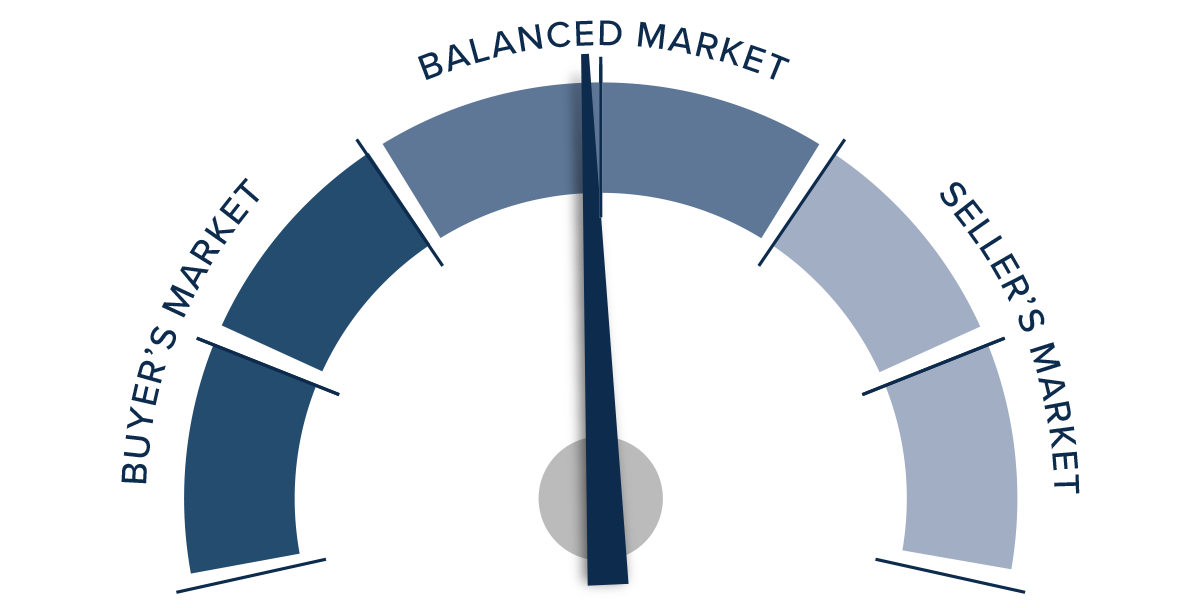
Having taken all these factors into consideration, I am leaving the needle inside the balanced quadrant. I am giving a bit of bias in favor of buyers, but the degree to which they have an advantage is minimal.
About Matthew Gardner
As Chief Economist for Windermere Real Estate, Matthew Gardner is responsible for analyzing and interpreting economic data and its impact on the real estate market on both a local and national level. Matthew has over 30 years of professional experience both in the U.S. and U.K.
In addition to his day-to-day responsibilities, Matthew sits on the Washington State Governors Council of Economic Advisors; chairs the Board of Trustees at the Washington Center for Real Estate Research at the University of Washington; and is an Advisory Board Member at the Runstad Center for Real Estate Studies at the University of Washington where he also lectures in real estate economics.
Q2 2023 Idaho Real Estate Market Update

The following analysis of select counties of the Idaho real estate market is provided by Windermere Real Estate Chief Economist Matthew Gardner. We hope that this information may assist you with making better-informed real estate decisions. For further information about the housing market in your area, please don’t hesitate to contact your Windermere Real Estate agent.
Regional Economic Overview
Idaho’s annual pace of employment growth has started to slow. However, the addition of 25,400 new jobs over the past year represented an impressive 3.1% growth rate. All of Idaho’s metro areas except Lewiston saw solid year-over-year nonfarm job gains. Coeur d’Alene had the greatest increase at 3.9%, followed by Pocatello (+3.6%), Boise (+3.4%), Idaho Falls (3.2%), and Twin Falls (2%). Lewiston saw a very modest decline of 200 jobs, or .2%. The state unemployment rate was a healthy 2.6%, marginally above the 2.5% we saw at this time in 2022, but still the 13th lowest rate in the nation. The lowest regional jobless rate was in Lewiston and Idaho Falls at 2.6%. Boise’s rate was 2.8% and the highest rate was in Coeur d’Alene at 3.3%. Jobs continue to be added across the state. Even if the pace has cooled slightly, the economy appears to be solid. Although I expect the pace of job growth to continue to cool, I do not anticipate jobs to be shed this year, even as the national economy slows.
Idaho Home Sales
❱ In the second quarter of 2023, 5,069 homes sold, which was down 16.1% from the second quarter of 2022. Sales were up 20.8% from the first quarter of this year.
❱ Listing activity was marginally higher than in the second quarter of 2022, but jumped 24.6% from the first quarter of this year, which caused the pace of sales to rise significantly.
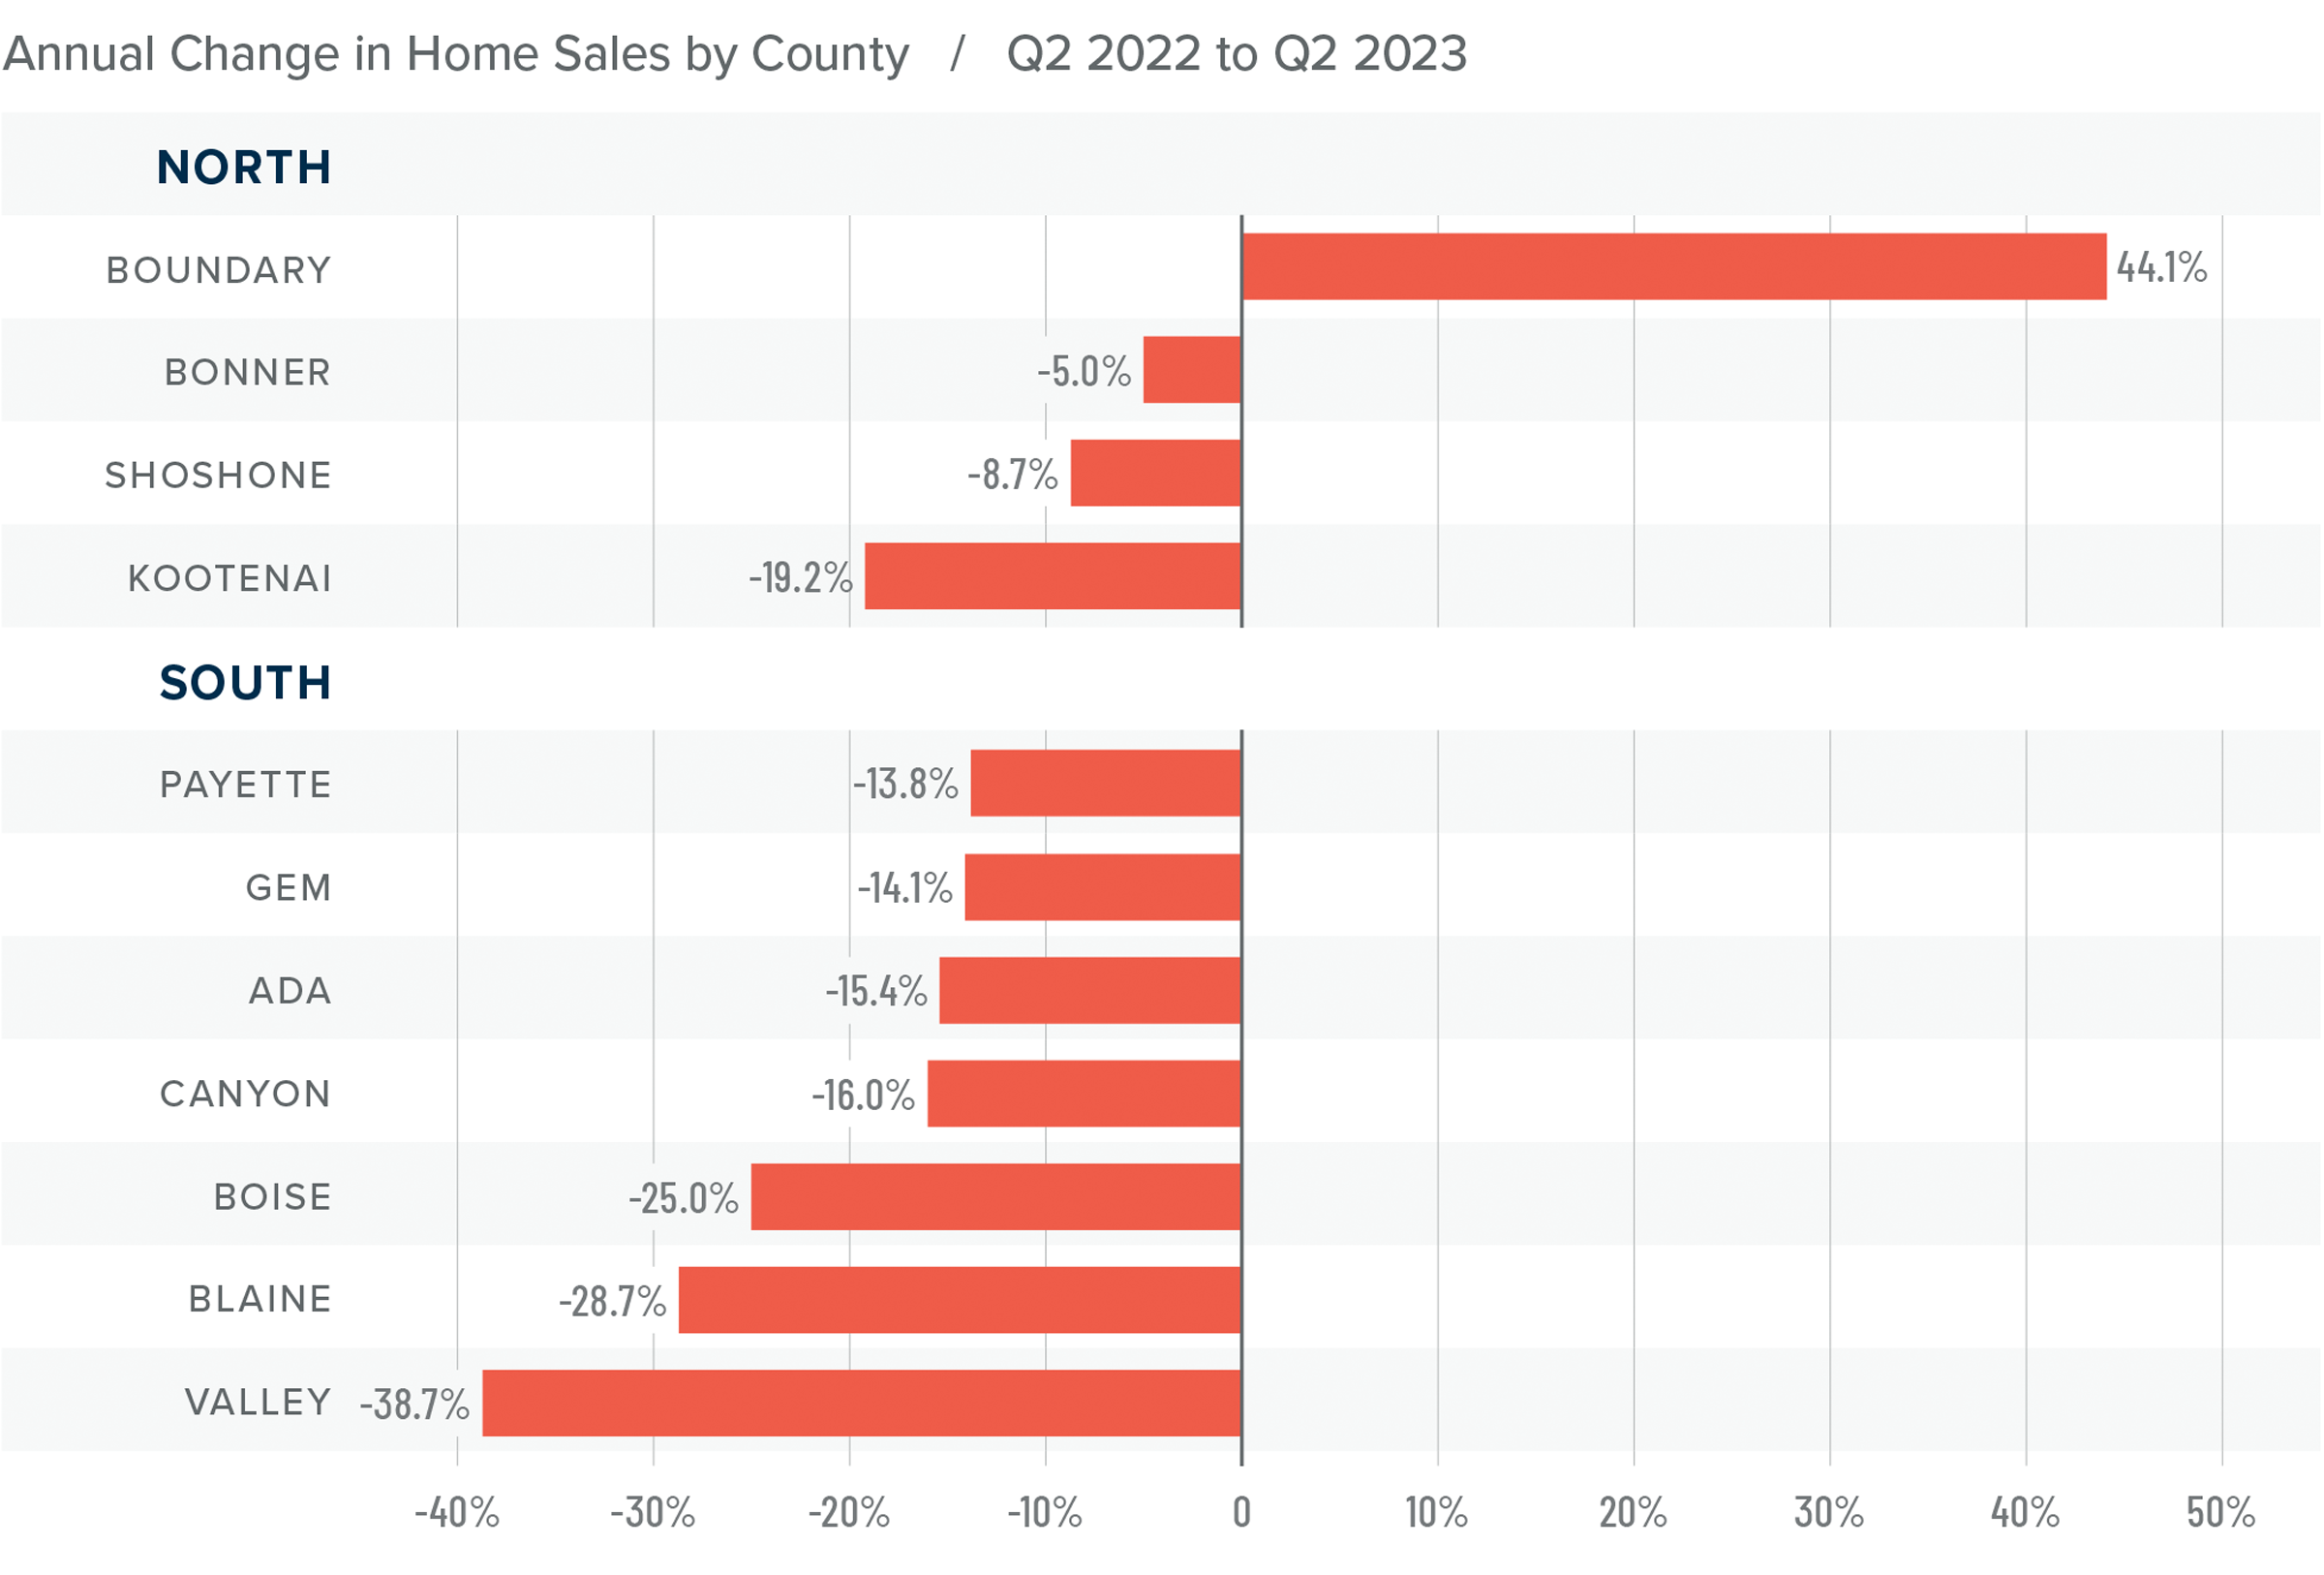
❱ Compared to the same period a year ago, sales fell in every market other than Boundary County, but this is a small market that can be prone to extreme swings. Compared to the first quarter of this year, sales rose in all markets other than Valley County, where they fell by a modest 2.1%.
❱ Pending sales were up 13% from the first quarter of the year, suggesting that sales may continue to rise in the upcoming quarter.
Idaho Home Prices
❱ The average home price in the region fell 7.9% year over year to $605,535. Sale prices were 5.7% higher than in the first quarter of 2023.
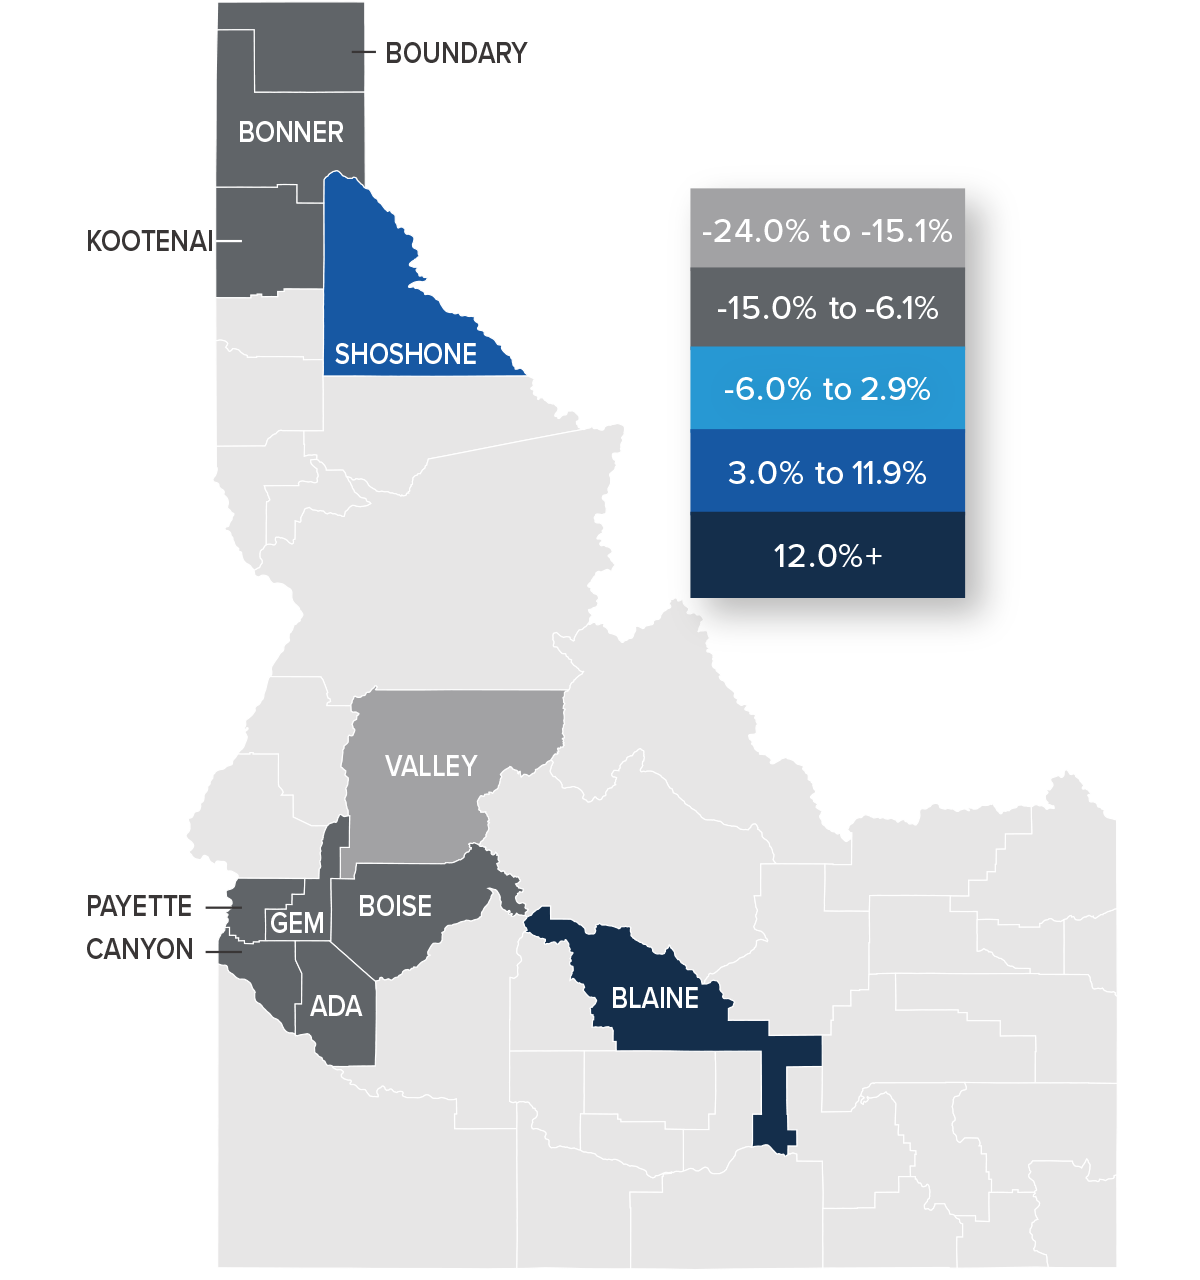
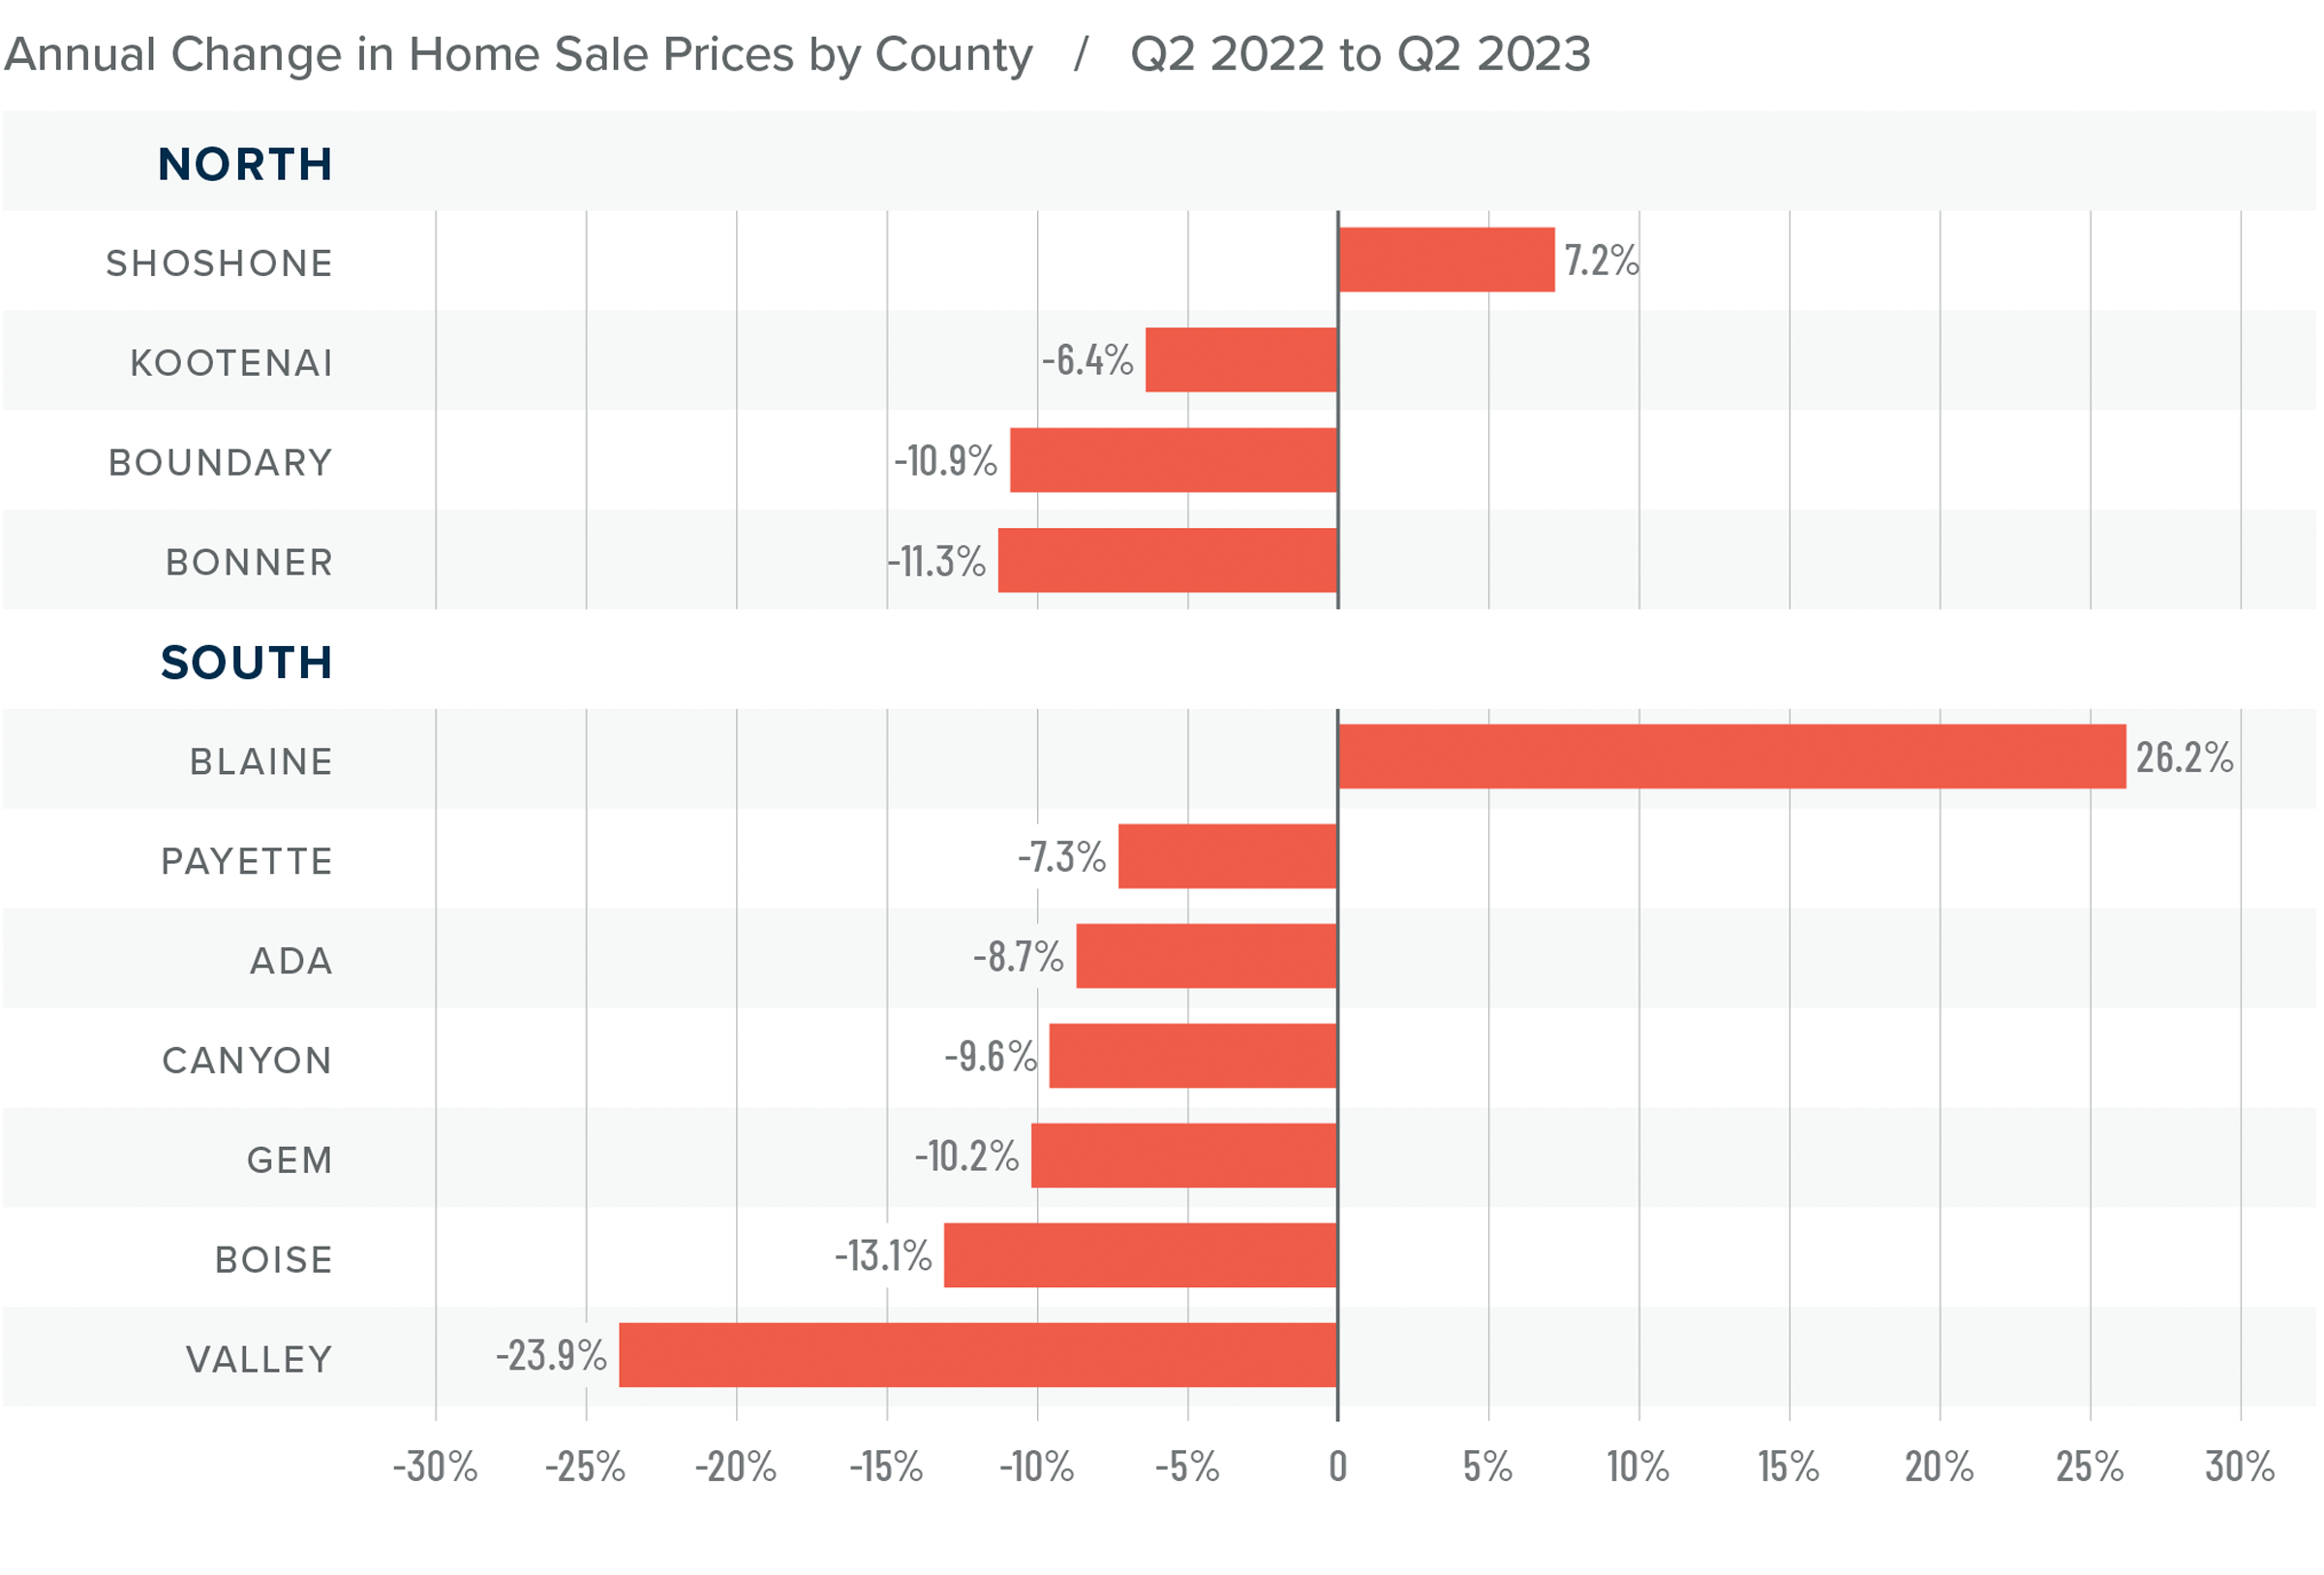
❱ Compared to the first quarter of this year, home prices rose in all the Northern Idaho market areas and rose in every market other than Gem and Valley counties in Southern Idaho.
❱ Only one county in each of the northern and southern market areas saw prices rise year over year, while the balance of the region had lower sale prices. Prices fell 8% in the south and 7.6% in the north compared to the second quarter of 2022.
❱ Median list prices in the second quarter were down 2.9% from the first quarter. This may have contributed to the increase in sales and prices, as sellers are likely being more cognizant of the higher financing costs buyers are facing.
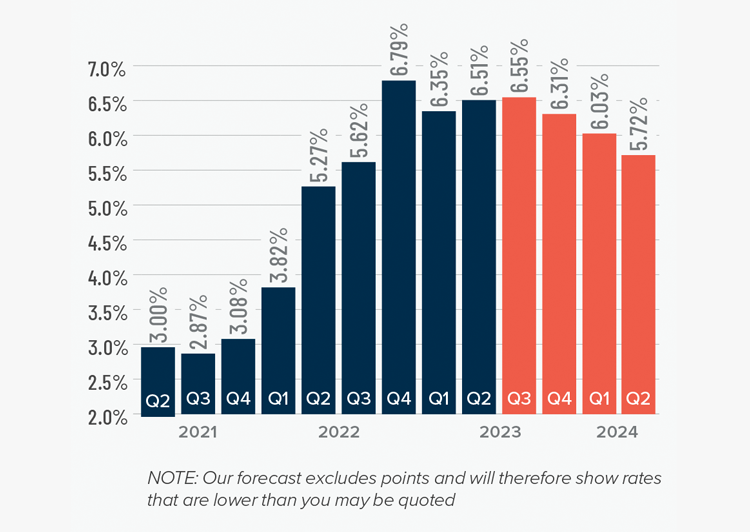
Mortgage Rates
Although they were less erratic than the first quarter, mortgage rates unfortunately trended higher and ended the quarter above 7%. This was due to the short debt ceiling impasse, as well as several economic datasets that suggested the U.S. economy was not slowing at the speed required by the Federal Reserve.
While the June employment report showed fewer jobs created than earlier in the year, as well as downward revisions to prior gains, inflation has not sufficiently slowed. Until it does, rates cannot start to trend consistently lower. With the economy not slowing as fast as expected, I have adjusted my forecast: Rates will hold at current levels in third quarter and then start to trend lower through the fall. Although there are sure to be occasional spikes, my model now shows the 30-year fixed rate breaking below 6% next spring.
Idaho Days on Market
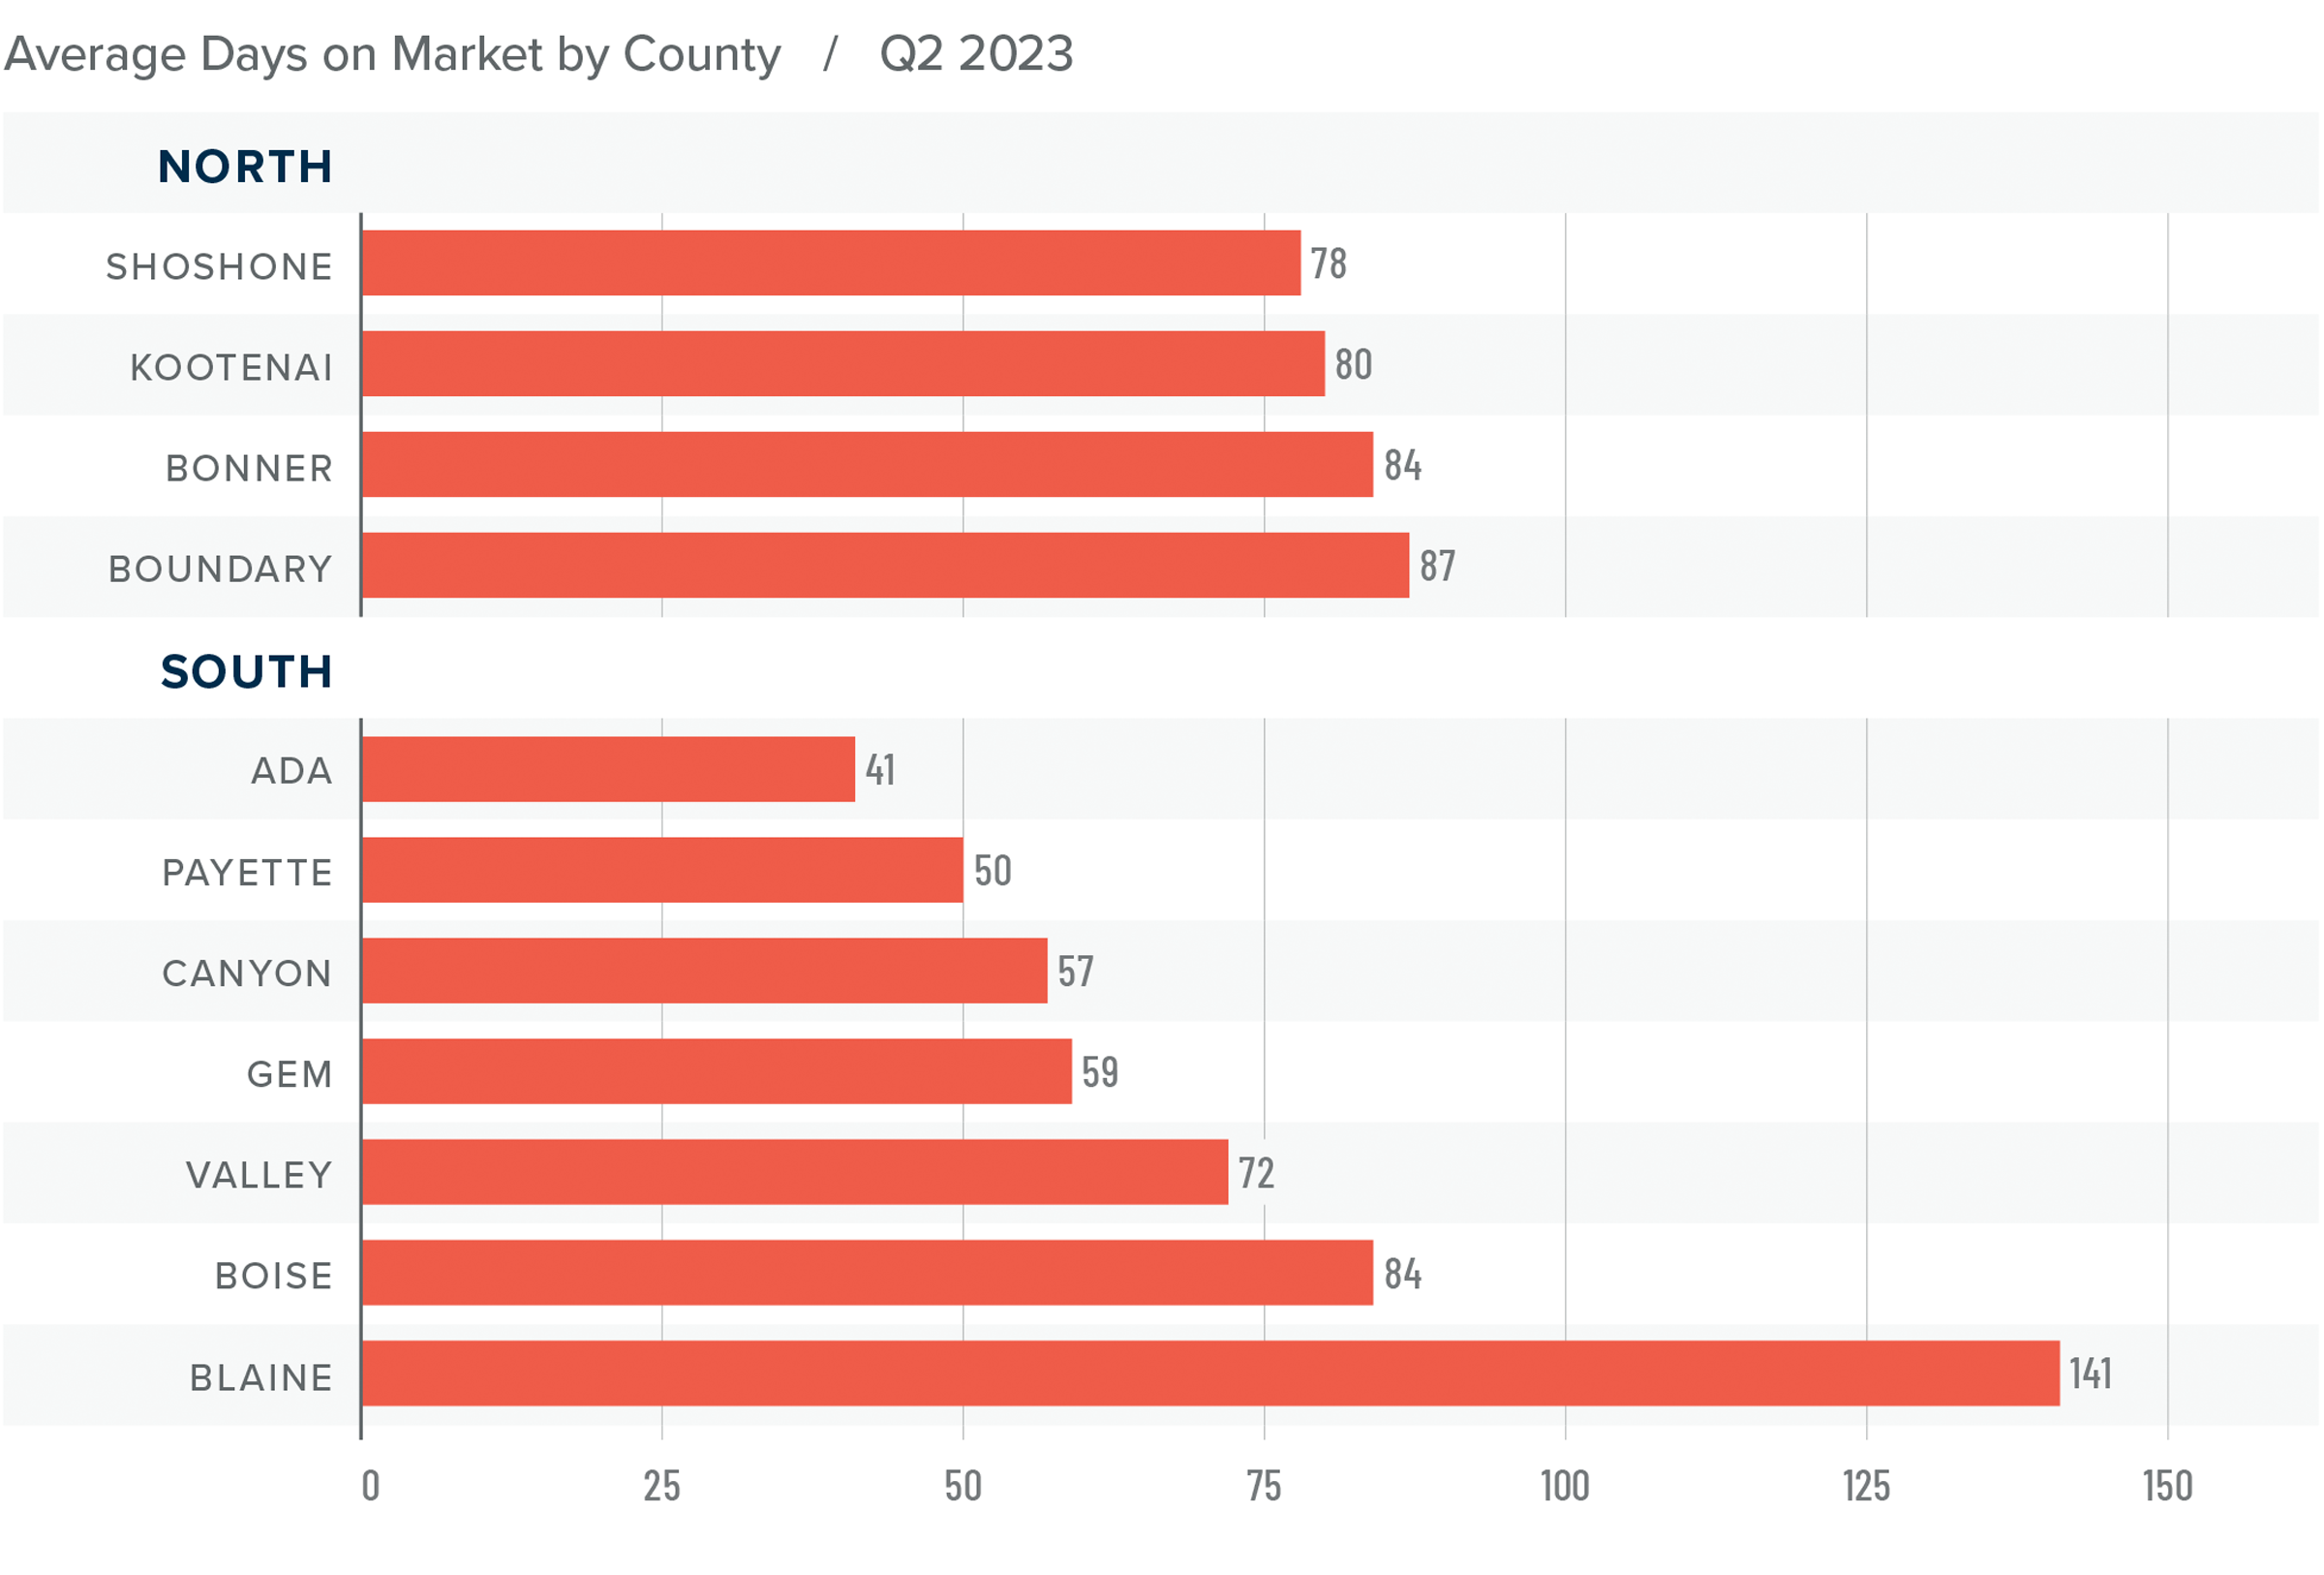
❱ The average time it took to sell a home in the region rose 27 days compared to the same quarter of 2022. It took an average of 20 fewer days to find a buyer than in the first quarter of this year.
❱ In all Northern and Southern Idaho counties, days on market rose compared to the same period in 2022. But compared to the first quarter of this year, market time fell in every county other than Valley.
❱ It took an average of 82 days to sell a home in Northern Idaho and 72 days in the southern counties covered by this report.
❱ Homes sold the fastest in Ada County in the southern part of the state and in Shoshone County in Northern Idaho.
Conclusions
This speedometer reflects the state of the region’s real estate market using housing inventory, price gains, home sales, interest rates, and larger economic factors.
The housing market performed well in the second quarter, even as mortgage rates rose. It will be interesting to see what impact the rate increases in June and July may have on sales activity in the third quarter. Though list prices have not fallen much, the share of homes on the market that have undergone price cuts has increased. This is likely in response to rising mortgage rates. Rising inventory levels favor buyers. If sellers are starting to acknowledge that buyers are being stretched given current mortgage rates, that too works in their favor. That said, higher sales activity and home prices, and lower days on the market all favor sellers.
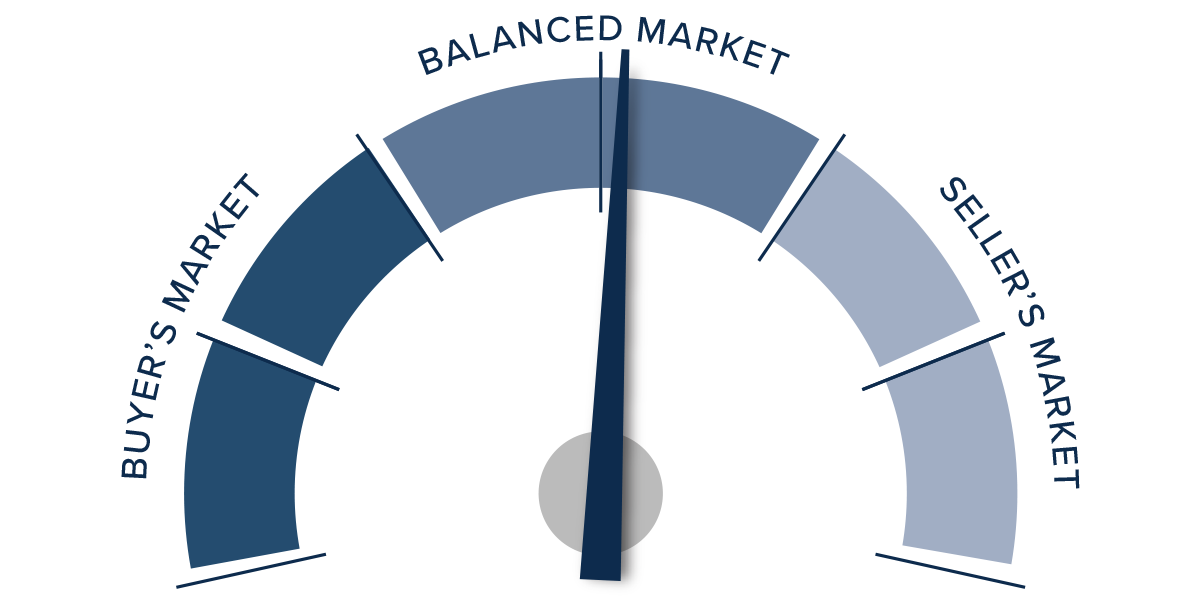
Since there are components of the market that favor both sides, I am leaving the needle in the balanced quadrant, albeit modestly favoring home sellers.
About Matthew Gardner
As Chief Economist for Windermere Real Estate, Matthew Gardner is responsible for analyzing and interpreting economic data and its impact on the real estate market on both a local and national level. Matthew has over 30 years of professional experience both in the U.S. and U.K.
In addition to his day-to-day responsibilities, Matthew sits on the Washington State Governors Council of Economic Advisors; chairs the Board of Trustees at the Washington Center for Real Estate Research at the University of Washington; and is an Advisory Board Member at the Runstad Center for Real Estate Studies at the University of Washington where he also lectures in real estate economics.
Q2 2023 Central Washington Real Estate Market Update

The following analysis of select counties of the Central Washington real estate market is provided by Windermere Real Estate Chief Economist Matthew Gardner. We hope that this information may assist you with making better-informed real estate decisions. For further information about the housing market in your area, please don’t hesitate to contact your Windermere Real Estate agent.
Regional Economic Overview
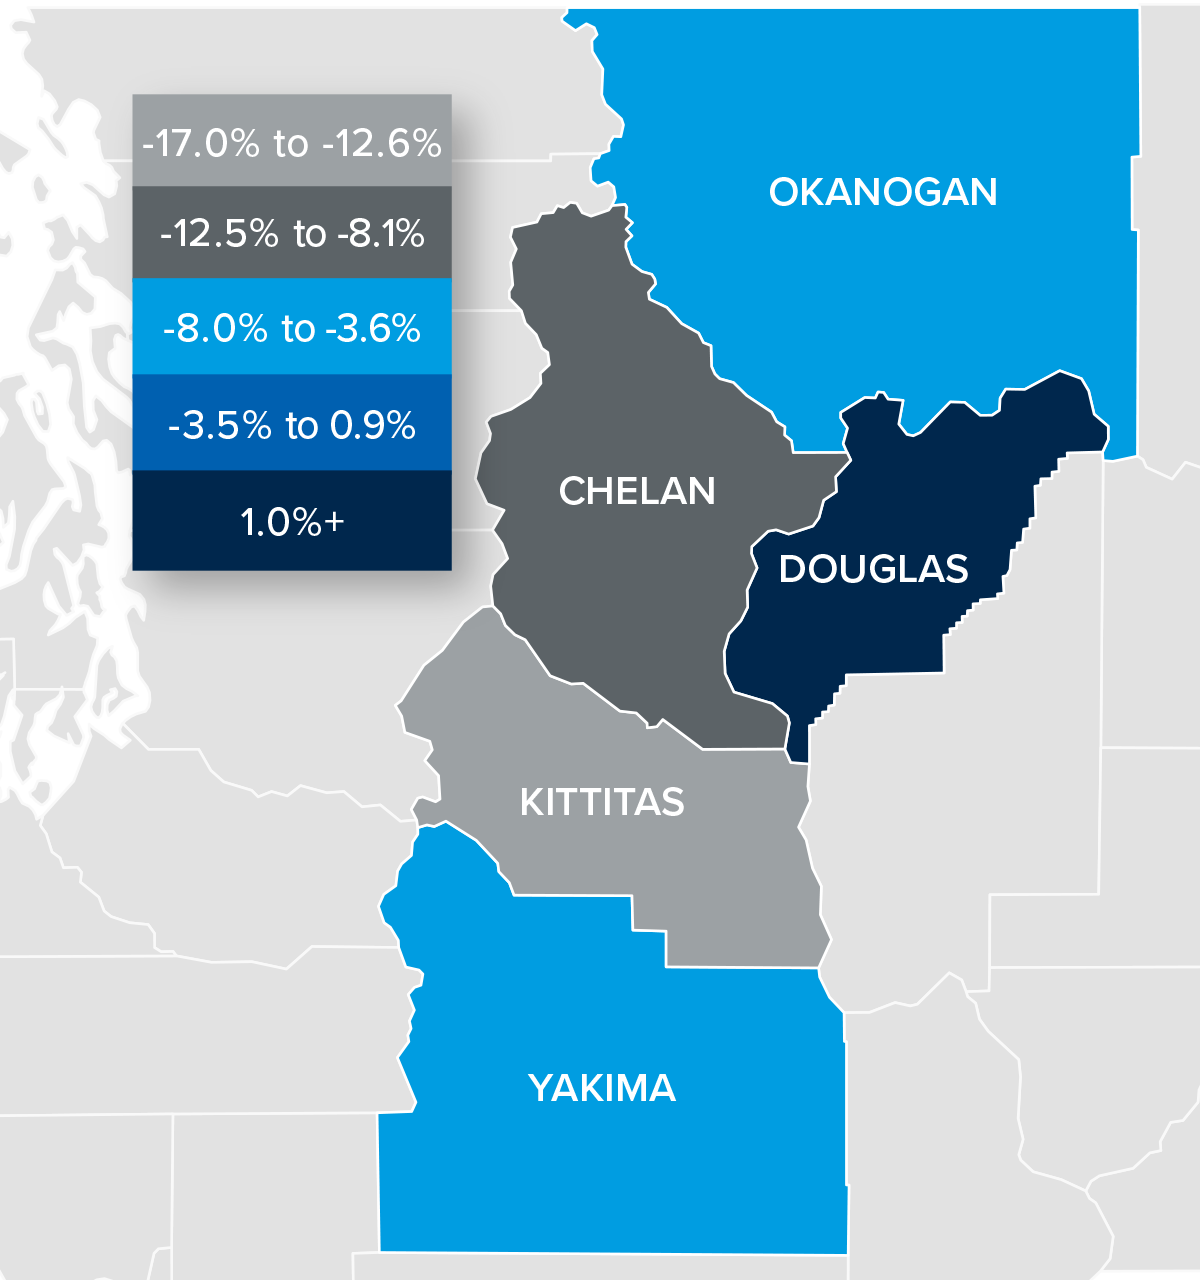
The Central Washington region added 4,449 jobs over the past 12 months, representing a decent 2.4% growth rate. At the county level, Chelan County had solid gains, with a growth rate of 5.5%. Douglas and Okanogan counties saw employment levels rise 3.1%, and Yakima County expanded its employment base by 1.4%. Only Kittitas County lost jobs year over year, with a reduction of 1.4%. The seasonally adjusted unemployment rate in Central Washington was 4.9%, down from 5.4% during the same quarter in 2022. The lowest unemployment rate was in Douglas County, where it was 3.2%. The region’s highest jobless rate was in Yakima County, where 6.3% of the labor force was without work.
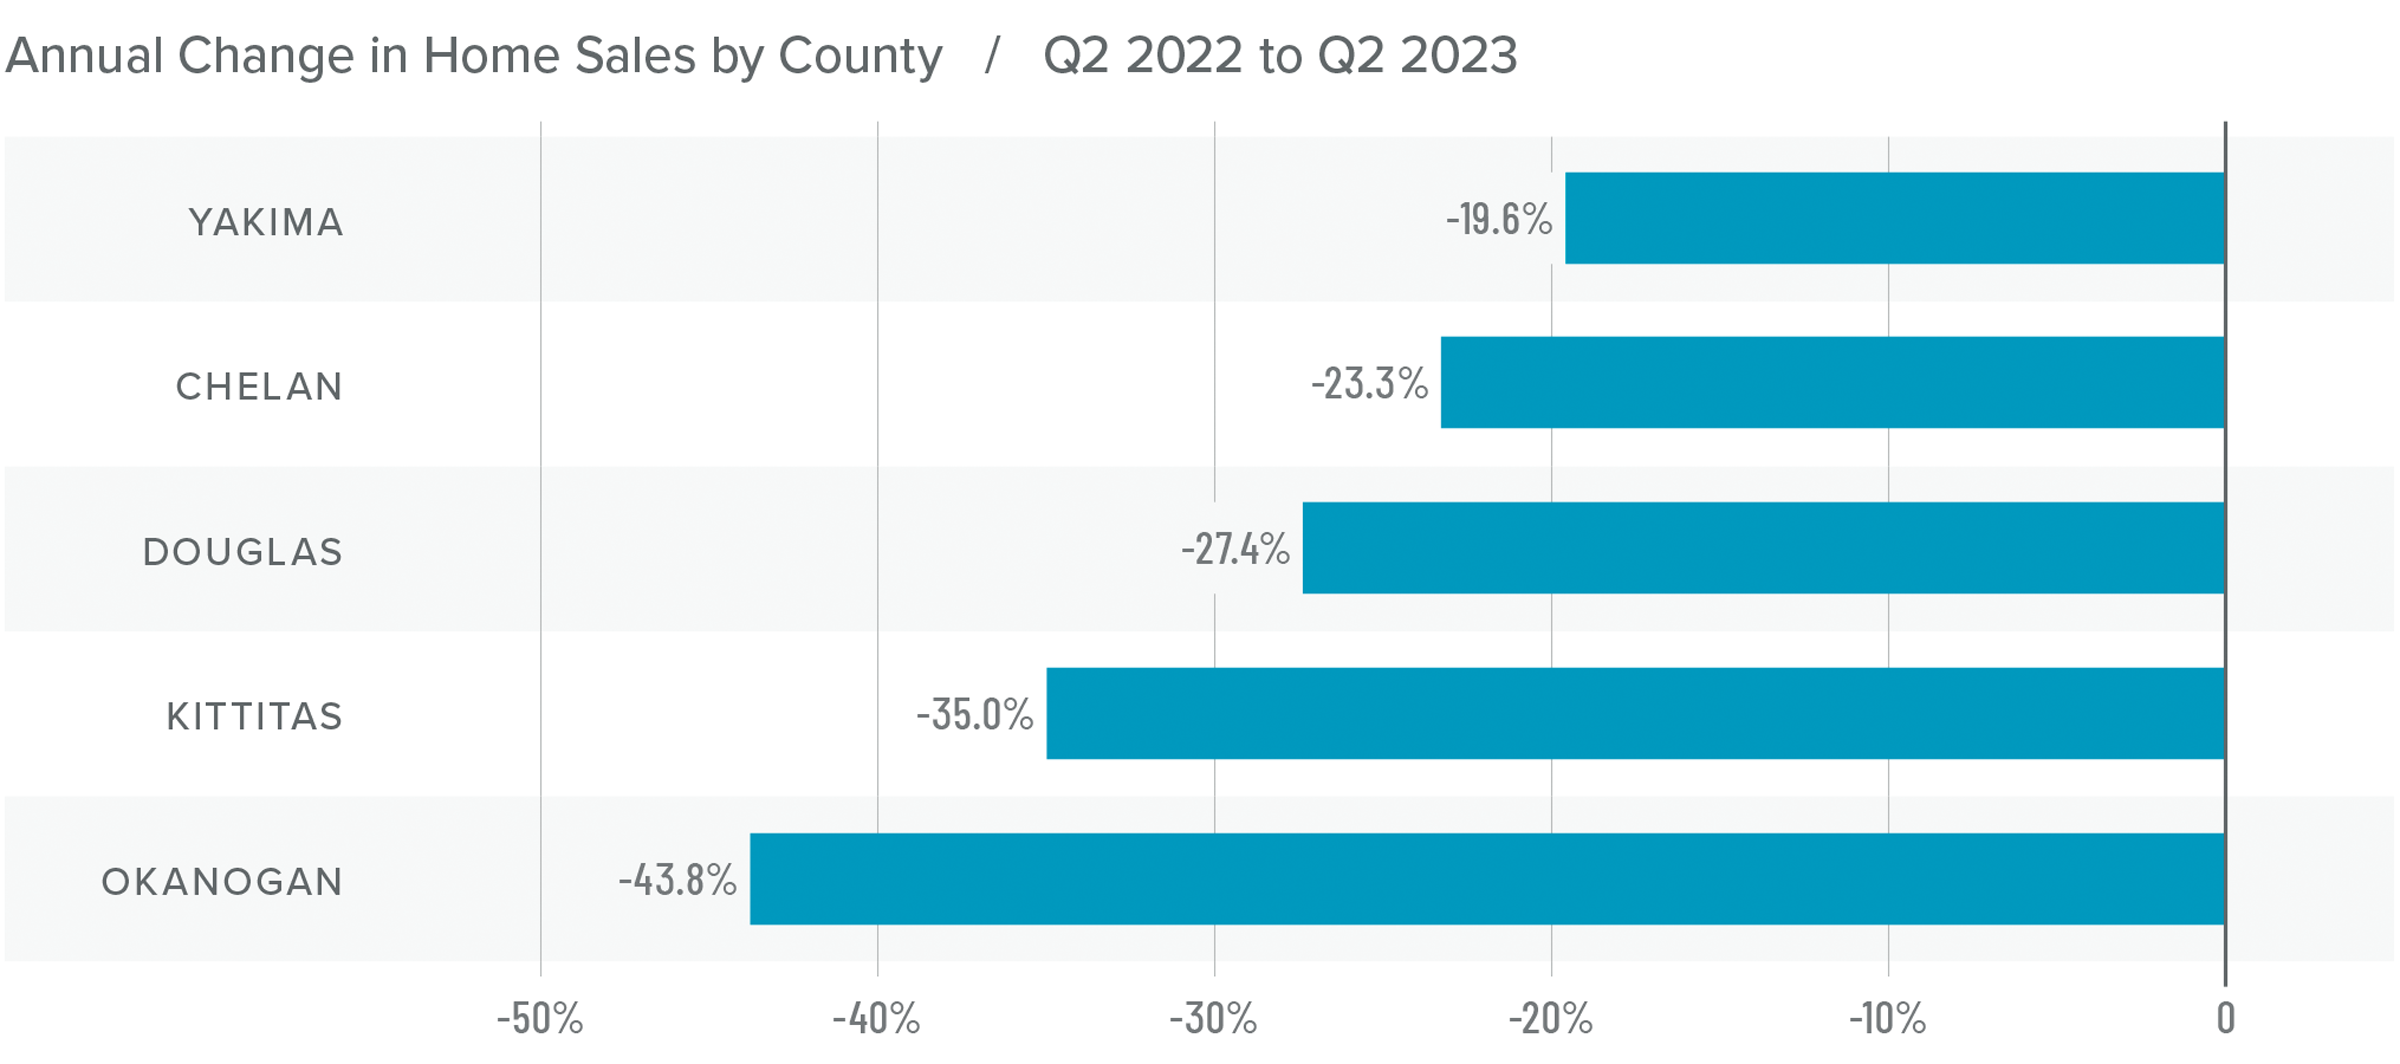
Central Washington Home Sales
❱ There were 1,007 home sales in Central Washington in the second quarter of 2023, representing a decline of 26.6% from the same quarter in 2022. Sales activity rose 63.5% from the first quarter of this year.
❱ Pending sales, which are an indicator of future closings, rose 48% compared to the first quarter of the year, suggesting that market momentum will likely continue through the summer.
❱ Year over year, sales fell significantly across the board. But the number of homes sold was up across the board compared to the first quarter.
❱ Inventory levels were modestly higher than the second quarter of 2022. However, the number of listings fell from the first quarter. Although this may sound impossible given the increase in sales, sometimes homes sell so quickly they’re not measured in the monthly data, which only looks at the number of homes available on the last day of the month.
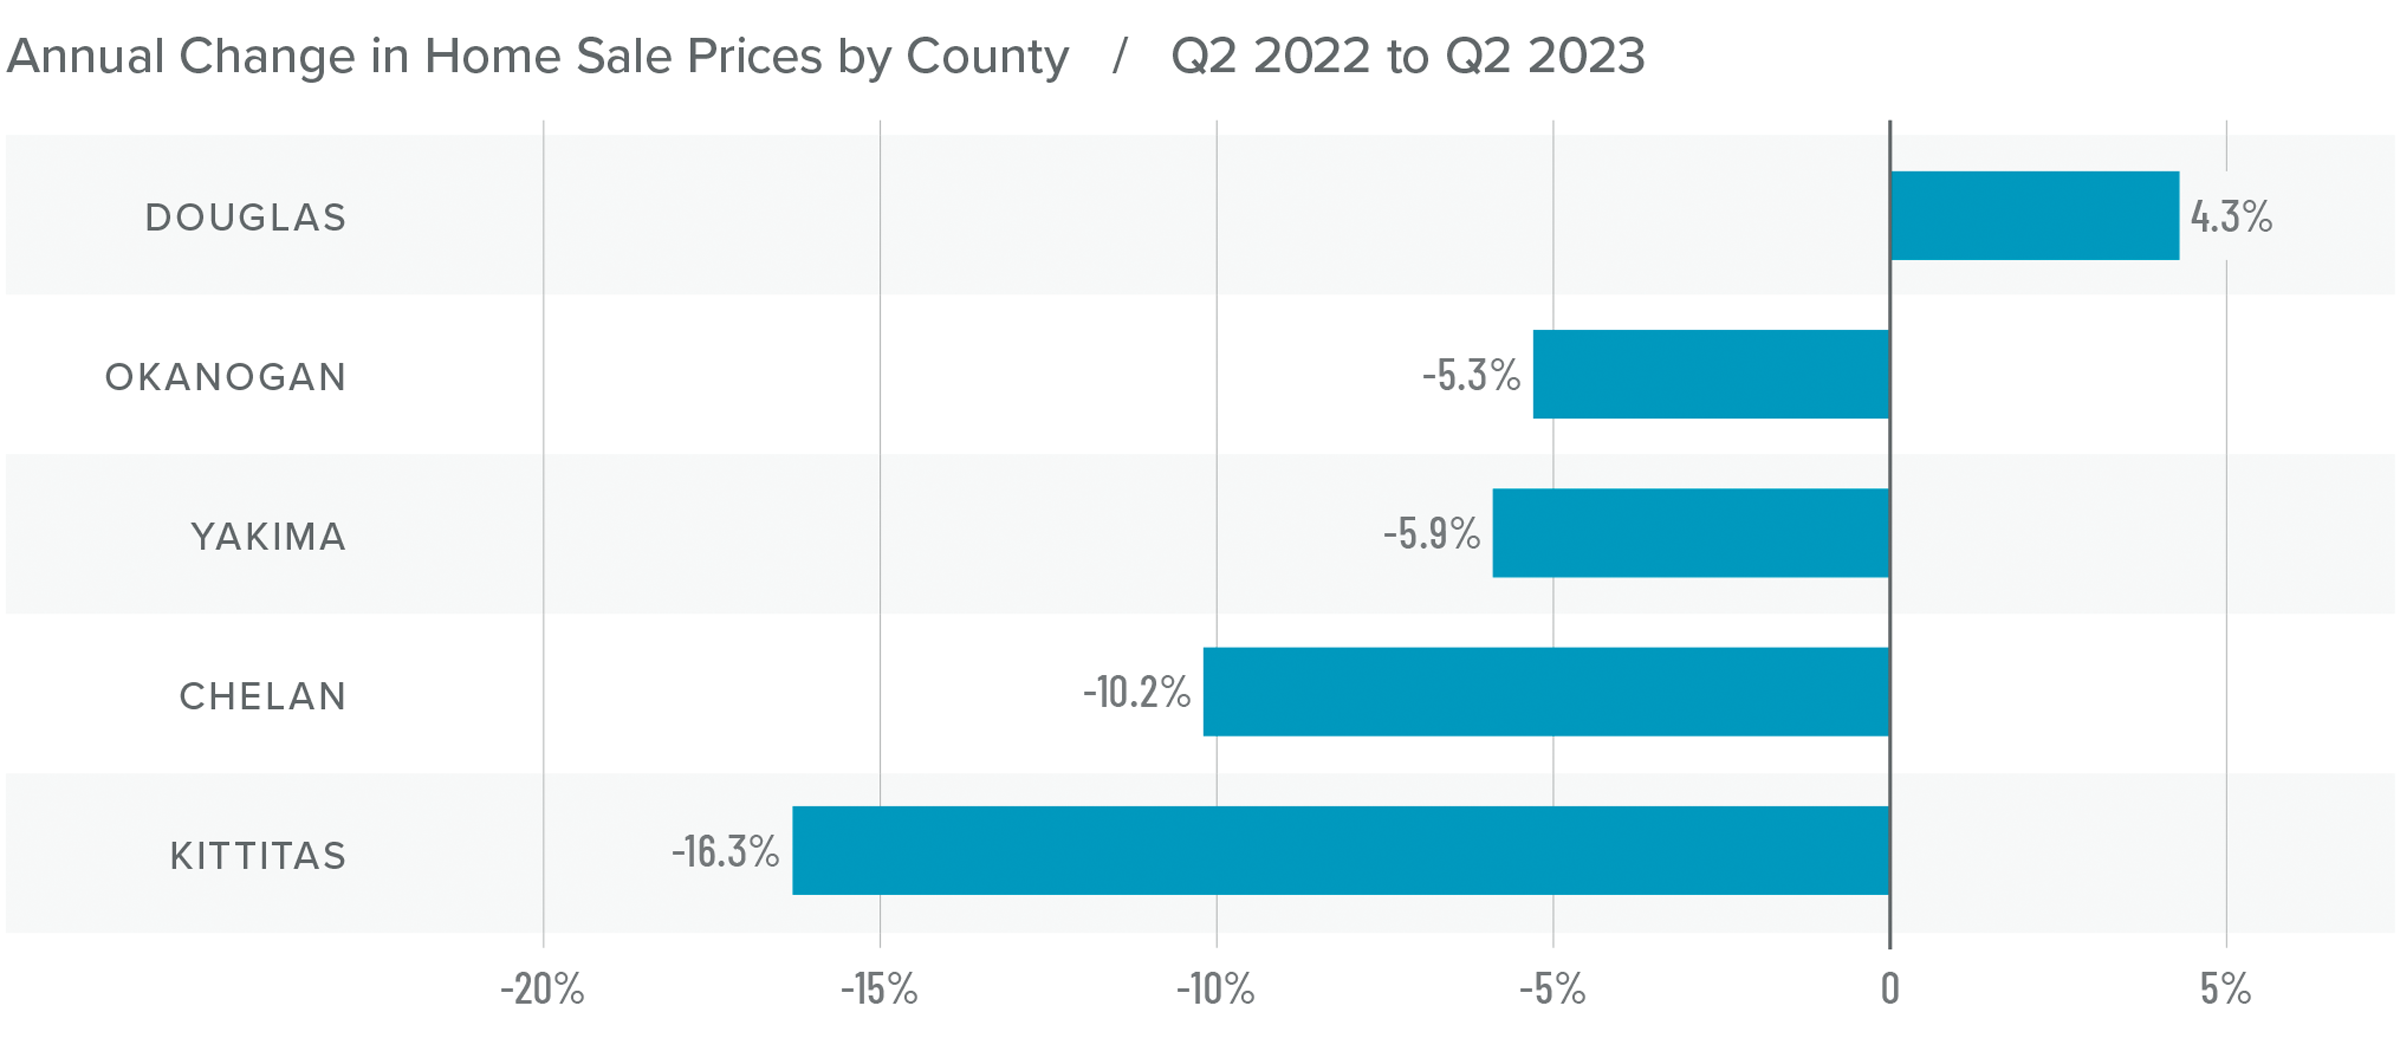
Central Washington Home Prices
❱ The average home price in Central Washington fell 9.7% year over year to $479,411, but sale prices were 4% higher than in the first quarter of this year.
❱ Median list prices rose in all counties except Yakima compared to the first quarter of the year, suggesting that home sellers are quite bullish about the prospects of successfully finding a buyer even as mortgage rates remain high.
❱ All counties except Douglas saw sale prices fall from the second quarter of 2022. Compared to the first quarter of this year, prices rose across all counties other than Kittitas.
❱ The second quarter experienced a positive turnaround from the first, when sales and prices were still falling. In last quarter’s report, I suggested that the market would return to stability this summer, but it appears to be happening faster than I anticipated.
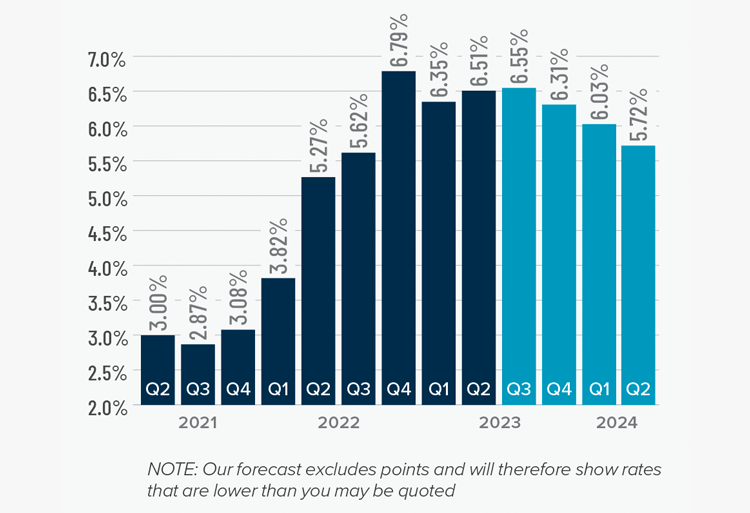
Mortgage Rates
Although they were less erratic than the first quarter, mortgage rates unfortunately trended higher and ended the quarter above 7%. This was due to the short debt ceiling impasse, as well as several economic datasets that suggested the U.S. economy was not slowing at the speed required by the Federal Reserve.
While the June employment report showed fewer jobs created than earlier in the year, as well as downward revisions to prior gains, inflation has not sufficiently slowed. Until it does, rates cannot start to trend consistently lower. With the economy not slowing as fast as expected, I have adjusted my forecast: Rates will hold at current levels in third quarter and then start to trend lower through the fall. Although there are sure to be occasional spikes, my model now shows the 30-year fixed rate breaking below 6% next spring.
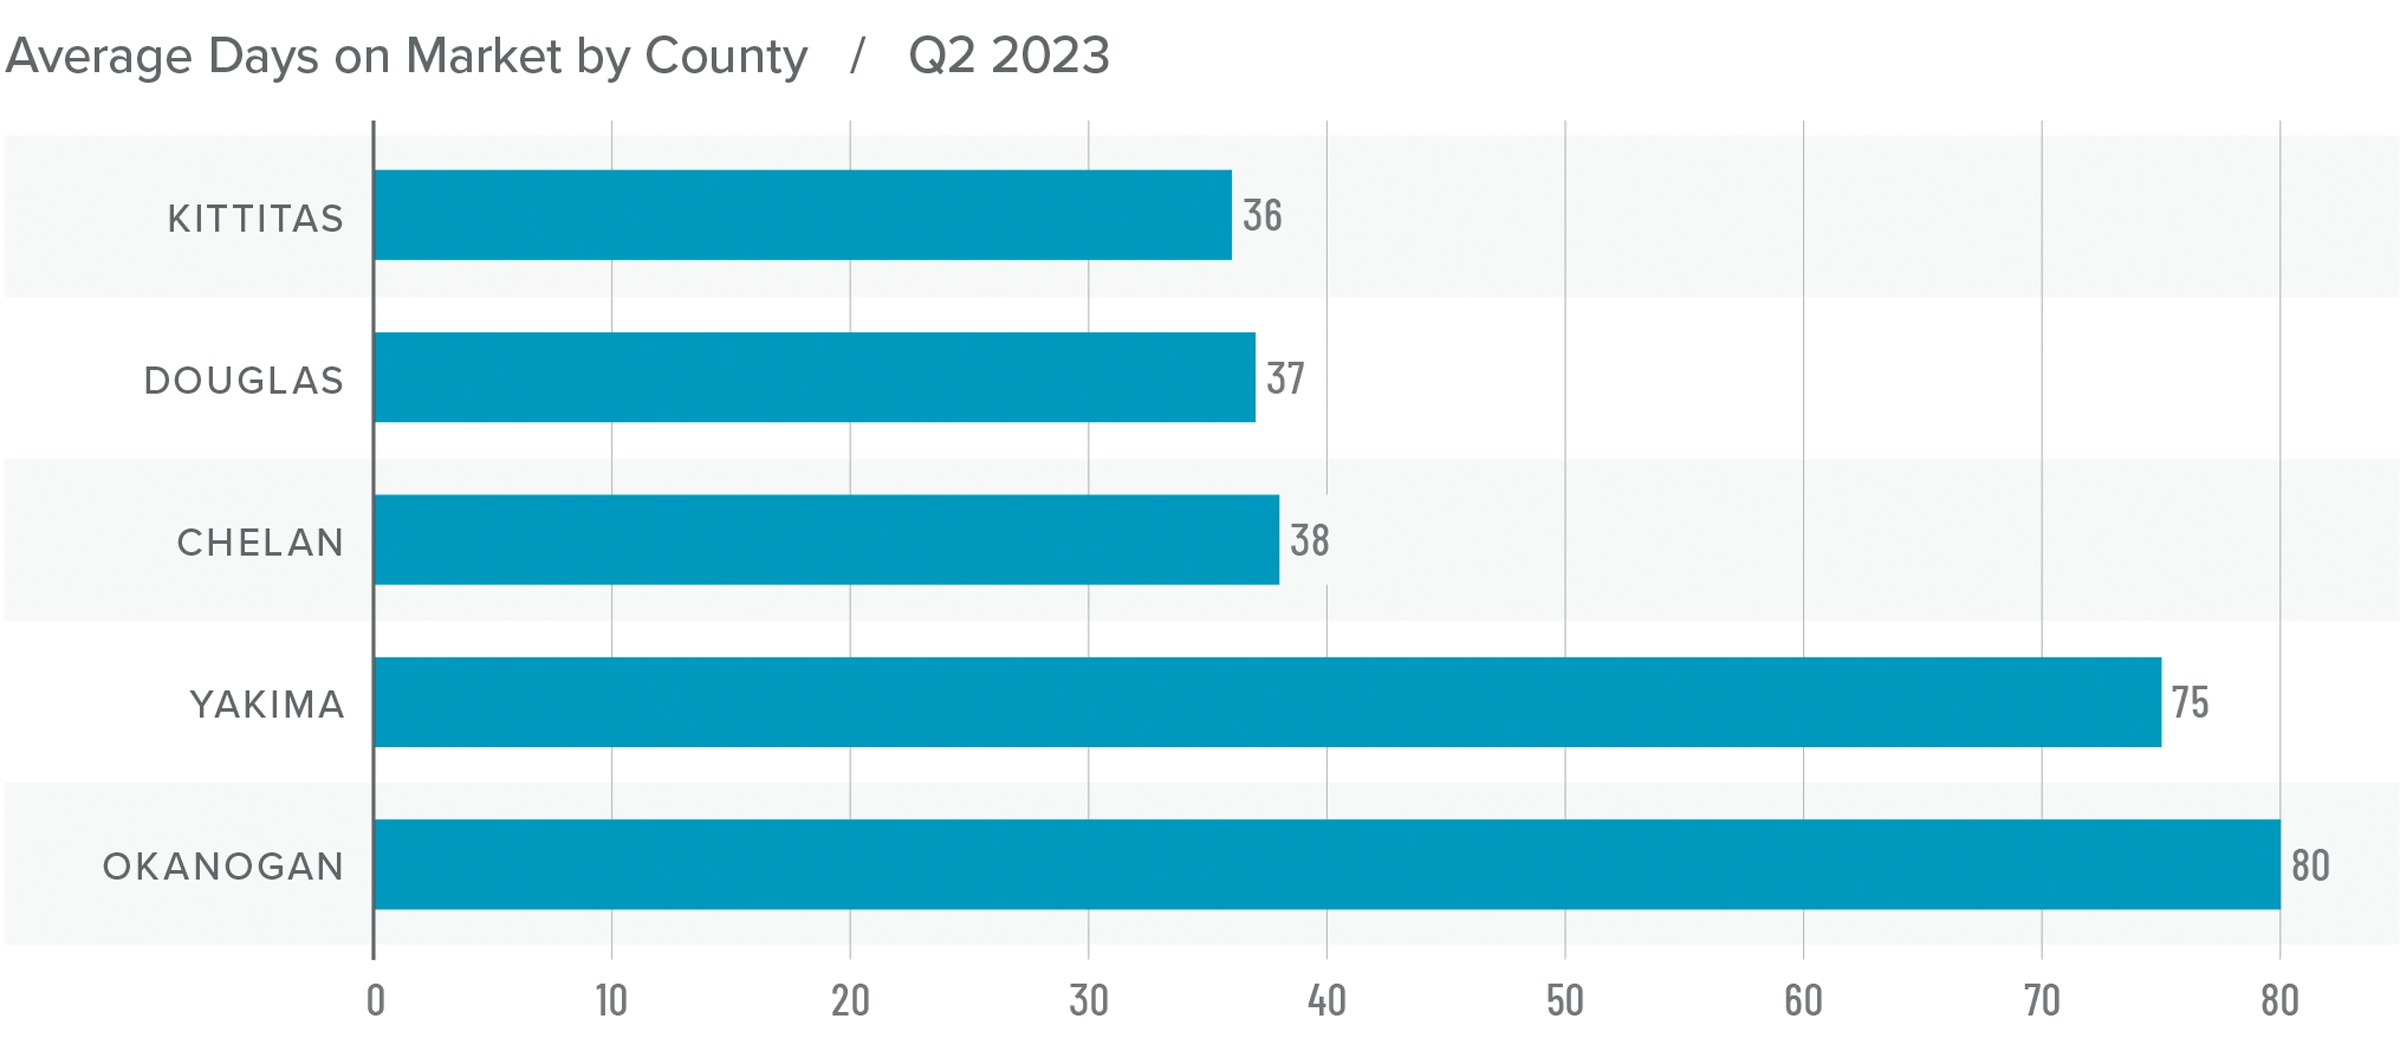
Central Washington Days on Market
❱ The average time it took to sell a home in Central Washington in the second quarter of 2023 was 53 days.
❱ It took 22 more days to sell a home in Central Washington than it did during the second quarter of 2022.
❱ Year over year, average market time rose in all counties, but it fell across the board compared to the first quarter of this year.
❱ On average, it took 18 fewer days to sell a home in the second quarter of 2023 than it did in the first.
Conclusions
This speedometer reflects the state of the region’s real estate market using housing inventory, price gains, home sales, interest rates, and larger economic factors.
Data for the quarter appears to favor home sellers, with tight inventory levels, rising prices and sales, and shorter market time. What is particularly interesting is that the market appears bullish in the face of financing costs that remain well above the levels buyers have become used to.
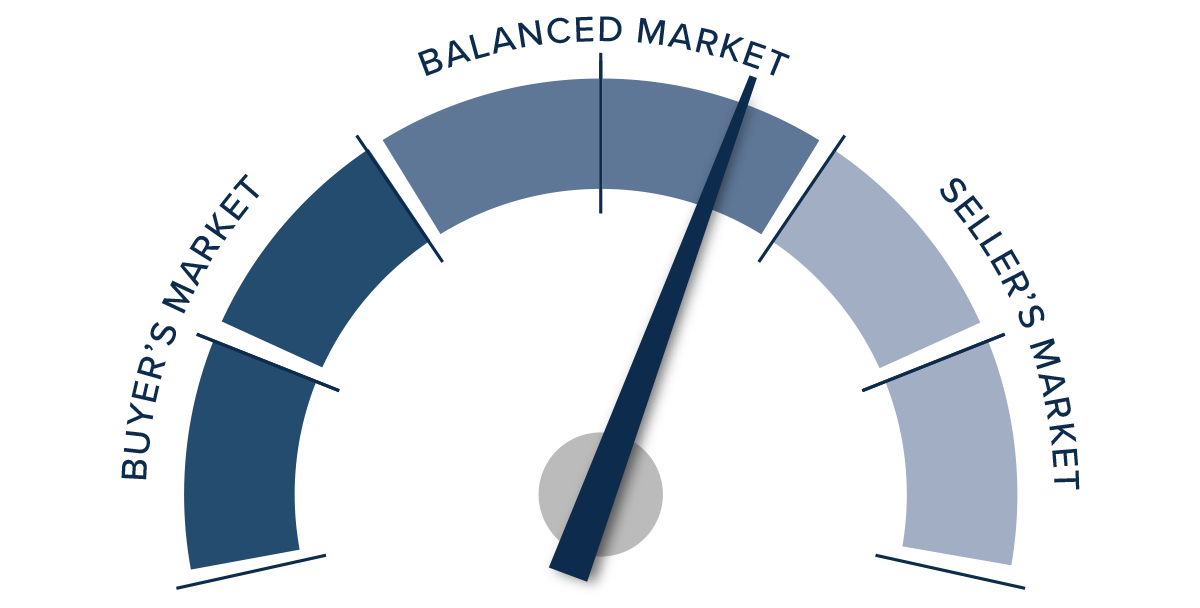
Last quarter, I chose to leave the needle in the balanced quadrant but tilted ever so slightly toward buyers. However, given all the data in this report, I must swing the needle more in favor of sellers. I am not saying it is staunchly a seller’s market given where mortgage rates are today, but they certainly appear to have the upper hand at the moment.
About Matthew Gardner
As Chief Economist for Windermere Real Estate, Matthew Gardner is responsible for analyzing and interpreting economic data and its impact on the real estate market on both a local and national level. Matthew has over 30 years of professional experience both in the U.S. and U.K.
In addition to his day-to-day responsibilities, Matthew sits on the Washington State Governors Council of Economic Advisors; chairs the Board of Trustees at the Washington Center for Real Estate Research at the University of Washington; and is an Advisory Board Member at the Runstad Center for Real Estate Studies at the University of Washington where he also lectures in real estate economics.
")


